. 2018 Sep 5;99(5):969-984.e7.
doi: 10.1016/j.neuron.2018.07.030. Epub 2018 Aug 16.

Two Forms of Synaptic Depression Produced by Differential Neuromodulation of Presynaptic Calcium Channels

Affiliations

Two Forms of Synaptic Depression Produced by Differential Neuromodulation of Presynaptic Calcium Channels

Kenneth J Burke Jr et al. Neuron. .

Abstract

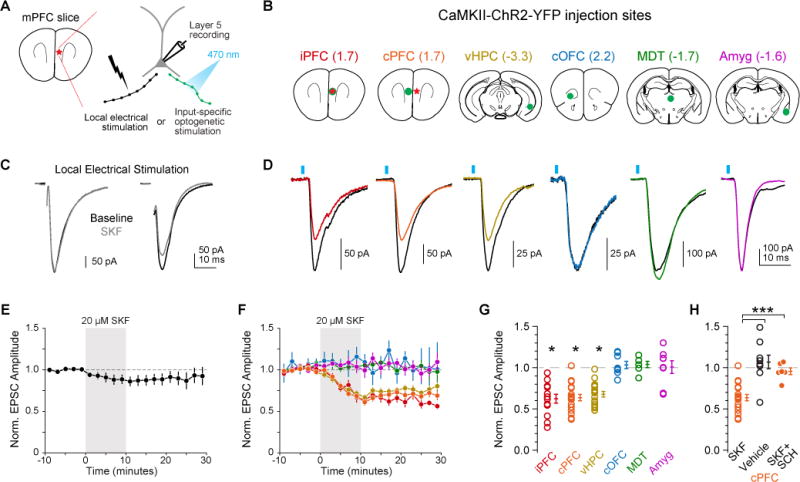
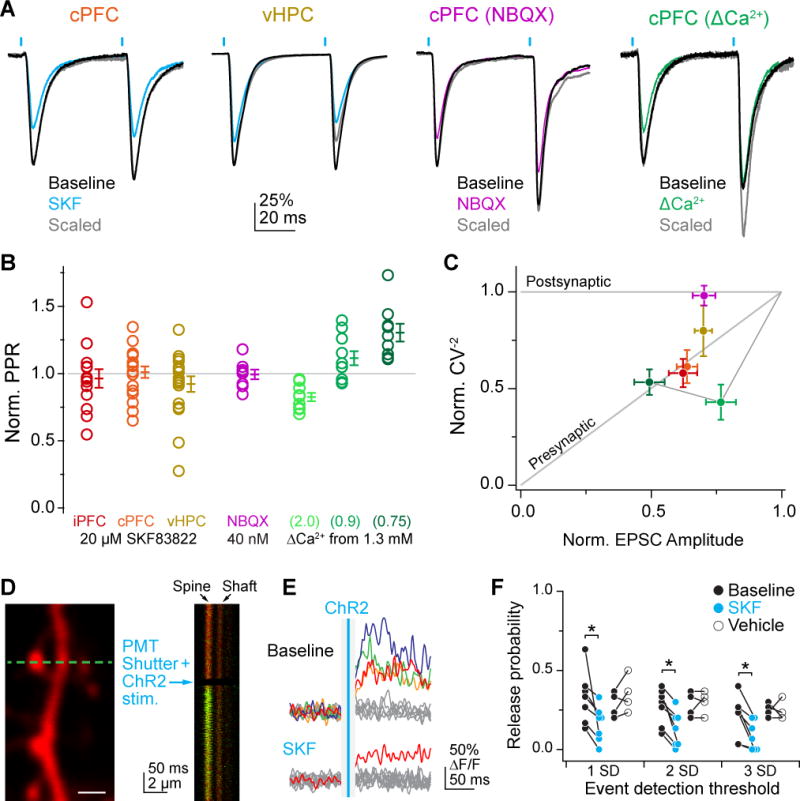
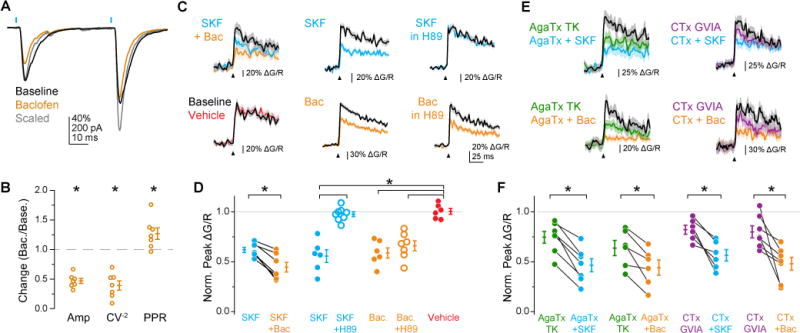
Neuromodulators are important regulators of synaptic transmission throughout the brain. At the presynaptic terminal, neuromodulation of calcium channels (CaVs) can affect transmission not only by changing neurotransmitter release probability, but also by shaping short-term plasticity (STP). Indeed, changes in STP are often considered a requirement for defining a presynaptic site of action. Nevertheless, some synapses exhibit non-canonical forms of neuromodulation, where release probability is altered without a corresponding change in STP. Here, we identify biophysical mechanisms whereby both canonical and non-canonical presynaptic neuromodulation can occur at the same synapse. At a subset of glutamatergic terminals in prefrontal cortex, GABAB and D1/D5 dopamine receptors suppress release probability with and without canonical increases in short-term facilitation by modulating different aspects of presynaptic CaV function. These findings establish a framework whereby signaling from multiple neuromodulators can converge on presynaptic CaVs to differentially tune release dynamics at the same synapse.

Keywords: dopamine; neuromodulation; prefrontal cortex; short-term plasticity; synaptic transmission.


Conflict of interest statement

Declaration of interests:

The authors declare no competing interests.

Figures

Fig 1
Fig 1. D1R Suppresses a Subset of Excitatory Synapses in PFC
A) Schematics of in vitro recording location in mPFC (left) and stimulation configurations (right). EPSCs currents were evoked via local theta-barrel electrode or by input-specific ChR2 stimulation. B) ChR2-expressing virus injection locations, with injection sites shown in green and recording site in red where applicable. Numbers in parenthesis are distance from bregma (mm). C) Representative effects of D1R activation on electrode-evoked eEPSCs. Baseline: black. Post-SKF: grey. D) Same as C, but for oEPSCs. Baseline: black. Post SKF: other colors. E, F) Summary of normalized EPSC amplitude over time for both eEPSC and oEPSC conditions (color coding as in B–D). G) Summary of change in EPSC after D1R activation (same cells as in F). H) Modulation of cPFC oEPSCs with vehicle or D1R activation in presence of D1R antagonist SCH23390.
Fig 2
Fig 2. D1R Modulates oEPSC Amplitude, Coefficient of Variation and Release Probability, but not Paired-Pulse Ratio
A) Examples of D1R modulation of paired pulses. Baseline: black. Post-SKF: cyan. Post-SKF scaled: grey. From left to right: D1R activation of oEPSCs from cPFC and vHPC, subsaturating NBQX on cPFC oEPSCs (40 nM) and reduced extracellular calcium on cPFC oEPSCs. All traces scaled to baseline amplitude of first oEPSC for comparison. B) Summary of PPR change. Colors as in A, with D1R activation of iPFC oEPSCs in red. All values normalized to pre-drug baseline, except ΔCa conditions are normalized to PPR at 1.3 mM. C) Normalized CV plotted against change in oEPSC amplitude. Colors as in B. Line connects green ΔCa conditions in order of decreasing extracellular Ca concentration. D) Spine imaging configuration for OQA. Left: Example of Alexa 594 fluorescence in dendritic shaft and spines, with linescan location indicated by dashed blue line. Right: Example single trial linescan of dendritic spine and shaft on left. PMTs were shuttered during LED stimulation. Note that shutter reopening resulted in a small amount of vibration, which is largely cancelled out when averaging fluorescence over the spine head area of the linescan. E) Trials before and after bath application of SKF. Data analyzed from Fluo-5F fluorescence only (ΔF/F). Grey and non-grey lines indicate failure and success trials, respectively. Blue vertical line is ChR2 timing. F) Changes in PR with D1R stimulation or vehicle. All PR measures are calculated as the ratio of successful trials to total trials. Different thresholds for defining a success trial are shown along the x-axis.
Fig 3
Fig 3. D1R Suppresses Evoked Axonal Calcium Influx in PFC
A) Long-range axon imaging configuration. Left: Schematic of recording. Injection site in green, stimulation and imaging location in red box. Middle: Example fluorescence response of axonal boutons. Red fluorescence was used to locate boutons, green fluorescence was monitored in response to electrical stimulation. Arrows highlight two boutons quantified in right panel. Right: Normalized change in fluorescence for example boutons from middle panels. B) Evoked gCaMP6f signals in PFC boutons. SKF-mediated suppression was blocked by SCH23390. C) Summary of change in peak ΔF/F in response to D1R activation for different long-range iputs to PFC (colors as in Figs. 1–2). D) Summary of modulation of peak ΔF/F responses from cPFC axonal boutons with vehicle application or D1R activation in presence of D1R antagonist SCH23390.
Figure 4
Figure 4. GABABR Suppresses Presynaptic Calcium Influx with Canonical Increase in PPR
A) Example of GABABR modulation of cPFC oEPSCs and PPR (as in Fig. 2A). B) Summary of GABABR modulation of oEPSC amplitude, CV−2 and PPR. C) Examples of AP-evoked bouton calcium transients for D1R followed by GABABR activation, D1R activation alone, D1R activation with 10 μM H89, vehicle application, GABABR activation alone, or GABABR activation with H89. Data plotted as mean ΔG/R with shaded error bars indicating within-condition SEM. D) Summary of change in peak ΔG/R for conditions in C. E) Example responses, as in C, for effects of D1R or GABABR activation with concurrent CaV2.1 or CaV2.2 block. F) Summary of change in peak ΔG/R for conditions in E.
Figure 5
Figure 5. CaV Antagonists with Different Binding Kinetics Mimic D1R and GABABR
A) Example cell with increasing manganese concentrations. Left: raw oEPSCs. Right: scaled to initial oEPSC amplitude. B) Summary for manganese effects on oEPSC amplitude and PPR. C–D) Same as A–B, but for cadmium. E–F) Normalized PPR and CV−2 for manganese and cadmium conditions vs. normalized oEPSC amplitude. D1R and GABABR modulation shown in cyan and orange, respectively, for reference.
Figure 6
Figure 6. D1R and GABABR Modulate Different Biophysical Properties of Presynaptic CaVs
A) OFA recording configuration. Left: Schematic for local axonal bouton imaging. Center: Z-projection image of dendritic and axonal processes containing Alexa 594. Right: magnification of center panel highlighting two boutons in series along axon branch. B) Bouton calcium response. Top: Mean membrane voltage (Vm) in response to short-duration somatic current injection (2–2.5 nA × 2 ms). Middle: Example mean fluorescence response of axonal bouton over 20 trials (note: 2-photon excitation begins with 50 ms delay to measure dark noise). Bottom: Mean ΔG/R response as a function of time for data in middle panel (dashed line indicates baseline fluorescence; timepoints before laser excitation excluded for clarity). C) Top: mean response, green channel only. Numbers and black bars indicate time range for calculating 1) dark noise, 2) baseline and 3) peak mean and variance. Bottom: variance, Var(F), compared to variance predicted by dark and shot noise alone (black trace). Arrowhead: AP timing. D) Variance-Mean plot before and after vehicle application. Variance and mean fluorescence were measured at baseline (empty squares, “Pre-AP”) and peak response (empty circles, “Peak AP”) time ranges (ranges 2 and 3 from Fig. 6C, respectively). All values corrected for dark noise. Shot noise measurements shown for reference (filled squares and linear fit). Error bars are 1 S.D. from estimates obtained from multiple timepoints per range. E) Peak ΔG/R response of a single bouton over time. Grey points represent individual trials, open circles are average of 20 trials. F, G) Peak ΔG/R responses of boutons before and after D1R or GABABR activation. H) Mean ΔG/R with individual trials for baseline (top) and post-drug (bottom) conditions with D1R activation. I) Variance-mean plot for one cell before (black) and after (cyan) D1R activation (same cell as in Fig. 6H). J, K) Example cell with GABABR activation, as in H, I. L) Normalized CaV-associated Variance versus Normalized Peak Amplitude. (Vehicle, peak ΔG/R=1.01±0.03, CV−2=1.02±0.10, n=6)
Figure 7
Figure 7. Model of Synapse Reproduces Non-Canonical Presynaptic Modulation
A) Reduced Model of Presynaptic Release. Rows are possible trial outcomes for different CaV popen values for a single bouton given release mediated by one presynaptic CaV. Columns, from left to right: presynaptic calcium concentration (purple/green tick marks indicate first and second AP), fraction of trials where this occurred, PR as a function of calcium concentration (calcium concentrations for two APs indicated by purple/green lines), total average EPSC across synapses and trials. B, C) As in A, but with CaV single-channel current iCaV or open probability popen reduced to 60% of baseline to mimic OFA results for GABABR and D1R, respectively. D) Suppression of EPSC by graded reduction in iCaV with release mediated by one presynaptic CaV. Left: Colors indicate fraction reduction in iCaV. Right: scaled to first EPSC amplitude. E) Suppression of EPSC by graded reduction in popen, as in D. F) Suppression of EPSC by graded reduction in popen, with release mediated by 20 CaVs. G) Normalized PPR vs. normalized EPSC amplitude for reductions in iCaV, qvesicle or popen under different numbers of presynaptic CaVs mediating release. H) Normalized PPR with reduction in popen to 60% of baseline, as a function of number of presynaptic CaVs mediating release. Grey line indicates no change in PPR. Inset: Expanded view of first few channel numbers. I) Normalized CV−2 plotted against normalized EPSC amplitude for reductions in iCaV, qvesicle or popen under different numbers of presynaptic CaVs mediating release.
Figure 8
Figure 8. D1R and GABABR Differentially Filter Ongoing Synaptic Activity
A) Train of ten oEPSCs at 20 Hz before and after D1R stimulation. B) Expanded view of first and tenth oEPSC. C–D) As in A–B but with GABABR stimulation. E) Modulation of ongoing activity at 20 Hz. Left: oEPSC amplitudes before and after D1R stimulation. Right: As on left, but with GABABR activation. F) Suppression of ongoing activity relative to first amplitude. The charge ratio was consistently larger for GABABR activation than for D1R activation across multiple frequencies. “Mixed Intervals” was a predetermined combination of 3 inter-stimulus intervals at 5, 10 and 20 Hz, shuffled. G) Recording configuration for current-clamp experiments. Top: Train of LED pulses to activate ChR2-positive long-range inputs from cPFC (color-coded by preceding interval being equal to or faster than 1 Hz for pink and green tic marks, respectively). Middle: Simulated PSC waveform injected into the soma through the recording electrode. Bottom: Recorded membrane voltage. H) Modulation of spike timing. Top: Example raster plot (same cell as in G) of spike times over trials with different injected PSC waveforms before (above, “Baseline”) and after (below, “SKF”) D1R activation. Bottom: As above, but with GABABR activation. Black tic marks indicate spike times, pink and green bars indicate timing of 1Hz and >1Hz LED pulses, respectively. I) Modulation of LED-evoked spiking. Top: Instantaneous frequency of spiking aligned to 1Hz LED stimuli, averaged across cells, before and after D1R and GABABR activation for left and right plots, respectively (n=6 and 8 for D1R and GABABR). Bottom: As above, but aligned to 20Hz LED stimuli. J) Summary data of neuromodulation of LED-evoked spiking. Bars are mean ± SEM. Circles are single cells.

References

    1. Abbott LF, Regehr WG. Synaptic computation. Nature. 2004;431:796–803. - PubMed
    1. Abbott LF, Varela JA, Sen K, Nelson SB. Synaptic depression and cortical gain control. Science. 1997;275:220–224. - PubMed
    1. Allbritton NL, Meyer T, Stryer L. Range of messenger action of calcium ion and inositol 1,4,5-trisphosphate. Science. 1992;258:1812–1815. - PubMed
    1. Arnsten AF, Cai JX, Murphy BL, Goldman-Rakic PS. Dopamine D1 receptor mechanisms in the cognitive performance of young adult and aged monkeys. Psychopharmacology (Berl) 1994;116:143–151. - PubMed
    1. Barth AL, Poulet JFA. Experimental evidence for sparse firing in the neocortex. Trends Neurosci. 2012;35:345–355. - PubMed

Publication types

MeSH terms