. 2018 Nov 6;28(5):706-720.e6.
doi: 10.1016/j.cmet.2018.07.021. Epub 2018 Aug 16.

Cytosolic Aspartate Availability Determines Cell Survival When Glutamine Is Limiting

Affiliations

Cytosolic Aspartate Availability Determines Cell Survival When Glutamine Is Limiting

H Furkan Alkan et al. Cell Metab. .

Abstract

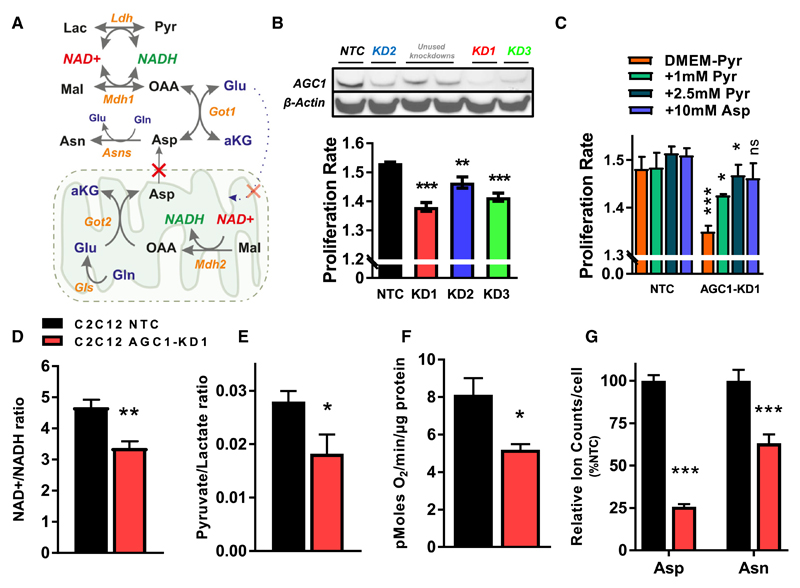
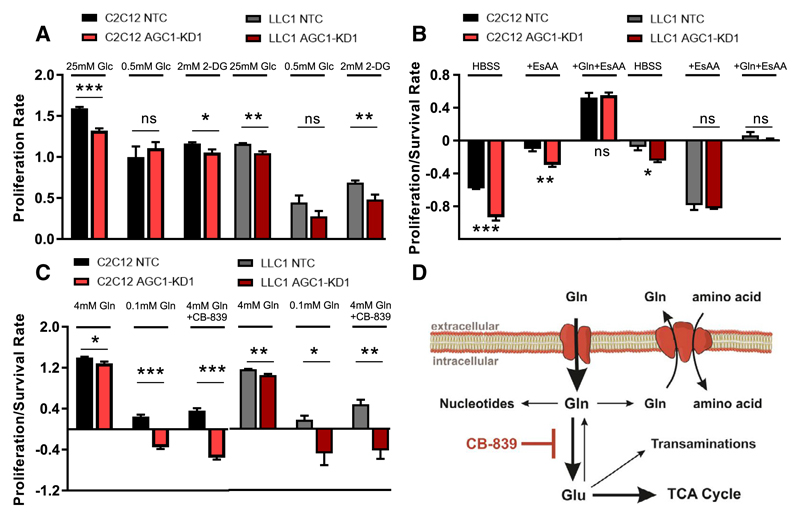
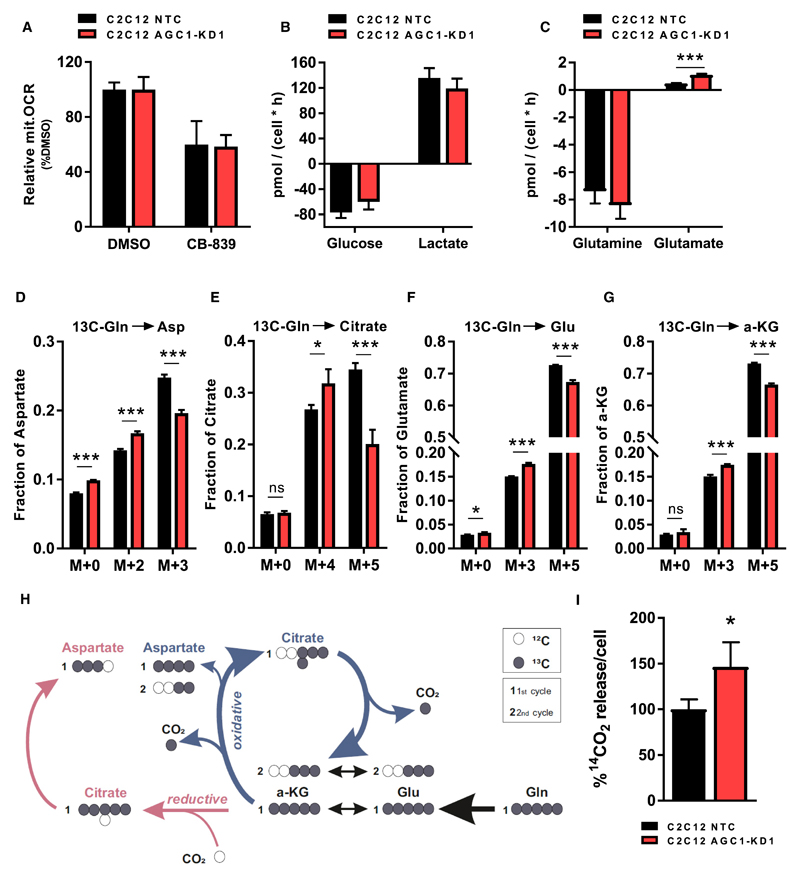
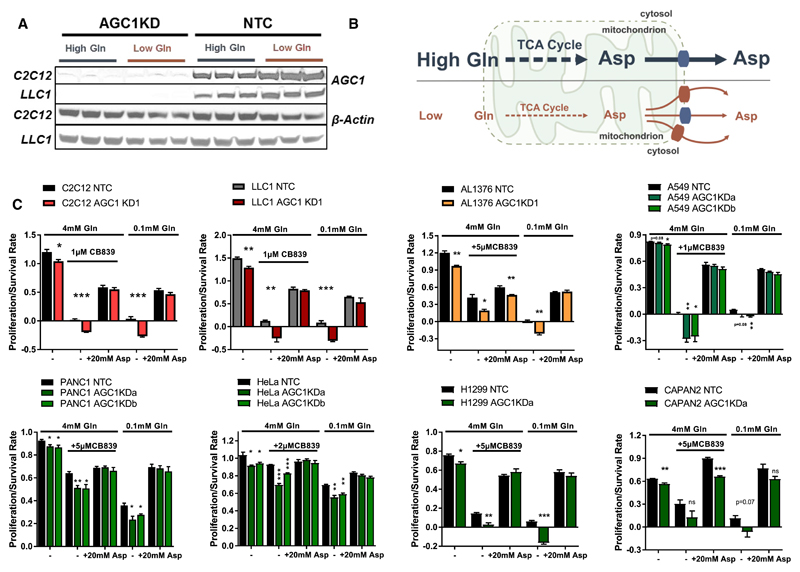
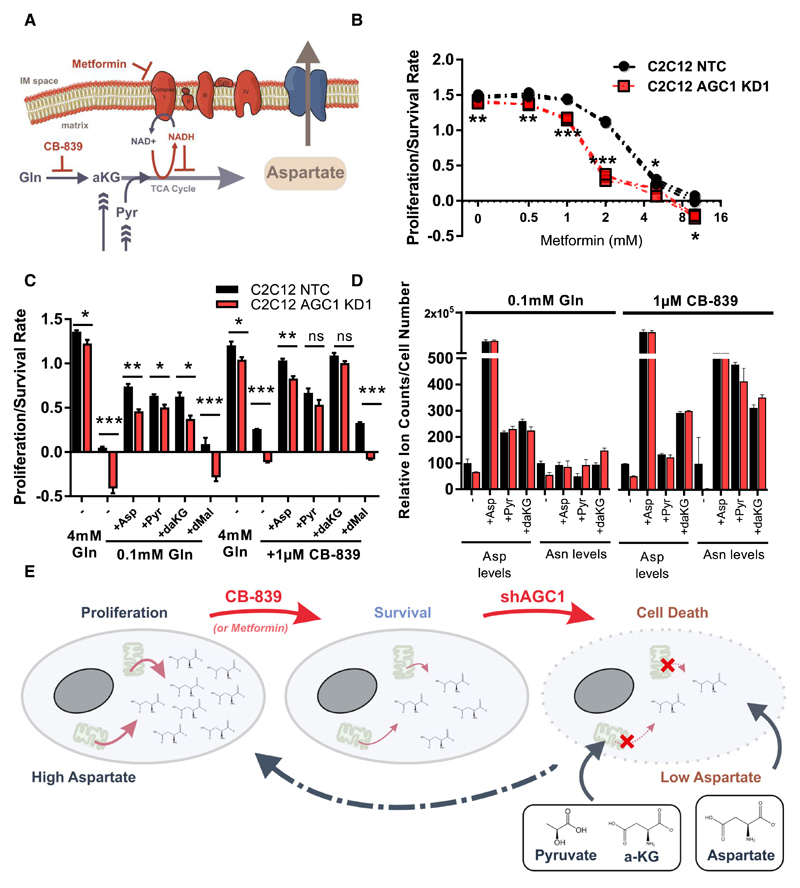
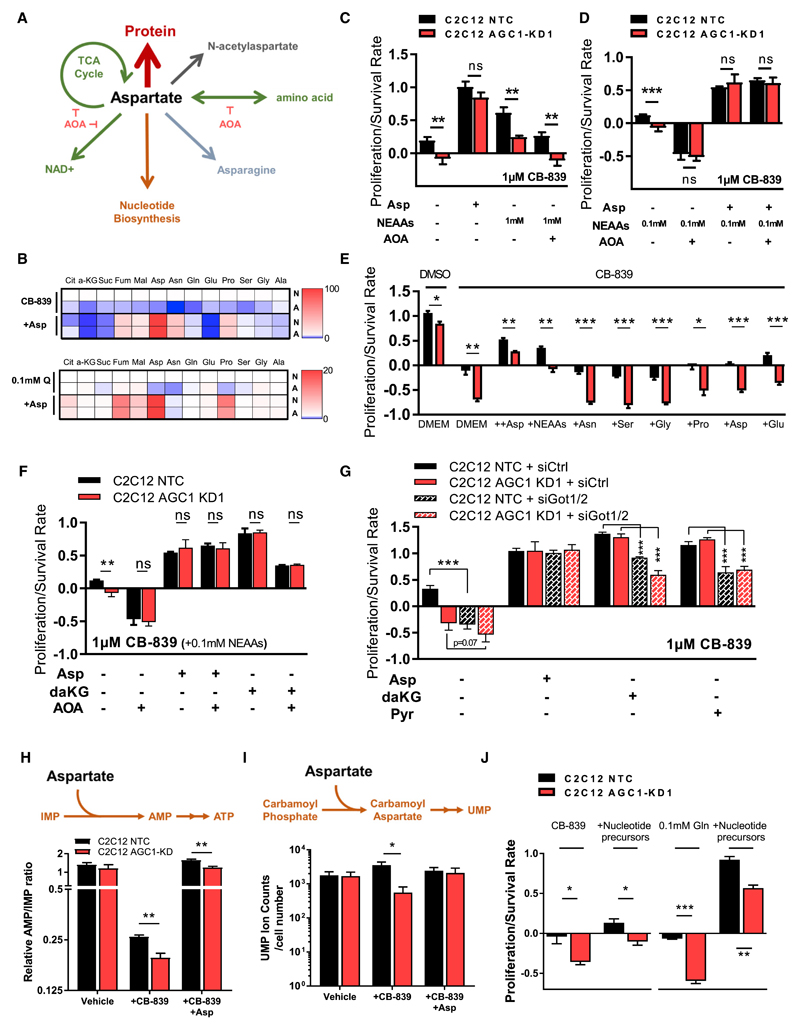
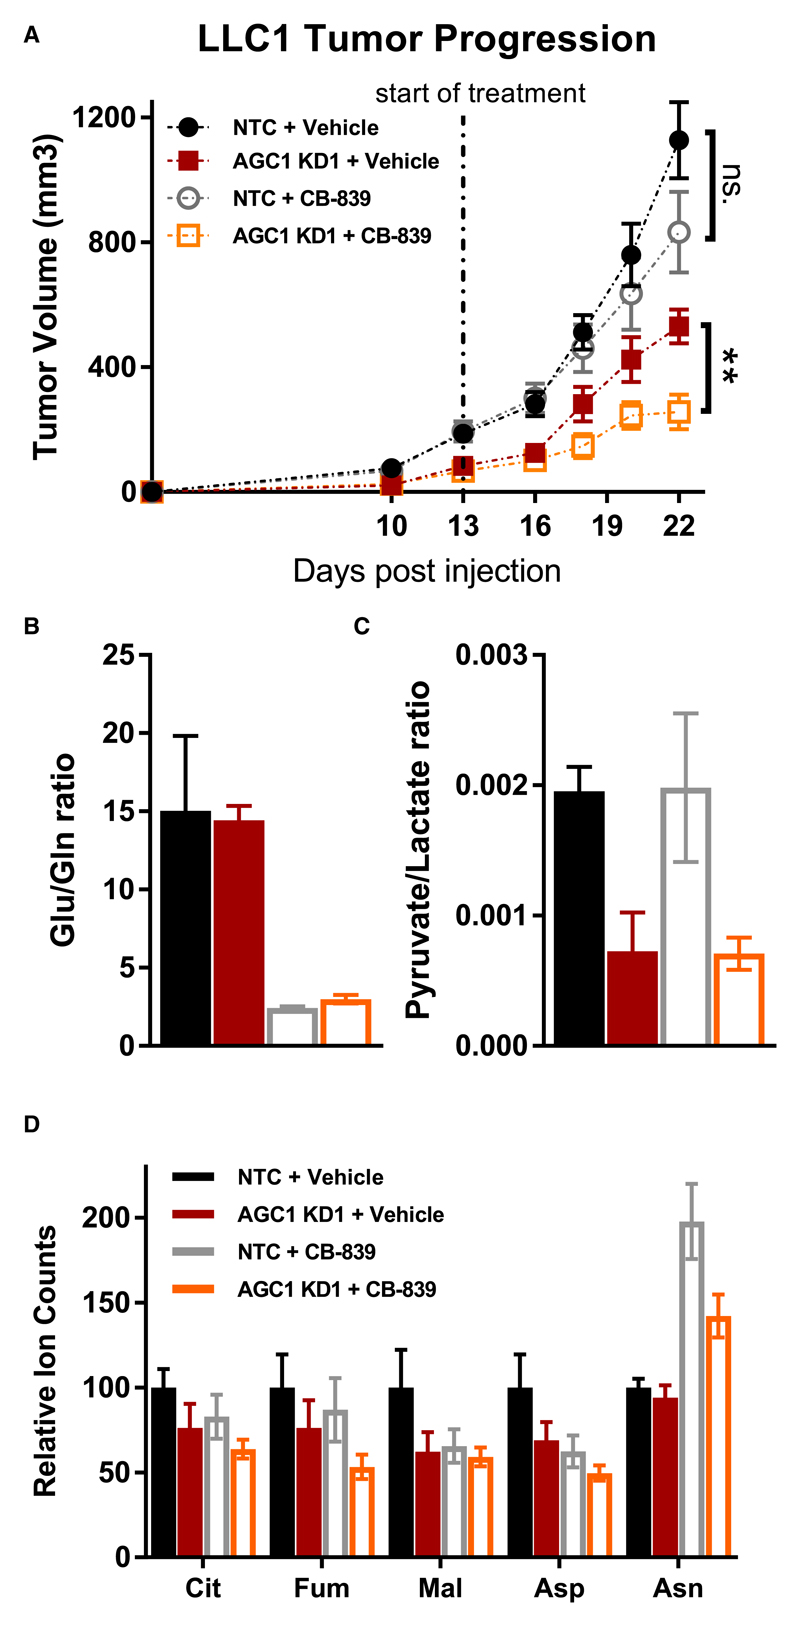
Mitochondrial function is important for aspartate biosynthesis in proliferating cells. Here, we show that mitochondrial aspartate export via the aspartate-glutamate carrier 1 (AGC1) supports cell proliferation and cellular redox homeostasis. Insufficient cytosolic aspartate delivery leads to cell death when TCA cycle carbon is reduced following glutamine withdrawal and/or glutaminase inhibition. Moreover, loss of AGC1 reduces allograft tumor growth that is further compromised by treatment with the glutaminase inhibitor CB-839. Together, these findings argue that mitochondrial aspartate export sustains cell survival in low-glutamine environments and AGC1 inhibition can synergize with glutaminase inhibition to limit tumor growth.

Keywords: AGC1; Aralar; SLC25A12; aspartate-glutamate carrier; cancer metabolism; glutamine metabolism.


Conflict of interest statement

Declaration of Interests

M.G.V.H. discloses that he is a consultant and scientific advisory board member for Agios Pharmaceuticals and Aeglea Biotherapeutics, and T.M. discloses that he is a consultant and scientific advisory board member of Cleara Biotech.

Figures

Figure 1
Figure 1. AGC1 Knockdown Decreases Cytosolic Aspartate Levels and Increases Dependence on Exogenous Electron Acceptors
(A) Schematic showing how aspartate can regenerate NAD+ in the cytosol through the MAS involving glutamate-oxaloacetate transaminase (Got1) and malate dehydrogenase (Mdh1). (B) AGC1 KD in C2C12 cells using different shRNA hairpins was assessed by western blot as shown. Also shown is the fold change in viable cell number (proliferation rate) of control (NTC) and cells expressing three of the five hairpins (KD1, KD2, and KD3) as doublings/day (n = 3). (C) Relative proliferation rate of control (NTC) and AGC1-KD1 C2C12 cells in the presence and absence of the indicated concentrations of pyruvate (Pyr) and aspartate (Asp) (n = 3). (D) NAD+/NADH ratio of control (NTC) and AGC1-KD1 C2C12 cells cultured in pyruvate-free DMEM (n = 5). Means ± SEM are shown. (E) Pyruvate to lactate ratio of control (NTC) and AGC1-KD1 C2C12 cells cultured in pyruvate-free media (n = 3). (F) Mitochondrial oxygen consumption rate of control (NTC) and AGC1-KD1 C2C12 cells cultured in serum-free, phenol-red free media containing 5 mM glucose, 1 mM sodium pyruvate, and 2 mM glutamine (n = 3, each including 7–8 technical replicates). (G) Relative cellular aspartate and asparagine levels of control (NTC) and AGC1-KD1 C2C12 cells cultured in standard DMEM without pyruvate (n = 3). All figures denote mean ± SD unless indicated otherwise. *p ≤ 0.05, **p ≤ 0.01, ***p ≤ 0.001. See also Figure S1.
Figure 2
Figure 2. AGC1-KD Cells Are Sensitive to Glutamine Depletion
(A) Proliferation rate of control (NTC) and AGC1-KD (AGC1-KD1) C2C12 and LLC1 cells cultured in pyruvate-free DMEM containing 25 or 0.5 mM glucose (Glc), or 25 mM glucose and 2 mM 2-deoxyglucose (2-DG), as indicated (n = 5). (B) Proliferation/survival rate of control (NTC) and AGC1-KD1 C2C12 and LLC1 cells cultured in pyruvate-free HBSS containing 5 mM glucose supplemented with 10% FBS and vitamins, with or without essential amino acids (EsAAs) and glutamine (Gln), as indicated (n = 3). (C) Proliferation/survival rate of control (NTC) and AGC1-KD1 C2C12 and LLC1 cells cultured in pyruvate-free DMEM containing 4 or 0.1 mM glutamine (Gln), or 4 mM glutamine and 1 μM CB-839 (glutaminase inhibitor), as indicated (n = 5). (D) Schematic showing some potential fates of glutamine in a cell. All panels show mean ± SEM. *p ≤ 0.05, **p ≤ 0.01, ***p ≤ 0.001. See also Figure S1.
Figure 3
Figure 3. AGC1-KD Cells Exhibit Increased Oxidative TCA Cycle Metabolism
(A) Relative mitochondrial oxygen consumption rate (mit.OCR) of control (NTC) and AGC1-KD1 C2C12 cells cultured for 6 hr in pyruvate-free DMEM containing 4 mM glutamine with or without CB-839 (n = 5); data normalized to percent change compared to DMSO treatments of each group. Means ± SEM are shown. (B and C) Uptake/consumption rate of glucose and lactate (B), and glutamine and glutamate (C) are shown for control (NTC) and AGC1KD C2C12 cells cultured in pyruvate-free DMEM for 48 hr (n = 3). (D–G) Fractional labeling of aspartate (Asp) (D), citrate (E), glutamate (Glu) (F), and α-ketoglutarate (α-KG) (G) following culture of C2C12 control (black) or C2C12 AGC1-KD1 (red) cells (as in A–C) in media containing [U13C]glutamine (Gln) for 24 hr (n = 3). (H) Schematic overview of oxidative and reductive glutamine catabolism highlighting how labeled carbons from glutamine (Gln) label glutamate (Glu), α-keto-glutarate (α-KG), and the other indicated metabolites. (I) Relative 14CO2 release from control (NTC) and AGC1-KD C2C12 cells cultured in media containing [U14C]-glutamine for 1 hr (n = 3). All figures show mean ± SD unless indicated otherwise. *p ≤ 0.05, **p ≤ 0.01, ***p ≤ 0.001. See also Figure S2.
Figure 4
Figure 4. Cytosolic Aspartate Delivery Improves Proliferation/Survival Following Glutamine Limitation
(A) Western blot analysis of AGC1 protein expression in whole-cell lysates (40 μg/lane) from AGC1 KD (AGC1KD) or control (NTC) C2C12 or LLC1 cultured in DMEM with 10% FBS and 4 mM glutamine (High Gln) or 0.1 mM glutamine (Low Gln) for 24 hr as indicated. (B) Schematic depicting how low glutamine might lead to reduced cytosolic aspartate delivery and increased aspartate transporter expression. (C) Proliferation/survival rate of control (NTC) and AGC1KD C2C12, LLC1, AL1376, A549, PANC1, HeLa, H1299, and CAPAN2 cells cultured in pyruvate-free DMEM containing 4 or 0.1 mM glutamine (Gln), or 4 mM glutamine with CB839 at the specified concentrations in the presence or absence of 20 mM aspartate (Asp), as indicated (n = 3). Mean ± SEM. *p ≤ 0.05, **p ≤ 0.01, ***p ≤ 0.001. See also Figure S3.
Figure 5
Figure 5. Sustaining Cytosolic Aspartate Levels Prevents Cell Death in Glutamine-Limiting Conditions
(A) Schematic showing how glutamine and alternative anaplerotic substrates can fuel the TCA cycle and support mitochondrial aspartate synthesis. How CB-839-mediated inhibition of glutaminase and metformin inhibition of NAD+ regeneration affect TCA cycling are also shown. (B) Proliferation/survival rate of control (NTC) and AGC1-KD C2C12 cells treated with varying concentration of metformin in pyruvate-free DMEM (n = 3). (C) Proliferation/survival rate of control (NTC) and AGC1-KD C2C12 cells cultured in 4 or 0.1 mM glutamine, or 4 mM glutamine with 1 μM CB-839, in the presence or absence of 20 mM aspartate (Asp), 2 mM sodium pyruvate (Pyr), 2 mM dimethyl-α-ketoglutarate (daKG), or 2 mM dimethylmalate (dMal), as indicated (n = 3). (D) Relative cellular aspartate and asparagine levels in control (NTC) and AGC1-KD C2C12 cells cultured in 0.1 or 4 mM glutamine with 1 μM CB-839 in the presence or absence of 20 mM aspartate (Asp), 2 mM sodium pyruvate (Pyr), or 2 mM dimethyl-α-ketoglutarate (daKG), as indicated (n = 3). (E) Schematic depicting a model for how changes in cytosolic aspartate levels might correlate with cell survival. All figures denote means ± SEM unless indicated otherwise. *p ≤ 0.05, **p ≤ 0.01, ***p ≤ 0.001. See also Figure S4.
Figure 6
Figure 6. Cytosolic Aspartate Is Limiting for Nucleotide Biosynthesis When Glutamine Metabolism Is Compromised
(A) Schematic showing the potential fates of cytosolic aspartate. Aspartate is a proteinogenic amino acid (red) that could undergo transaminations (green) to support NEAA biosynthesis, oxidize cytosolic NADH through MAS, and provide carbon for the mitochondrial TCA cycle. Aspartate can also be a precursor to produce asparagine (blue), be acetylated to produce N-acetylaspartate (gray), or support purine and pyrimidine biosynthesis (orange). Aspartate fates that are affected by transaminase inhibition by AOA are indicated. (B) Relative intracellular levels of NEAAs and TCA cycle intermediates in control (N) and AGC1-KD (A) C2C12 cells cultured in 0.1 mM glutamine (0.1 mM Q) or 4 mM glutamine with CB-839 for 24 hr in the presence and absence of 20 mM aspartate; relative change compared to control with CB-839 or NTC with 0.1 mM Q is shown (n = 3). Cit, citrate; a-KG, alpha-ketoglutarate; Suc, succinate; Fum, fumarate; Mal, malate; Asp, aspartate; Asn, asparagine; Gln, glutamine; Glu, glutamate; Pro, proline; Ser, serine; Gly, glycine; Ala, alanine. (C) Proliferation/survival rates of control (NTC) and AGC1-KD C2C12 cells cultured in pyruvate-free DMEM and treated with 1 μM CB-839 in the presence or absence of 20 mM aspartate (Asp); 1 mM mixture of NEAAs containing serine, glycine, alanine, aspartate, asparagine, proline, and glutamate (NEAAs); and/or 0.3 mM AOA as indicated (n = 3). (D) Proliferation/survival rates of control (NTC) and AGC1-KD C2C12 cells cultured in pyruvate-free DMEM and 0.1 mM mixture of NEAAs, and treated with 1 μM CB-839 in the presence or absence of 20 mM aspartate (Asp) and/or 0.3 mM AOA as indicated (n = 3). (E) Proliferation/survival rates of control (NTC) and AGC1-KD C2C12 cells cultured in 4 mM glutamine and treated with DMSO or with 1 μM CB-839 in the presence of 10 mM aspartate (Asp); 1 mM of a mixture of NEAAs containing asparagine (Asn), serine (Ser), glycine (Gly), proline (Pro), alanine, aspartate (Asp), and glutamate (Glu) (NEAAs); or 1 mM of the individual specified free amino acid, as indicated (n = 3). (F) Proliferation/survival rates of control (NTC) and AGC1-KD C2C12 cells cultured in 4 mM glutamine with 1 μM CB-839 and 0.1 mM mixture of NEAAs in the presence or absence of 20 mM aspartate (Asp), 2 mM dimethyl-α-ketoglutarate (daKG), and/or 0.3 mM AOA, as indicated (n = 3). (G) Proliferation/survival rates of control (NTC) and AGC1-KD C2C12 cells treated with 1 μM CB-839 in the presence or absence of 20 mM aspartate (Asp), 2 mM dimethyl-α-ketoglutarate (daKG), and/or 2 mM sodium pyruvate (Pyr), without (siCtrl) or with (siGot1/2) siRNA KD of Got1 and Got2, as indicated (n = 3). (H) Top: schematic showing the need for aspartate to make AMP from IMP. Bottom: relative AMP to IMP ratio in control (NTC) and AGC1-KD C2C12 cells cultured with 4 mM glutamine for 24 hr in the absence (Vehicle) or presence of 1 μM CB-839, without or with 20 mM aspartate (Asp), as indicated (n = 3). (I) Top: schematic showing the role of aspartate in UMP synthesis. Bottom: relative intracellular UMP levels in control (NTC) and AGC1-KD C2C12 cells cultured in 4 mM glutamine for 24 hr in the absence (Vehicle) or presence of 1 μM CB-839, without or with 20 mM aspartate (Asp), as indicated (n = 3). (J) Proliferation/survival rates of control (NTC) and AGC1-KD C2C12 cells cultured in 0.1 or 4 mM glutamine with 1 μM CB-839 in the presence or absence of a mix of nucleotide precursors containing 200 μM hypoxanthine, 200 μM adenine, 200 μM guanine, 100 μM thymine, and 400 μM uridine, as indicated (n = 3). All figures denote mean ± SD unless indicated otherwise. *p ≤ 0.05, **p ≤ 0.01, ***p ≤ 0.001. See also Figure S5.
Figure 7
Figure 7. AGC1 Deficiency Sensitizes Tumors to CB-839 Treatment
(A) Growth of tumors generated from control (NTC) or AGC1-KD LLC1 in C56BL/6 mice flanks that were treated without (Vehicle) or with CB-839 dosed at 200 mg/kg twice daily starting on day 13 as indicated (n ≥ 6). (B) Relative glutamate (Glu) to glutamine (Gln) ratio measured in metabolite extracts from the tumors shown in (A) at the experimental endpoint (day 22) (n ≥ 5). (C) Relative pyruvate to lactate ratio measured in metabolite extracts from the tumors shown in (A) at the experimental endpoint (day 22) (n ≥ 5). (D) Relative levels of the specified TCA intermediates and asparagine (normalized to valine) measured in metabolite extracts from the tumors shown in (A) at the experimental endpoint (n ≥ 5). Cit, citrate; Fum, fumarate; Mal, malate; Asp, aspartate; Asn, asparagine. All figures denote mean ± SEM. *p ≤ 0.05, **p ≤ 0.01, ***p ≤ 0.001. See also Figures S6 and S7.

References

    1. Ahn CS, Metallo CM. Mitochondria as biosynthetic factories for cancer proliferation. Cancer Metab. 2015;3:1. - PMC - PubMed
    1. Amoedo ND, Punzi G, Obre E, Lacombe D, De Grassi A, Pierri CL, Rossignol R. AGC1/2, the mitochondrial aspartate-glutamate carriers. Biochim Biophys Acta. 2016;1863:2394–2412. - PubMed
    1. Bardeesy N, Aguirre AJ, Chu GC, Cheng KH, Lopez LV, Hezel AF, Feng B, Brennan C, Weissleder R, Mahmood U, et al. Both p16(Ink4a) and the p19(Arf)-p53 pathway constrain progression of pancreatic adenocarcinoma in the mouse. Proc Natl Acad Sci USA. 2006;103:5947–5952. - PMC - PubMed
    1. Begum L, Jalil MA, Kobayashi K, Iijima M, Li MX, Yasuda T, Horiuchi M, del Arco A, Satrústegui J, Saheki T. Expression of three mitochondrial solute carriers, citrin, aralar1 and ornithine transporter, in relation to urea cycle in mice. Biochim Biophys Acta. 2002;1574:283–292. - PubMed
    1. Biancur DE, Paulo JA, Małachowska B, Quiles Del Rey M, Sousa CM, Wang X, Sohn ASW, Chu GC, Gygi SP, Harper JW, et al. Compensatory metabolic networks in pancreatic cancers upon perturbation of glutamine metabolism. Nat Commun. 2017;8 15965. - PMC - PubMed

Publication types

LinkOut - more resources