

Growth, morphometrics, and nutrient content of farmed eastern oysters, Crassostrea virginica (Gmelin), in New Hampshire, USA
- PMID: 30123043
- PMCID: PMC6093306
- DOI: 10.1111/are.12988
Growth, morphometrics, and nutrient content of farmed eastern oysters, Crassostrea virginica (Gmelin), in New Hampshire, USA
Abstract
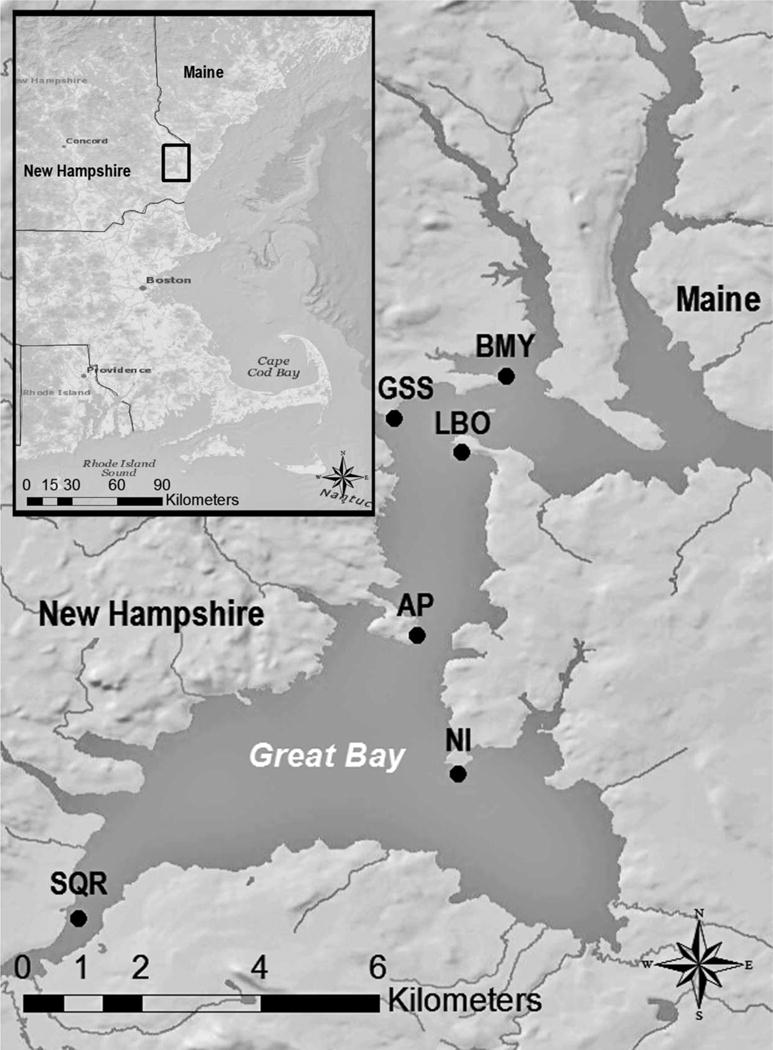
When harvested, oysters represent a removal from the ecosystem of nutrients such as nitrogen (N) and carbon (C). A number of factors potentially affect nutrient content, but a quantitative understanding across the geographic range of the eastern oysters is lacking. The present study was designed to quantify the relationships among various metrics of farmed eastern oysters near its northern geographic range focusing on nutrient content. Hatchery-reared oysters were deployed in polyethylene bags at six sites, and were measured on multiple occasions from 2010-2012. A quadratic polynomial fit to the combined datasets for shell height indicated that on average a 'cocktail' size oyster (63 mm shell height) would be reached after 2 yr, and 'regular' size (76 mm) would require 3 yr. There were significant differences in growth rates and oyster nutrient content among the sites; means for %N in soft tissue ranged from 6.9 to 8.6, and 0.07 to 0.18 in shell. Percent N in soft tissue and shell were highest at two sites at the mouths of rivers with elevated dissolved inorganic N concentrations in the water. Grand means (all sites, seasons and years combined) of soft tissue N and C for regular size oysters were 7.3% and 38.5%, respectively; and for shell N and C were 0.13% and 12.0%, respectively. Our study extends the range of data on nutrient content of the eastern oyster to northern New England, and indicates that oyster size, seasonality, and nutrient concentration in ambient water potentially affect %N and %C content of oysters.
Keywords: bioextraction; eutrophication; nutrient assimilation; shellfish aquaculture; water quality.
Figures


References
-
- Boesch D. Challenges and opportunities for science in reducing nutrient over-enrichment of coastal ecosystems. Estuaries. 2002;25:744–758.
-
- Bricker SB, Wicks C, Woerner J. Effects of nutrient enrichment in the nation’s estuaries: a decade of change. Harmful Algae. 2008;8:21–32.
-
- Bricker SB, Rice KC, Bricker OP., III From headwaters to coast: influence of human activities on water quality of the Potomac River estuary. Aquatic Geochemistry. 2014 doi: 10.10007/s10498-014-9226-y. - DOI
-
- Bricker SB, Ferreira JG, Zhu C, Rose JM, Galimany E, Wikfors G, Saurel C, Miller RL, Wands J, Trowbridge P, Grizzle R, Wellman K, Rheault R, Steinberg J, Jacob A, Davenport E, Ayvazian S, Tedesco M. An Ecosystem Services Assessment using bioextraction technologies for removal of nitrogen and other substances in Long Island Sound and the Great Bay/Piscataqua Region Estuaries. National Oceanic and Atmospheric Administration, National Centers for Coastal Ocean Science; Silver Spring, MD: United States Environmental Protection Agency, Office of Research and Development, Atlantic Ecology Division; Narragansett, RI: 2015. (NCCOS Coastal Ocean Program Decision Analysis Series No. 194). 220 pp + 3 appendices.
-
- Brown BL, Butt AJ, Shelton SW, Paynter KT. Growth and mortality of North Carolina-heritage oysters, Crassostrea virginica, in North Carolina and Chesapeake Bay. Journal of Applied Aquaculture. 1998;8:25–39.
Grants and funding
LinkOut - more resources
Full Text Sources
Other Literature Sources