. 2018 Aug 20;13(1):44.
doi: 10.1186/s13024-018-0277-1.

PU.1 regulates Alzheimer's disease-associated genes in primary human microglia

Affiliations

PU.1 regulates Alzheimer's disease-associated genes in primary human microglia

Justin Rustenhoven et al. Mol Neurodegener. .

Abstract

Background: Microglia play critical roles in the brain during homeostasis and pathological conditions. Understanding the molecular events underpinning microglial functions and activation states will further enable us to target these cells for the treatment of neurological disorders. The transcription factor PU.1 is critical in the development of myeloid cells and a major regulator of microglial gene expression. In the brain, PU.1 is specifically expressed in microglia and recent evidence from genome-wide association studies suggests that reductions in PU.1 contribute to a delayed onset of Alzheimer's disease (AD), possibly through limiting neuroinflammatory responses.

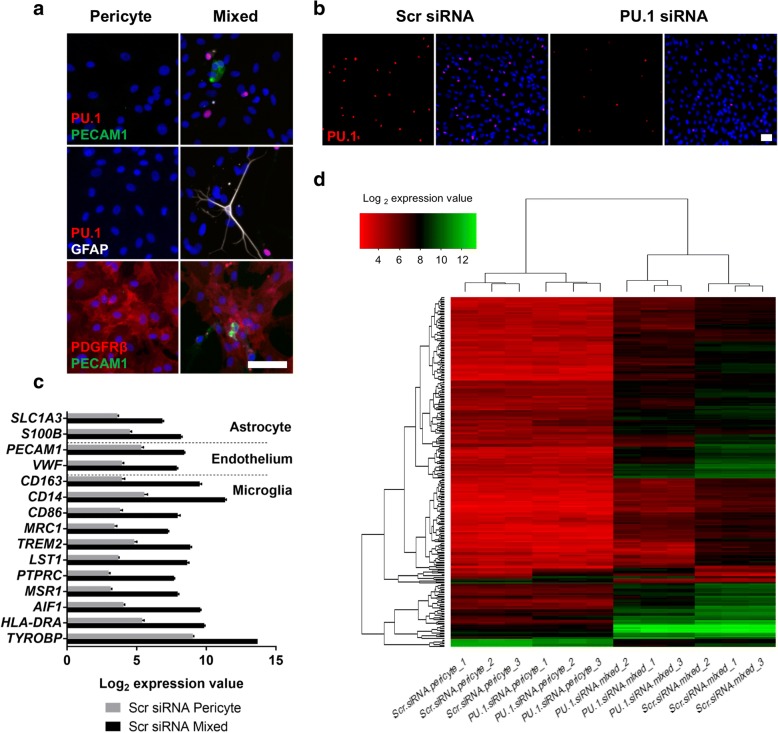
Methods: To investigate how PU.1 contributes to immune activation in human microglia, microarray analysis was performed on primary human mixed glial cultures subjected to siRNA-mediated knockdown of PU.1. Microarray hits were confirmed by qRT-PCR and immunocytochemistry in both mixed glial cultures and isolated microglia following PU.1 knockdown. To identify attenuators of PU.1 expression in microglia, high throughput drug screening was undertaken using a compound library containing FDA-approved drugs. NanoString and immunohistochemistry was utilised to investigate the expression of PU.1 itself and PU.1-regulated mediators in primary human brain tissue derived from neurologically normal and clinically and pathologically confirmed cases of AD.

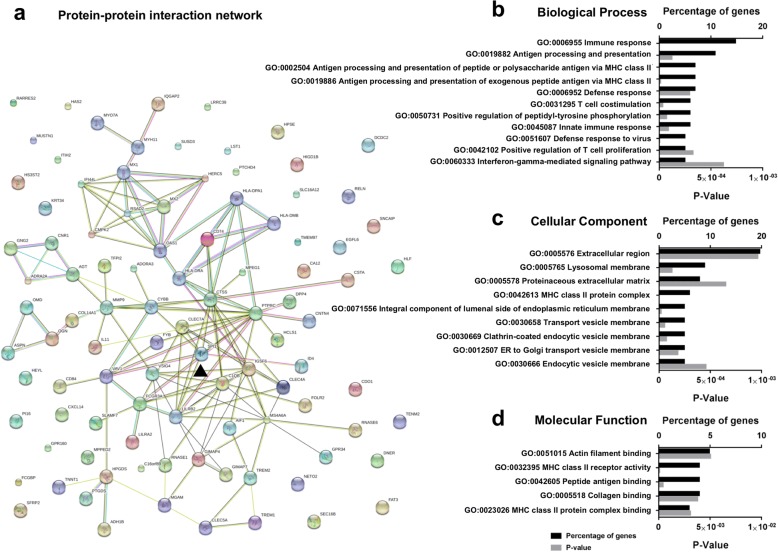
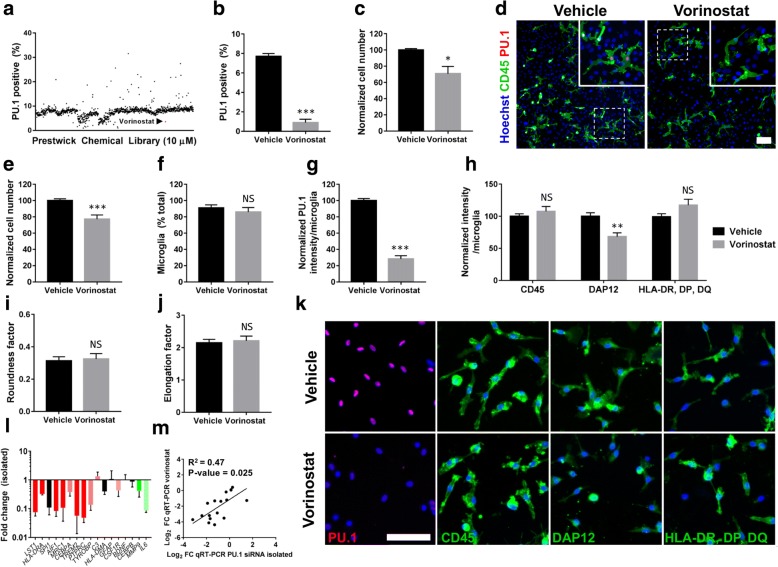
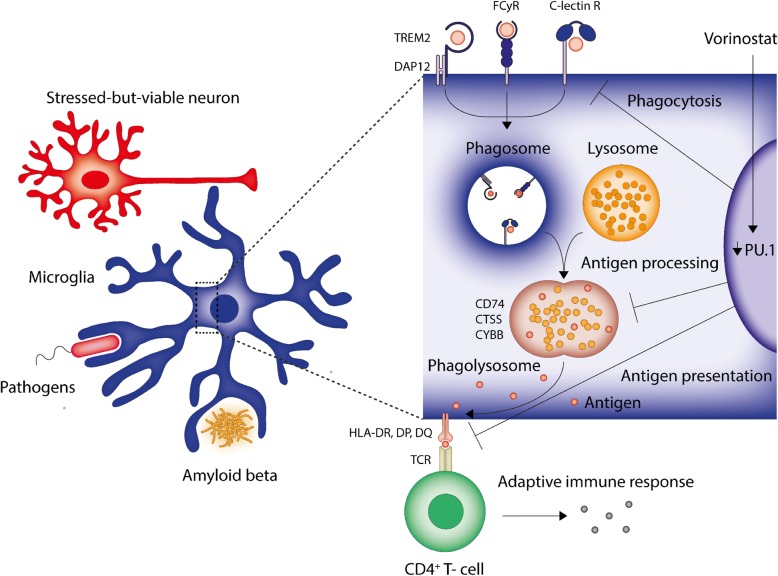
Results: Bioinformatic analysis of gene expression upon PU.1 silencing in mixed glial cultures revealed a network of modified AD-associated microglial genes involved in the innate and adaptive immune systems, particularly those involved in antigen presentation and phagocytosis. These gene changes were confirmed using isolated microglial cultures. Utilising high throughput screening of FDA-approved compounds in mixed glial cultures we identified the histone deacetylase inhibitor vorinostat as an effective attenuator of PU.1 expression in human microglia. Further characterisation of vorinostat in isolated microglial cultures revealed gene and protein changes partially recapitulating those seen following siRNA-mediated PU.1 knockdown. Lastly, we demonstrate that several of these PU.1-regulated genes are expressed by microglia in the human AD brain in situ.

Conclusions: Collectively, these results suggest that attenuating PU.1 may be a valid therapeutic approach to limit microglial-mediated inflammatory responses in AD and demonstrate utility of vorinostat for this purpose.

Keywords: Alzheimer’s disease; Antigen presentation; Drug screening; Neuroinflammation; Phagocytosis; Vorinostat.


Conflict of interest statement

Ethics approval and consent to participate

All brain tissue collection and processing protocols were approved by the Northern Regional Ethics Committee (New Zealand) for biopsy tissue, and the University of Auckland Human Participants Ethics Committee (New Zealand) for the post-mortem brain tissue. All methods were carried out in accordance with the approved guidelines.

Consent for publication

Not applicable.

Competing interests

The authors declare that they have no competing interests.

Publisher’s Note

Springer Nature remains neutral with regard to jurisdictional claims in published maps and institutional affiliations.

Figures

Fig. 1
Fig. 1
Characterisation of culture conditions for microarray analysis. a Characterisation of primary human mixed glial cultures comprised of pericytes (PDGFRβ), microglia (PU.1), astrocytes (GFAP), and endothelial cells (PECAM1), compared with pericyte-only cultures containing PDGFRβ only, scale bar = 100 μm. b PU.1 knockdown in mixed glial cultures transfected with 50 nM scrambled or PU.1 siRNA for 7 days, scale bar = 100 μm. c Microarray analysis of cell specific genes in scrambled siRNA transfected mixed glial cultures or pericyte-only cultures. d Unbiased hierarchical clustering of the top 250 differentially expressed genes from microarray analysis of mixed glial cultures or pericyte cultures transfected with 50 nM scrambled or PU.1 siRNA for 7 days, n = 3 independent microglial cultures
Fig. 2
Fig. 2
Microarray analysis of PU.1 silencing. a Heatmap generation of the top 180 differentially expressed genes (log2 fold change > 1.5, adjusted p-value < 0.001) with PU.1 siRNA versus control siRNA in mixed glial cultures. Corresponding changes in pericyte-only cultures are shown. b, c Venn diagrams revealing 51 upregulated genes by PU.1 silencing, 26 of which were specific to mixed glial cultures and 129 downregulated genes, 122 of which were specific to mixed glial cultures. d, e Volcano plots displaying log2 fold change versus –log adjusted p-value for all genes (grey) and genes of interest displaying significant reduction (dark red), mild reductions (light red), no change (black), mild induction (light green), or significant induction (dark green) in mixed glial cultures or pericyte only cultures. f Validation of selected genes by qRT-PCR (n = 3 independent microglial cultures) in mixed glial cultures transfected with 50 nM PU.1 siRNA versus control siRNA for 7 days, colour coded by their significance from microarray analysis. Data is displayed as fold change of mRNA genes in PU.1 siRNA treated cultures relative to control siRNA samples as determined by the 2^-ΔΔCt method (g) Log2 fold changes between microarray and qRT-PCR analysis demonstrated good correlation (R2 = 0.75)
Fig. 3
Fig. 3
Bioinformatic analysis reveals PU.1 as a highly connected hub protein involved in innate and adaptive immunity. a STRING protein-protein interaction network of the top 102 differentially expressed genes specific to mixed glial cultures with PU.1 knockdown implicates PU.1 as a central regulator of altered genes. b Gene ontology analysis demonstrating that PU.1-regulated genes are involved in innate and adaptive immune biological processes. c The majority of PU.1 regulated genes are localized to the extracellular region, MHCII complexes, or aspects of various endocytic pathways. d Molecular functions involved in antigen presentation and actin filament binding were altered by PU.1 silencing
Fig. 4
Fig. 4
Confirmation of microarray analysis in isolated human brain microglia. a Isolated microglia cultures transfected for 7 days with 50 nM PU.1 siRNA show no change in overall cell number (p > 0.05), (b) no change in the percentage of microglial cells (p > 0.05), (c) efficient knockdown of PU.1 (p < 0.001), (d, g) reduced expression of DAP12 (p < 0.001) and HLA-DR, DP, DQ (p < 0.01) but not CD45 (p > 0.05), (e) non-significant induction in roundness factor (p > 0.0.5), and (f) reduced elongation factor (p < 0.001) compared to a scrambled siRNA control, n = 3–5 independent microglial cultures, scale bar = 100 μm. h qRT-PCR validation of selected genes in isolated microglia cultures transfected with 50 nM PU.1 siRNA versus control siRNA for 7 days, colour coded by their significance from microarray analysis, (i) displayed a significant correlation to changes observed in mixed glial cultures (R2 = 0.55), n = 3 independent microglial cultures. Data is displayed as fold change of mRNA genes in PU.1 siRNA treated cultures relative to control siRNA samples as determined by the 2^-ΔΔCt method. Cytokine secretions from isolated microglia cultures transfected with 50 nM PU.1 siRNA versus control siRNA for 6 days followed by stimulation with vehicle or 10 ng/mL LPS for a further 24 h demonstrated no effect of PU.1 silencing on LPS-induced (j) IL-1β (p > 0.05), (k) TNFα (p > 0.05), (l) IL-6 (p > 0.05), (m) MCP-1 (p > 0.05) but a reduction in (n) IL-8 (p < 0.001). Please note that this is one representative result of three independent experiments. NS = p > 0.05, * = p < 0.05, ** = p < 0.01, *** = p < 0.001, Students t test
Fig. 5
Fig. 5
PU.1-regulated proteins demonstrate microglial expression in the human AD brain. NanoString gene expression analysis of selected microglial genes reveals induction of (a) SPI1 (p < 0.001), (b) TYROBP (p < 0.001), (c) HLA-DRA (p < 0.001), (d) TREM2 (p < 0.05), (e) PTPRC (p < 0.001), and (f) AIF1 (p < 0.01) in human brain MFG tissue derived from neurologically normal (n = 8) or clinically and pathologically confirmed AD tissue (n = 8). Representative images demonstrating microglial localisation of (g) DAP12, (h) HLA-DR, DP, DQ, (i) TREM2, and (j) CD45 with IBA1 in the control and AD brain. Scale bar = 200 μm, inset = 20 μm. * = p < 0.05, ** = p < 0.01, *** = p < 0.001, Students t test
Fig. 6
Fig. 6
High throughput drug screening identified vorinostat as an effective inhibitor of PU.1 that partially mimics the effects of PU.1 silencing. a High throughput drug screening using a drug library containing 1280 FDA-approved compounds at 10 μM for 48 h in mixed glial cultures. ICC and automated image analysis identified the HDAC inhibitor vorinostat as a candidate drug for PU.1 reduction. Please note that this screening experiment was performed using one biological sample. b Confirmation of the PU.1 inhibitory effect (p < 0.001) of 10 μM vorinostat for 48 h in additional mixed glial cultures analysed by ICC and automated image analysis and (c) a mild reduction (p < 0.05) in total cell number (c), n = 2. d ICC analysis demonstrating loss of nuclear PU.1 expression with vorinostat treatment in CD45+ microglia, scale bar = 100 μm. Isolated microglia cultures treated for 24 h with 10 μM vorinostat show (e) a reduction in cell number (p < 0.001), (f) no change in the percentage of microglial cells (p > 0.05), (g, k) efficient knockdown of PU.1 (p < 0.001), (h, k) reduced expression of DAP12 (p < 0.01) but not HLA-DR, DP, DQ (p > 0.05) or CD45 (p > 0.05), and no change in (i) roundness factor or (j) elongation factor compared to vehicle treatment, n = 3–5, scale bar = 100 μm. (l, m) Determination of gene changes following a 24 h treatment with 10 μM vorinostat demonstrated a modest correlation (R2 = 0.47) with genes altered by PU.1 silencing in isolated microglia cultures, n = 3 independent microglial cultures. Data is displayed as fold change of mRNA genes in vorinostat treated cultures relative to vehicle treated samples as determined by the 2^-ΔΔCt method. NS = p > 0.05, * = p < 0.05, ** = p < 0.01, *** = p < 0.001, Students t test
Fig. 7
Fig. 7
Schematic identifying the contribution of PU.1 to microglial processes. Microglia contain several cell surface receptors implicated in the recognition of various antigenic matter including stressed-but-viable neurons, bacterial and viral pathogens, and misfolded proteins including Aβ1–42. PU.1 silencing in microglia attenuated the expression of receptors involved in phagocytic recognition (TREM2, DAP12, FCGR3A, MRC1, and CLEC7A), antigen processing (CD74, CTSS, and CYBB), and antigen presentation (HLA-DMB, HLA-DPA1, HLA-DQA1, HLA-DQB1, and HLA-DRA) and can be pharmacologically reduced by vorinostat. FCγR = Fc gamma receptor, TCR = T-cell receptor

References

    1. Paolicelli RC, et al. Synaptic pruning by microglia is necessary for normal brain development. Science. 2011;333(6048):1456–1458. doi: 10.1126/science.1202529. - DOI - PubMed
    1. Fu R, et al. Phagocytosis of microglia in the central nervous system diseases. Mol Neurobiol. 2014;49(3):1422–1434. doi: 10.1007/s12035-013-8620-6. - DOI - PMC - PubMed
    1. Perry VH, Nicoll JA, Holmes C. Microglia in neurodegenerative disease. Nat Rev Neurol. 2010;6(4):193–201. doi: 10.1038/nrneurol.2010.17. - DOI - PubMed
    1. Brown GC, Vilalta A. How microglia kill neurons. Brain Res. 2015;1628(Pt B):288–297. doi: 10.1016/j.brainres.2015.08.031. - DOI - PubMed
    1. Brown GC, Neher JJ. Microglial phagocytosis of live neurons. Nat Rev Neurosci. 2014;15(4):209–216. doi: 10.1038/nrn3710. - DOI - PubMed

Publication types

MeSH terms