. 2018 Dec 1;187(12):2511-2523.
doi: 10.1093/aje/kwy171.

Age-Specific Excess Mortality Patterns During the 1918-1920 Influenza Pandemic in Madrid, Spain

Affiliations

Age-Specific Excess Mortality Patterns During the 1918-1920 Influenza Pandemic in Madrid, Spain

Laura Cilek et al. Am J Epidemiol. .

Abstract

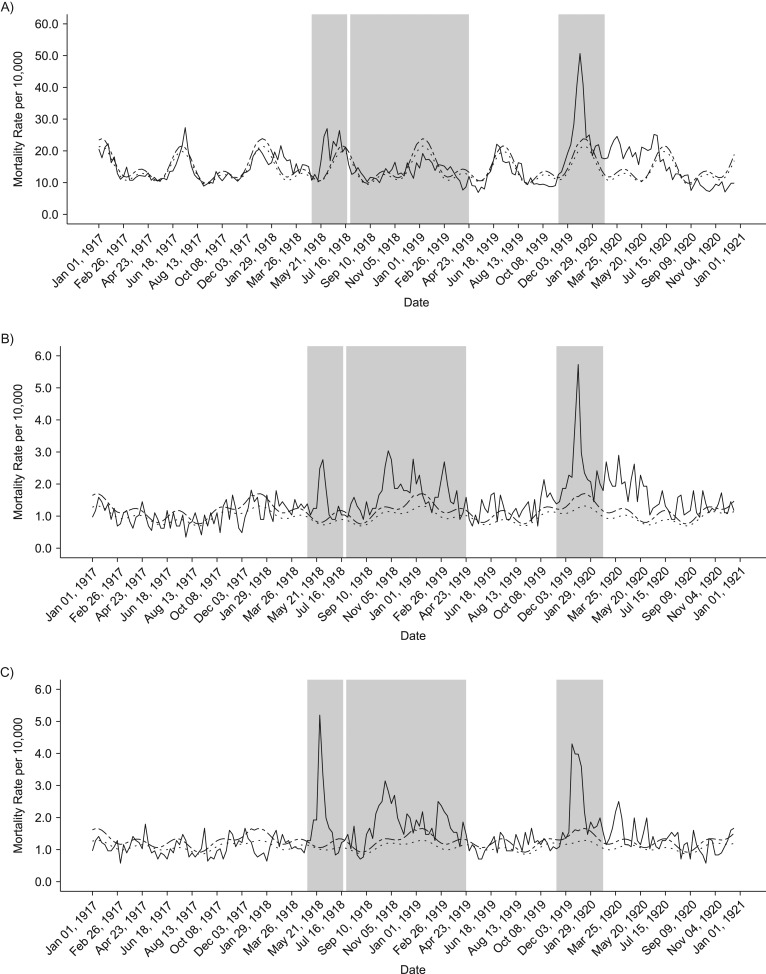
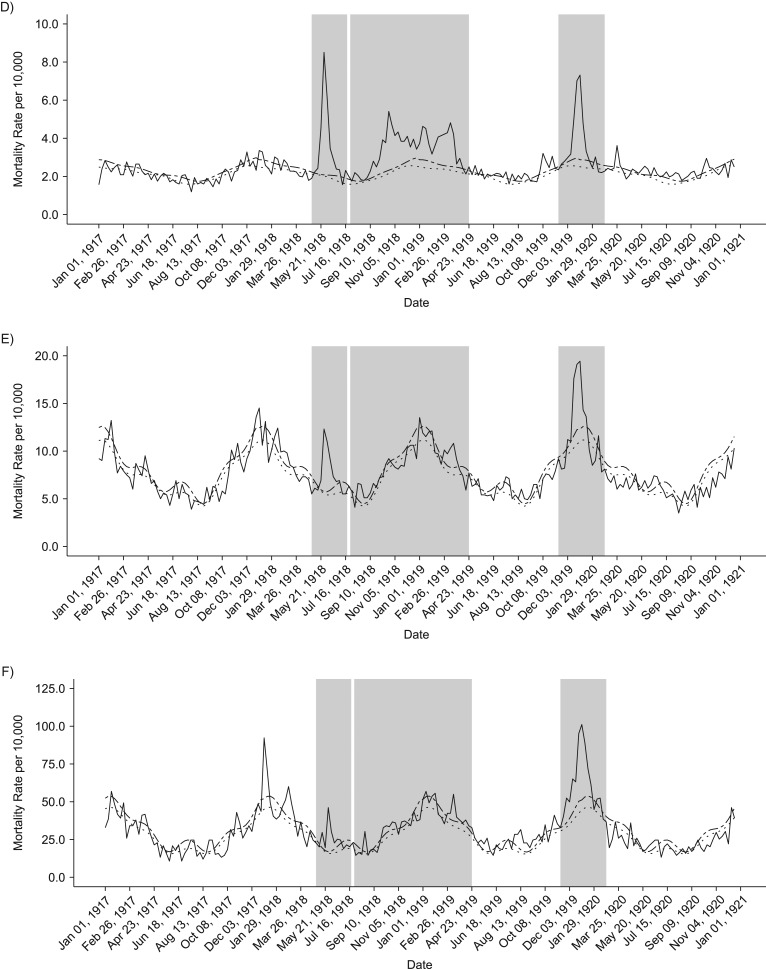
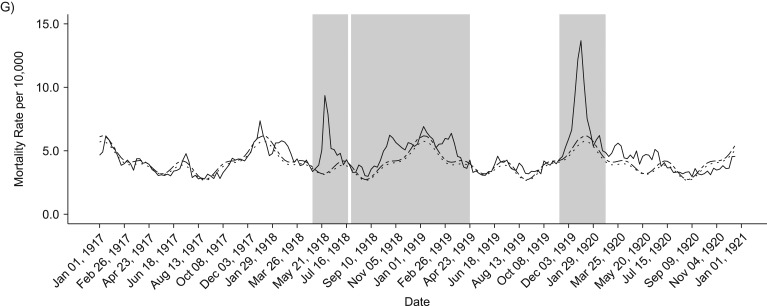
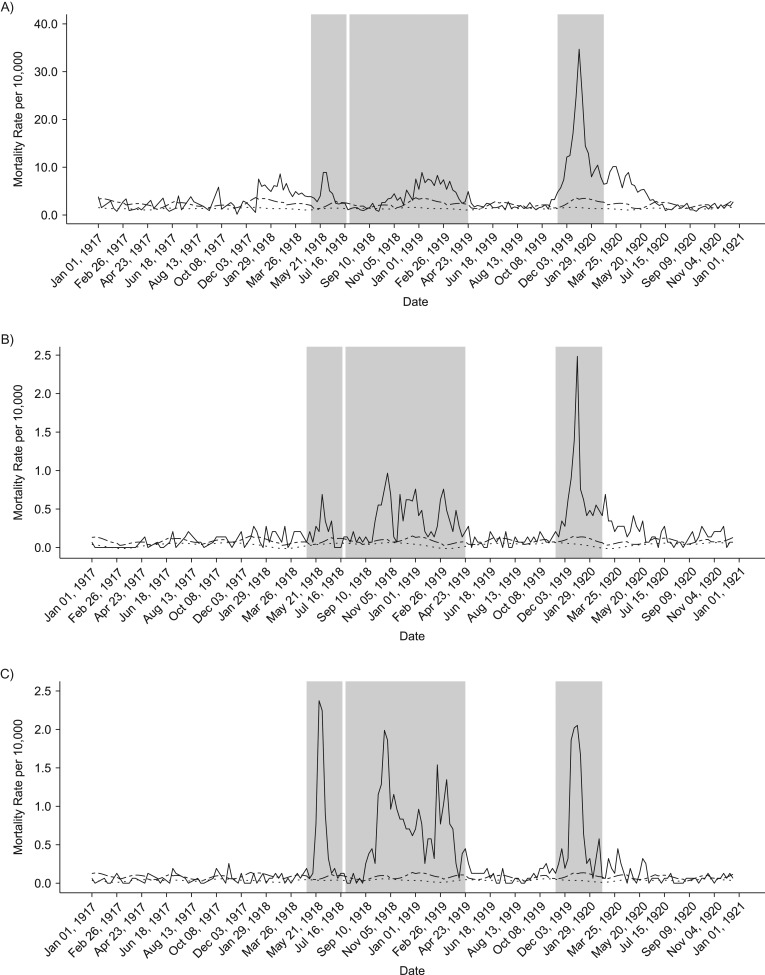
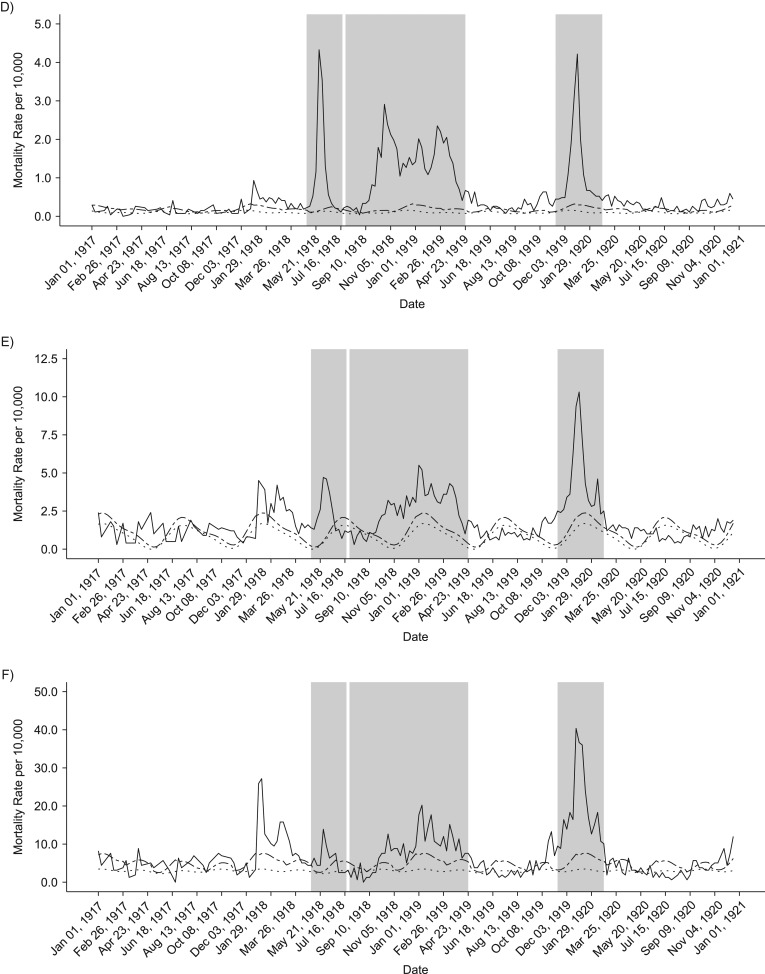
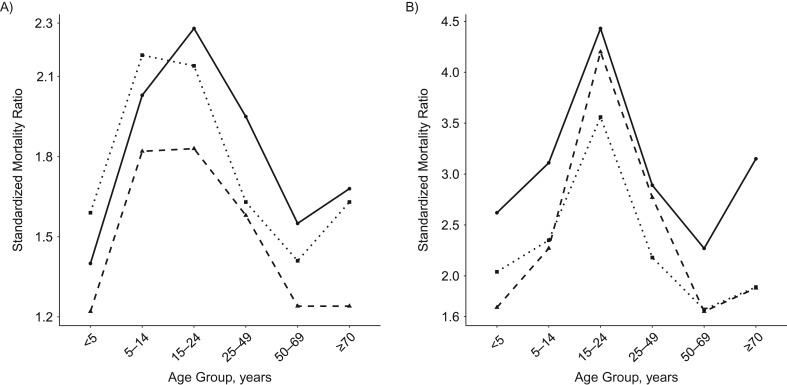
Although much progress has been made to uncover age-specific mortality patterns of the 1918 influenza pandemic in populations around the world, more studies in different populations are needed to make sense of the heterogeneous death impact of this pandemic. We assessed the absolute and relative magnitudes of 3 pandemic waves in the city of Madrid, Spain, between 1918 and 1920, on the basis of age-specific all-cause and respiratory excess death rates. Excess death rates were estimated using a Serfling model with a parametric bootstrapping approach to calibrate baseline death levels with quantified uncertainty. Excess all-cause and pneumonia and influenza mortality rates were estimated for different pandemic waves and age groups. The youngest and oldest persons experienced the highest excess mortality rates, and young adults faced the highest standardized mortality risk. Waves differed in strength; the peak standardized mortality risk occurred during the herald wave in spring 1918, but the highest excess rates occurred during the fall and winter of 1918/1919. Little evidence was found to support a "W"-shaped, age-specific excess mortality curve. Acquired immunity may have tempered a protracted fall wave, but recrudescent waves following the initial 2 outbreaks heightened the total pandemic mortality impact.


Figures

Figure 1.
Figure 1.
Sample of death records from May 27, 1918, from the Civil Register of Madrid (49).
Figure 2.
Figure 2.
Weekly time series of all-cause death rates, 1917–1920. Solid lines show the real weekly mortality rates from 1917 to 1922, and dotted and dashed lines show the mean and upper 95% bound baseline rates from simulated 1917 death data. Shaded gray blocks indicate the 3 epidemic wave periods. A–F) The figure panels correspond to the following age groups: <5, 5–14, 15–24, 25–49, 50–69, and ≥70 years. G) Graph shows data for all ages combined.
Figure 2.
Figure 2.
Weekly time series of all-cause death rates, 1917–1920. Solid lines show the real weekly mortality rates from 1917 to 1922, and dotted and dashed lines show the mean and upper 95% bound baseline rates from simulated 1917 death data. Shaded gray blocks indicate the 3 epidemic wave periods. A–F) The figure panels correspond to the following age groups: <5, 5–14, 15–24, 25–49, 50–69, and ≥70 years. G) Graph shows data for all ages combined.
Figure 3.
Figure 3.
Weekly time series of respiratory-related death rates, 1917–1920. Solid lines show the real weekly mortality rates from 1917 to 1922, and dotted and dashed lines show mean and upper 95% bound baseline rates from simulated 1917 death data. Shaded gray blocks indicate the 3 epidemic wave periods. A–F) Figure panels correspond to the following age groups: <5, 5–14, 15–24, 25–49, 50–69, and ≥70 years. G) Graph shows data for all ages combined.
Figure 3.
Figure 3.
Weekly time series of respiratory-related death rates, 1917–1920. Solid lines show the real weekly mortality rates from 1917 to 1922, and dotted and dashed lines show mean and upper 95% bound baseline rates from simulated 1917 death data. Shaded gray blocks indicate the 3 epidemic wave periods. A–F) Figure panels correspond to the following age groups: <5, 5–14, 15–24, 25–49, 50–69, and ≥70 years. G) Graph shows data for all ages combined.
Figure 4.
Figure 4.
Total excess mortality rates per 10,000 persons for all-cause (A) and respiratory-related (B) deaths according to age groups for each wave. The solid line represents the first spring wave, the fall and winter waves are represented by the dashed line, and the final winter wave is represented by the dotted line.
Figure 5.
Figure 5.
Standardized mortality ratio for all-cause (A) and respiratory-related (B) deaths according to age groups for each wave. The solid line represents the first spring wave, the fall and winter waves are represented by the dashed line, and the final winter wave is represented by the dotted line.

References

    1. Johnson NP, Mueller J. Updating the accounts: global mortality of the 1918–1920 “Spanish” influenza pandemic. Bull Hist Med. 2002;76(1):105–115. - PubMed
    1. Murray CJ, Lopez AD, Chin B, et al. . Estimation of potential global pandemic influenza mortality on the basis of vital registry data from the 1918–20 pandemic: a quantitative analysis. Lancet. 2006;368(9554):2211–2218. - PubMed
    1. Ansart S, Pelat C, Boelle PY, et al. . Mortality burden of the 1918–1919 influenza pandemic in Europe. Influenza Other Respir Viruses. 2009;3(3):99–106. - PMC - PubMed
    1. Simonsen L, Chowell G, Andreasen V, et al. . A review of the 1918 herald pandemic wave: importance for contemporary pandemic response strategies. Ann Epidemiol. 2018;28(5):281–288. - PubMed
    1. Smith GJ, Bahl J, Vijaykrishna D, et al. . Dating the emergence of pandemic influenza viruses. Proc Natl Acad Sci U S A. 2009;106(28):11709–11712. - PMC - PubMed

Publication types

MeSH terms