. 2018 Oct 1;24(10):495-509.
doi: 10.1093/molehr/gay034.

ADAM8 localizes to extravillous trophoblasts within the maternal-fetal interface and potentiates trophoblast cell line migration through a β1 integrin-mediated mechanism

Affiliations

ADAM8 localizes to extravillous trophoblasts within the maternal-fetal interface and potentiates trophoblast cell line migration through a β1 integrin-mediated mechanism

H T Le et al. Mol Hum Reprod. .

Abstract

Study question: Does A Disintegrin And Metalloproteinase 8 (ADAM8) control extravillous trophoblast (EVT) differentiation and migration in early human placental development?

Summary answer: ADAM8 mRNA preferentially localizes to invasive HLA-G-positive trophoblasts, associates with the acquirement of an EVT phenotype and promotes trophoblast migration through a mechanism requiring β1-integrin.

What is known already: Placental establishment in the first trimester of pregnancy requires the differentiation of progenitor trophoblasts into invasive EVTs that produce a diverse repertoire of proteases that facilitate matrix remodeling and activation of signaling pathways important in controlling cell migration. While multiple ADAM proteases, including ADAM8, are highly expressed by invasive trophoblasts, the role of ADAM8 in controlling EVT-related processes is unknown.

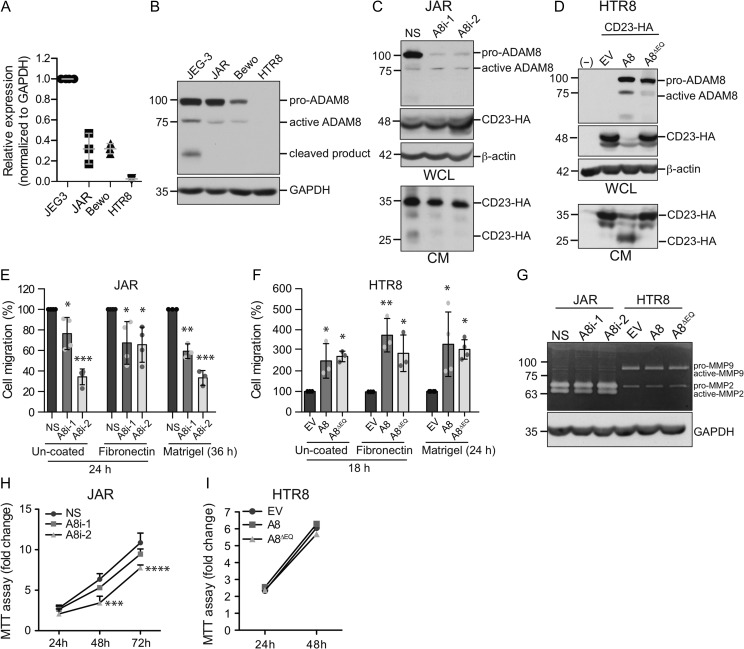
Study design, size, duration: First trimester placental villi and decidua (6-12 weeks' gestation), primary trophoblasts and trophoblastic cell lines (JEG3, JAR, Bewo, HTR8/SVNeo) were used to examine ADAM8 expression, localization and function. All experiments were performed on at least three independent occasions (n = 3).

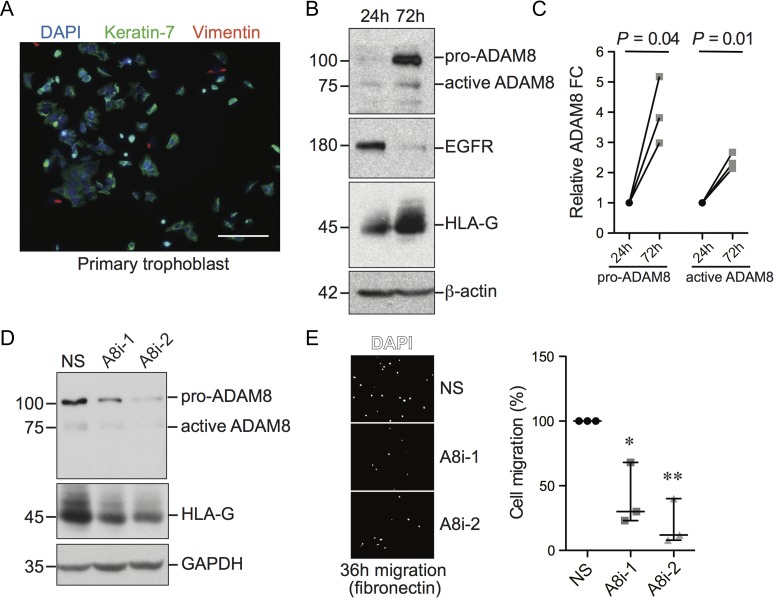
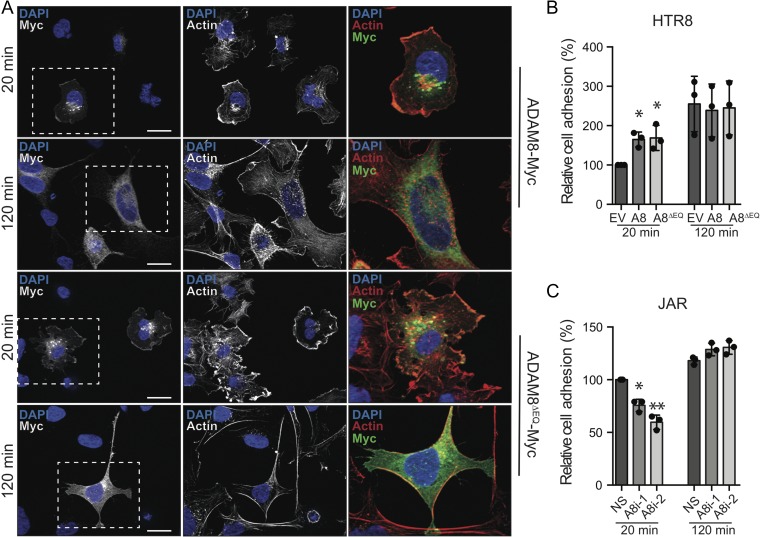
Participants/materials, setting, methods: Placental villi and primary trophoblasts derived from IRB approved first trimester placental (n = 24) and decidual (n = 4) were used to examine ADAM8 localization and expression by in situ RNAScope hybridization, flow cytometry, quantitative PCR and immunoblot analyses. Primary trophoblasts were differentiated into EVT-like cells by plating on fibronectin and were assessed by immunofluorescence microscopy and immunoblot analysis of keratin-7, vimentin, epidermal growth factor receptor (EGFR), HLA-G and ADAM8. ADAM8 function was examined in primary EVTs and trophoblastic cell lines utilizing siRNA-directed silencing and over-expression strategies. Trophoblast migration was assessed using Transwell chambers, cell-matrix binding was tested using fibronectin-adhesion assays, and ADAM8-β1-integrin interactions were determined by immunofluorescence microscopy, co-immunoprecipitation experiments and function-promoting/inhibiting antibodies.

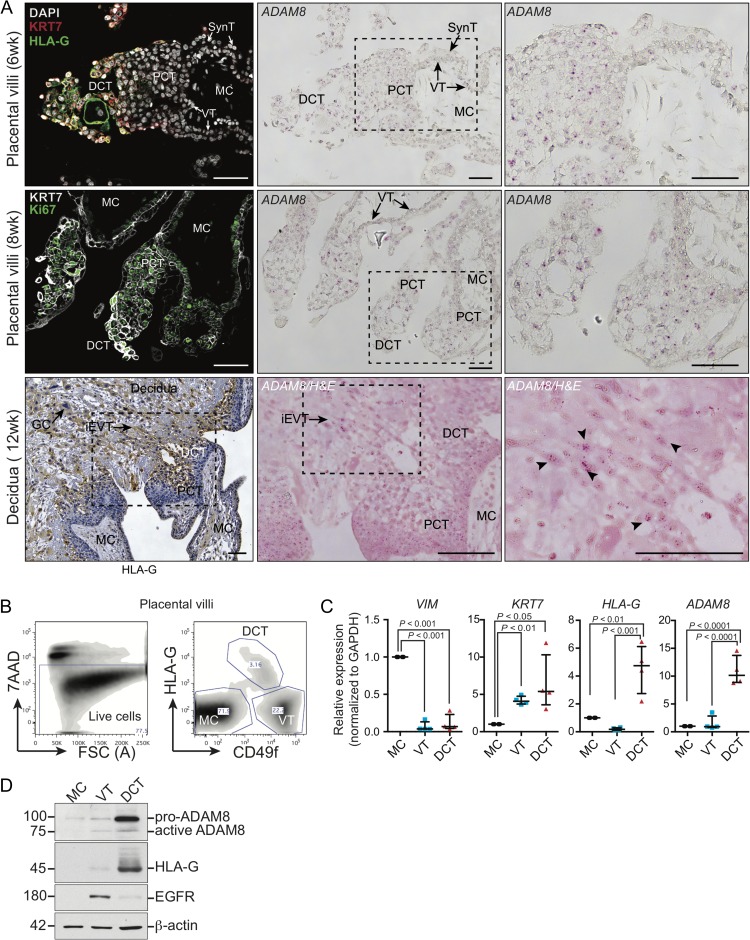
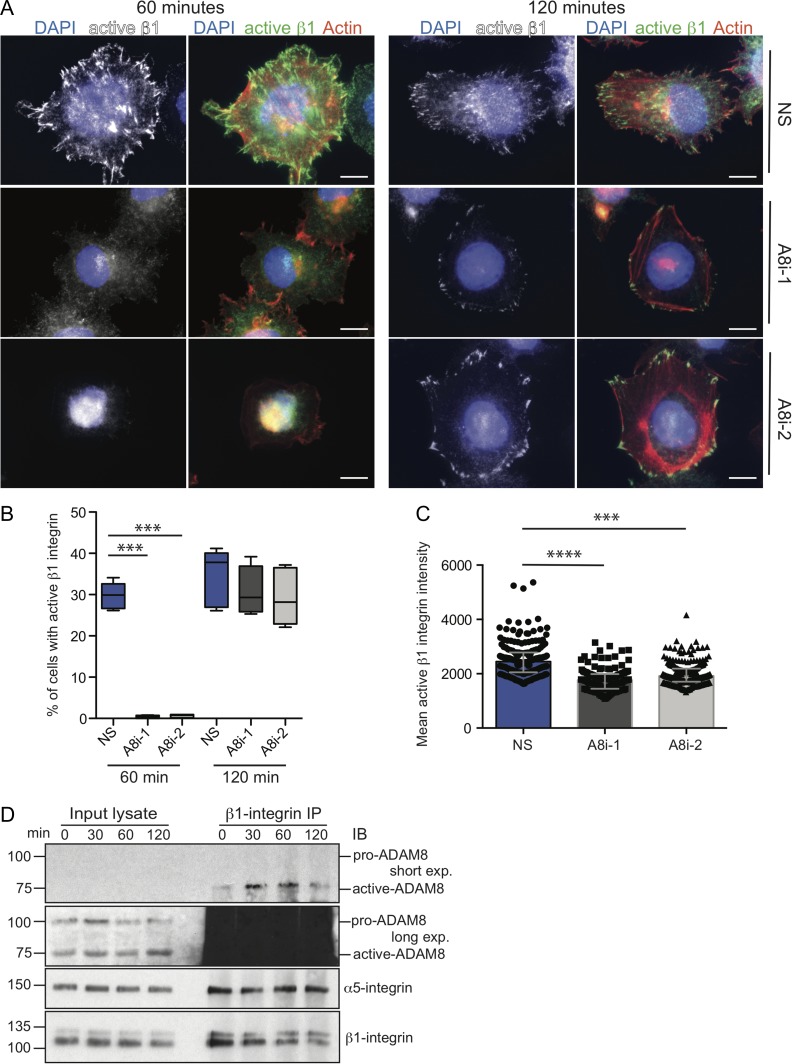
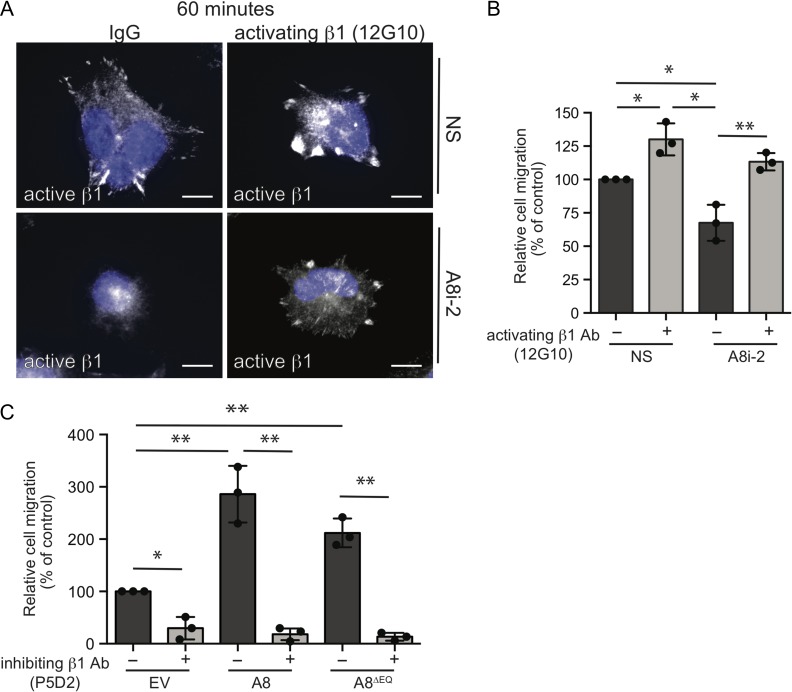
Main results and the role of chance: Within first trimester placental tissues, ADAM8 preferentially localized to HLA-G+ trophoblasts residing within anchoring columns and decidua. Functional experiments in primary trophoblasts and trophoblastic cell lines show that ADAM8 promotes trophoblast migration through a mechanism independent of intrinsic protease activity. We show that ADAM8 localizes to peri-nuclear and cell-membrane actin-rich structures during cell-matrix attachment and promotes trophoblast binding to fibronectin matrix. Moreover, ADAM8 potentiates β1-integrin activation and promotes cell migration through a mechanism dependent on β1-integrin function.

Limitations, reasons for caution: The primary limitation of this study was the use of in vitro experiments in examining ADAM8 function, as well as the implementation of immortalized trophoblastic cell lines. Histological localization of ADAM8 within placental and decidual tissue sections was limited to mRNA level analysis. Further, patient information corresponding to tissues obtained by elective terminations was not available.

Wider implications of the findings: The novel non-proteolytic pro-migratory role for ADAM8 in controlling trophoblast migration revealed by this study sheds insight into the importance of ADAM8 in EVT biology and placental development.

Study funding/competing interest(s): This work was supported by grants from the Natural Sciences and Engineering Research Council of Canada (NSERC-Discovery Grant) and the Canadian Institutes of Health Research (CIHR-Open Operating Grant). There are no conflicts or competing interests.

Trial registration number: NA.


Figures

Figure 1
Figure 1
ADAM8 preferentially localizes to anchoring columns of placental villi. (A) Representative immunofluorescence, immunohistochemistry and RNAScope microscopy images of serially sectioned first trimester placental villi (6–11 weeks gestation; n = 5) and decidua (10–12 weeks gestation; n = 4) showing ADAM8 mRNA transcript localization (pink punctate signal) within trophoblast subtypes. Proximal and distal column, as well as interstitial EVT subtypes of trophoblasts are identified by immunostaining of cytokeratin (KRT7) and HLA-G. ‘PCT’ indicates proximal column trophoblast; ‘DCT’ indicates distal column trophoblast; ‘VT’ indicates villous trophoblast; ‘SynT’ indicates syncytiotrophoblast; ‘MC’ indicates placenta mesenchymal core; ‘iEVT’ indicates interstitial extravillous trophoblast; ‘GC’ indicates trophoblast giant cell. The perforated white box indicates enlarged inset image. Black arrowheads denote ADAM8 signal. Bars = 100 μm. (B) Fluorescence activated cell-sorting (FACS) plots demonstrate the trophoblast isolation strategy used to purify mesencymal core cells (MC), distal column trophoblasts (DCT) and villous/proximal column trophoblasts (VT). Live cells, depleted of CD31+ (endothelial) and CD45+ (immune) cells using immuno-magnetic beads, were positively gated by 7AAD exclusion. Cells were further segregated by excluding CD45+ immune cells and by cell surface labeling of HLA-G and CD49f. Cell subtype proportions are indicated within each gated population (percent of cells within FACS plot). (C) ADAM8 mRNA levels in FACS-purified MCs, VTs and DCTs. Trophoblast subtype purity was assessed by qPCR analysis targeting the pan-trophoblast marker KRT7, the EVT-marker HLA-G and the mesenchymal lineage marker VIM. GAPDH was used for normalization. Results are presented as mean ± SD in bar graphs from four distinct placental villi specimens (n = 4); results were analyzed by one-way ANOVA and Dunn’s multiple comparisons test. (D) Immunoblot showing protein levels of pro- and active-ADAM8, HLA-G, and EGFR in MC, VT and DCT isolated from placental villi using immuno-magnetic beads. Molecular weights (kDa) are shown to the left and β-actin indicates loading control.
Figure 2
Figure 2
ADAM8 increases during extravillous trophoblast (EVT) differentiation and promotes cell migration. (A) Representative immunofluorescence microscopy image of primary trophoblasts 24 h post-seeding onto fibronectin-coated plate. Cells were immunostained with antibodies directed against keratin-7 (green), vimentin (red) and DAPI (blue). Bar = 100 μm. (B) Immunoblot showing protein levels of pro- and active-ADAM8, EGFR and HLA-G in whole cell lysates derived from primary trophoblasts cultured over 72 h on fibronectin-coated plates. Molecular weights (kDa) are shown to the left and β-actin indicates loading control. (C) Graph depicts pair-wise comparisons of pro- and active-ADAM8 protein fold-change in primary trophoblasts at 72 h of culture compared to levels at 24 h (n = 3). Shown is the P value (paired t test, two-tailed). (D) Representative immunoblot showing protein levels of pro- and active-ADAM8 and HLA-G in primary trophoblasts transfected with control non-silencing siRNA (NS) or siRNA targeting ADAM8 (A8i-1, A8i-2) following 72 h of culture (n = 3). Molecular weights (kDa) are shown to the left and GAPDH indicates loading control. (E) Representative Transwell migration images of primary trophoblasts transfected with control or ADAM8-silencing siRNA stained with DAPI (white) following 36 h of culture (n = 3 experiments). Graph to the right shows quantification of trophoblast migration as a proportion normalized to NS control. *P ≤ 0.05, **P ≤ 0.01; one-way ANOVA (Dunn’s multiple comparisons test).
Figure 3
Figure 3
ADAM8 promotes trophoblastic cell migration independent of its proteolytic activity. (A) qPCR analysis of ADAM8 in JEG3, JAR, Bewo and HTR8 trophoblastic cell lines (n = 3 for each). Gene expression was normalized to endogenous GAPDH. (B) Immunoblot showing protein levels of pro- and active-ADAM8 in JEG3, JAR, Bewo and HTR8 cell lines. Molecular weights (kDa) are shown to the left and GAPDH indicates loading control. Immunoblots showing protein levels of pro- and active-ADAM8 and CD23-HA in whole cell lysates (WCL) and conditioned media (CM) of (C) JAR cells transfected with control (NS) and ADAM8-silencing (A8i-1, A8i-2) siRNA and (D) HTR8 cells transfected with empty (EV), ADAM8 full-length (A8) and protease-dead ADAM8 (A8∆EQ) pCDNA3.1 expression constructs. Molecular weights (kDa) are shown to the left and β-actin indicates loading control. (−) Indicates non-transfected control cells. Graphs show quantification of Transwell cell migration in (E) JAR cells transfected with control (NS) and ADAM8-silencing (A8i-1, A8i-2) siRNA (n = 3 or n = 4 per condition) and (F) HTR8 cells transfected with empty (EV), ADAM8 full-length (A8) and protease-dead ADAM8 (A8∆EQ) (n = 3 or n = 4 per condition). Transwells were either uncoated or coated with fibronectin or Matrigel. *P ≤ 0.05, **P ≤ 0.01, ***P ≤ 0.001; One-way ANOVA (Dunn’s multiple comparisons test). (G) Gelatin zymography image showing pro- and active-MMP2/MMP9 in JAR and HTR8 cells transfected with control/ADAM8 siRNA or ectopic control/ADAM8 expression constructs. Immunoblot of GAPDH indicates protein loading in each well. Molecular weights (kDa) are shown to the left. Line graphs depict cell proliferation (H) in JAR cells transfected with control (NS) and ADAM8-silencing siRNA (A8i-1, A8i-2) over 72 h or (I) HTR8/SVneo cells transfected with empty (EV), ADAM8 full-length (A8) or protease-dead ADAM8 (A8∆EQ) over 48 h (n = 3 for each cell line). ***P ≤ 0.001, ****P ≤ 0.0001; one-way ANOVA (Dunn’s multiple comparisons test).
Figure 4
Figure 4
ADAM8 transiently localizes to actin-rich structures during cell attachment and promotes cell adhesion to fibronectin matrix. (A) Representative immunofluorescence images (from n = 4 experiments) of transiently transfected HTR8 cells probed with antibody directed against Myc-tag epitope (white or green). Filamentous actin is labeled with phalloidin (white or red) and nuclei are stained with DAPI (blue). Cells were transfected with full-length pCDNA3.1-ADAM8 (ADAM8-Myc) or protease-dead pCDNA3.1-ADAM8∆EQ (ADAM8∆EQ-Myc) expression constructs and seeded on fibronectin-coated coverslips for 20 and 120 min. Perforated white box shows magnified region. Bars = 20 μm. Bar graphs show relative proportions of cells adhering to fibronectin matrix in (B) HTR8 cells transiently transfected with control empty vector (EV), full-length ADAM8 (A8), and protease-dead ADAM8 (A8∆EQ) or in (C) JAR cells transfected with control (NS) and ADAM8 silencing (A8i-1, A8i-2) siRNA following 20 or 120 min of culture (n = 3 per condition). *P ≤ 0.05, **P ≤ 0.01; one-way ANOVA (Dunn’s multiple comparisons test).
Figure 5
Figure 5
ADAM8 potentiates trophoblast–matrix attachment by engaging β1-integrin-dependent cell spreading. (A) Representative immunofluorescence images (from n = 3 experiments) of JAR trophoblastic cells transfected with control (NS) or ADAM8-silencing (A8i-1, A8i-2) siRNA probed with antibody directed against active β1-integrin (clone 12G10; white or green) following 60 or 120 min post-seeding onto fibronectin matrix. Filamentous actin is labeled with phalloidin (white or red) and nuclei are stained with DAPI (blue). Bars = 20 μm. (B) Box-plots show the proportion of control and ADAM8 siRNA transfected JAR cells harboring the punctate active β1-integrin signal. ***P ≤ 0.001; One-way ANOVA (Dunn’s multiple comparisons test). (C) Bar graph shows mean cell intensity of active β1-integrin fluorescence signal in control (NS) and ADAM8-silenced (A8i-1, A8i-2) JAR cells following 60 min of seeding onto fibronectin matrix. ***P ≤ 0.001, ****P ≤ 0.0001; one-way ANOVA (Dunn’s multiple comparisons test). (D) Representative immunoblots (IB) showing co-immunoprecipitation of active β1-integrin (clone 12G10) with active-ADAM8 in JAR cells seeded onto fibronectin over 120 min (0–120 min). Whole cell protein lysates (input lysate) or β1-integrin immunoprecipitates (β1-integrin IP) were probed with antibodies targeting ADAM8, α5-integrin and β1-integrin (clone P5D2). Shown are short (short exp.) and long (long exp.) exposures for ADAM8 signal. Molecular weights (kDa) are shown to the left.
Figure 6
Figure 6
ADAM8 promotes trophoblast migration through a β1-integrin-dependent mechanism. (A) Representative immunofluorescence images of control (NS) or ADAM8-silenced (A8i-2) JAR cells immunolabelled with an antibody recognizing active β1-integrin (12G10; white) following 60 min of culture on fibronectin-coated coverslips. Nuclei are labeled with DAPI (blue). Bars = 20 μm. (B) Bar graphs show relative migration of control (NS; n = 3) and ADAM8-silenced (A8i-2; n = 3) JAR cells cultured in the absence (−) or presence (+) of an activating β1-integrin antibody. (C) Bar graphs show relative migration of HTR8 cells ectopically expressing empty vector (EV), full-length ADAM8 (A8) or protease-dead ADAM8 (A8∆EQ) cultured in the absence (−) or presence (+) of inhibitory β1-integrin antibody (P5D2). *P ≤ 0.05, **P ≤ 0.01; one-way ANOVA (Dunn’s multiple comparisons test).

Similar articles

Cited by

References

    1. Aghababaei M, Beristain AG. The Elsevier Trophoblast Research Award Lecture: importance of metzincin proteases in trophoblast biology and placental development: a focus on ADAM12. Placenta 2015;36:S11–S19. - PubMed
    1. Aghababaei M, Hogg K, Perdu S, Robinson WP, Beristain AG. ADAM12-directed ectodomain shedding of E-cadherin potentiates trophoblast fusion. Cell Death Differ 2015;22:1970–1984. Nature Publishing Group. - PMC - PubMed
    1. Aghababaei M, Perdu S, Irvine K, Beristain AG. A disintegrin and metalloproteinase 12 (ADAM12) localizes to invasive trophoblast, promotes cell invasion and directs column outgrowth in early placental development. Mol Hum Reprod 2014;20:235–249. - PubMed
    1. Bax DV, Messent AJ, Tart J, van Hoang M, Kott J, Maciewicz RA, Humphries MJ. Integrin alpha5beta1 and ADAM-17 interact in vitro and co-localize in migrating HeLa cells. J Biol Chem 2004;279:22377–22386. American Society for Biochemistry and Molecular Biology. - PubMed
    1. Beristain AG, Molyneux SD, Joshi PA, Pomroy NC, Di Grappa MA, Chang MC, Kirschner LS, Privé GG, Pujana MA, Khokha R. PKA signaling drives mammary tumorigenesis through Src. Oncogene 2015;34:1160–1173. - PubMed

Publication types