. 2019 Apr 29;70(9):2419-2434.
doi: 10.1093/jxb/ery308.

Environmental triggers for photosynthetic protein turnover determine the optimal nitrogen distribution and partitioning in the canopy

Affiliations

Environmental triggers for photosynthetic protein turnover determine the optimal nitrogen distribution and partitioning in the canopy

Yi-Chen Pao et al. J Exp Bot. .

Abstract

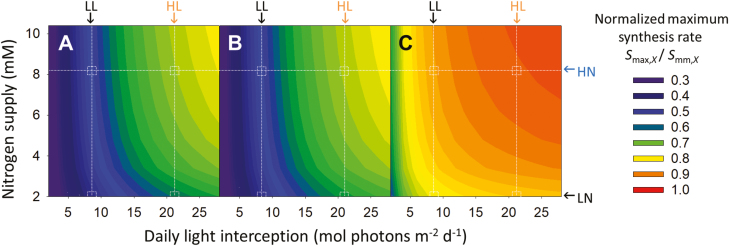
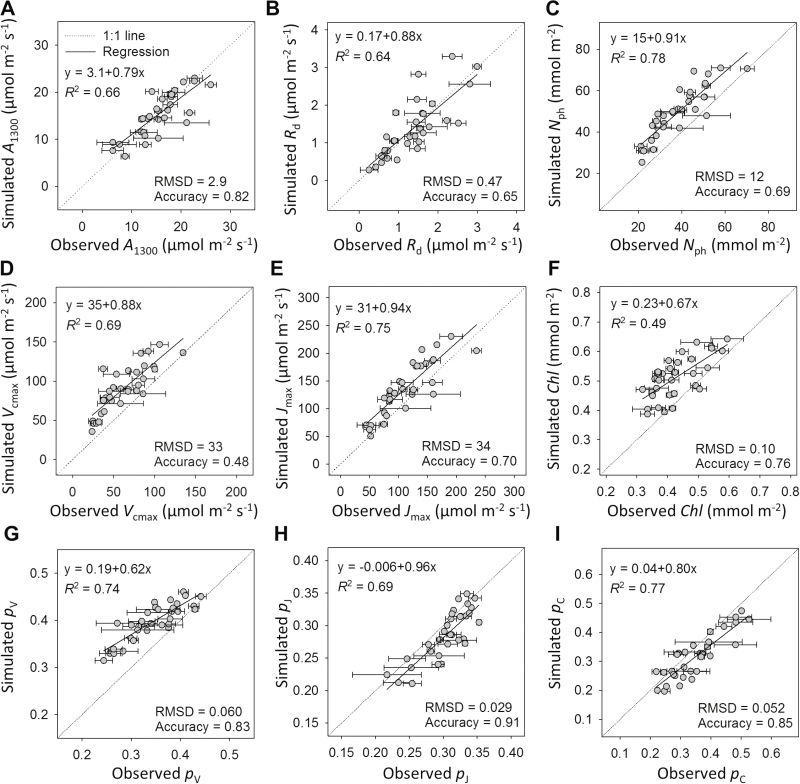
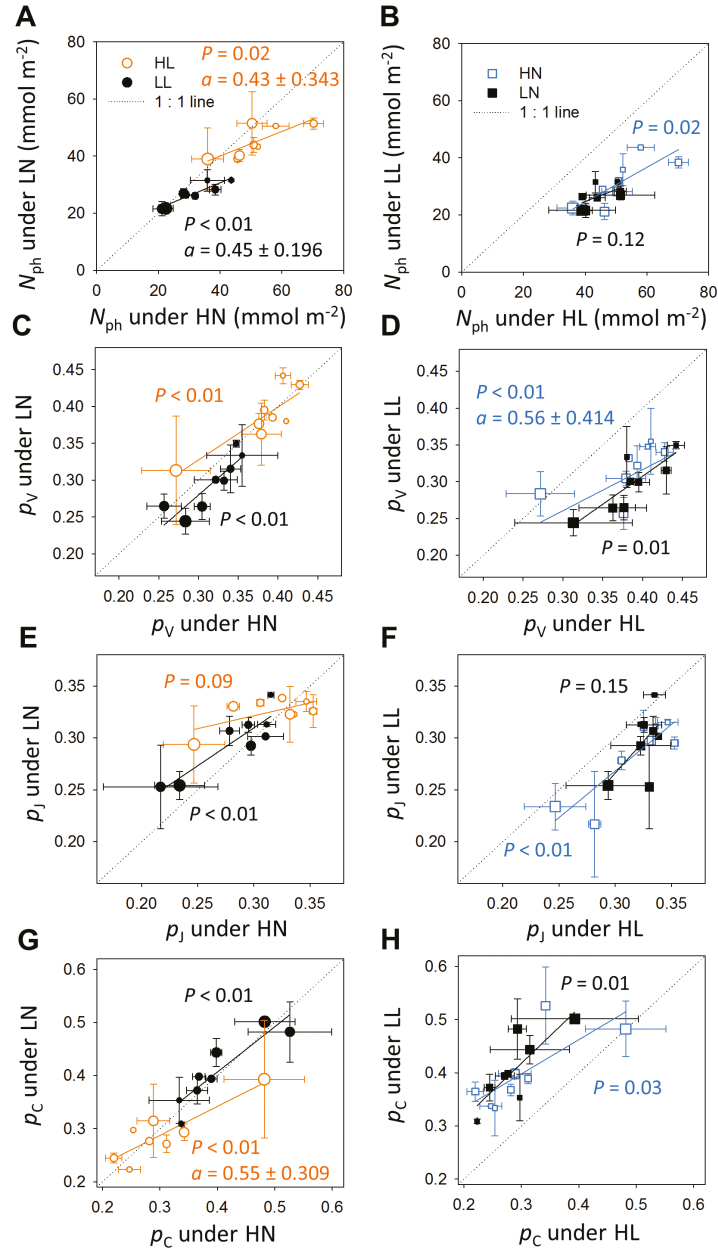
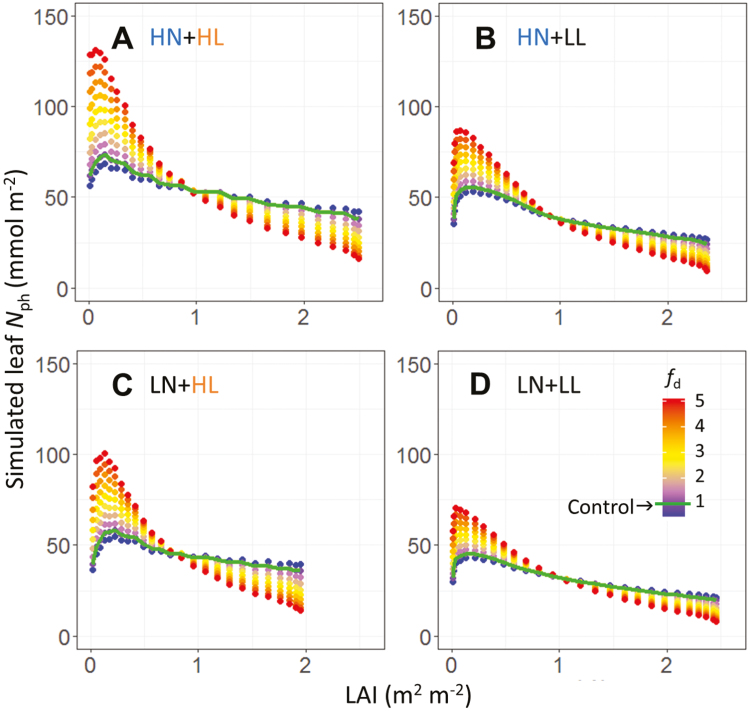
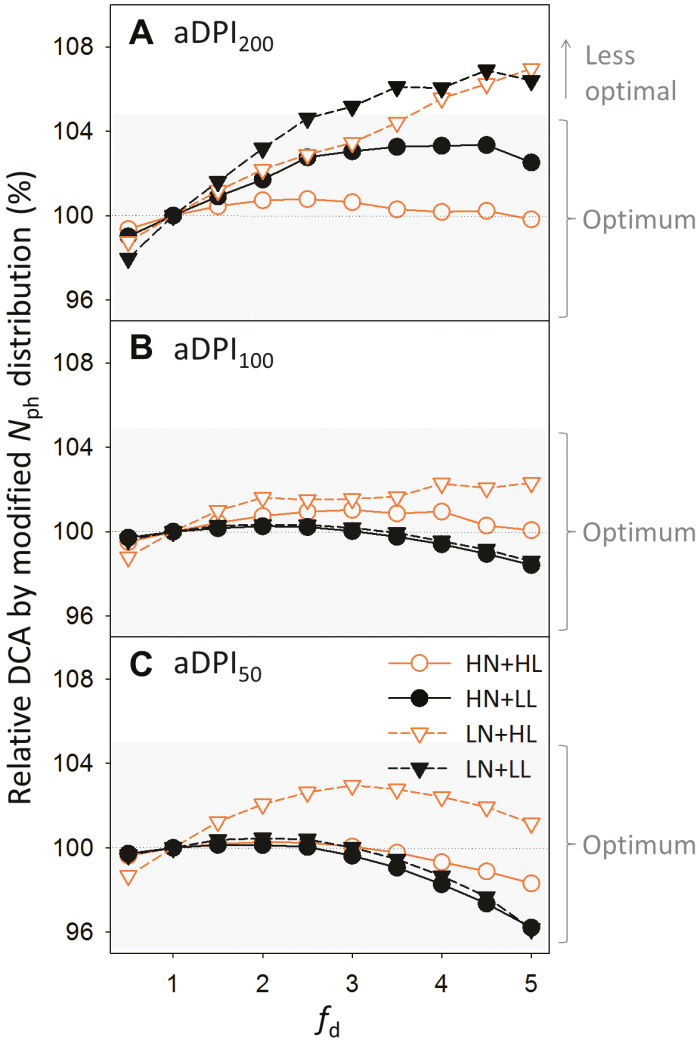
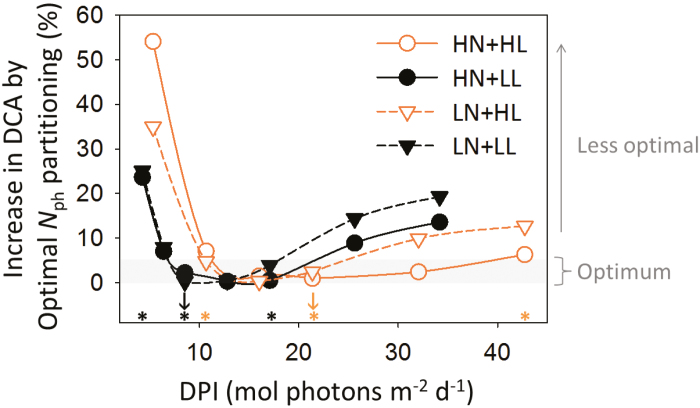
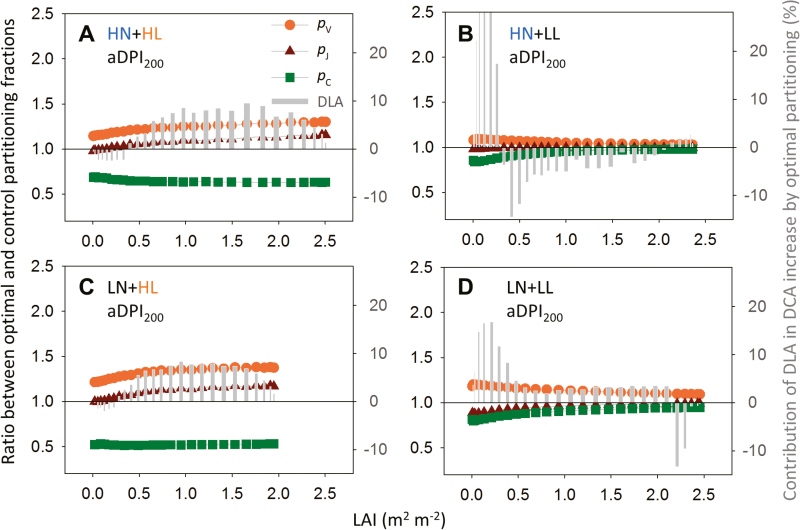
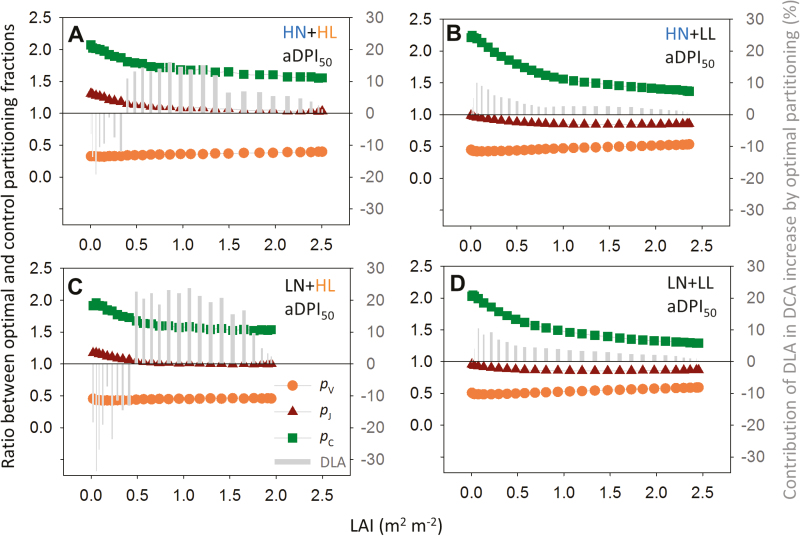
Plants continually adjust the photosynthetic functions in their leaves to fluctuating light, thereby optimizing the use of photosynthetic nitrogen (Nph) at the canopy level. To investigate the complex interplay between external signals during the acclimation processes, a mechanistic model based on the concept of protein turnover (synthesis and degradation) was proposed and parameterized using cucumber grown under nine combinations of nitrogen and light in growth chambers. Integrating this dynamic model into a multi-layer canopy model provided accurate predictions of photosynthetic acclimation of greenhouse cucumber canopies grown under high and low nitrogen supply in combination with day-to-day fluctuations in light at two different levels. This allowed us to quantify the degree of optimality in canopy nitrogen use for maximizing canopy carbon assimilation, which was influenced by Nph distribution along canopy depth or Nph partitioning between functional pools. Our analyses suggest that Nph distribution is close to optimum and Nph reallocation is more important under low nitrogen. Nph partitioning is only optimal under a light level similar to the average light intensity during acclimation, meaning that day-to-day light fluctuations inevitably result in suboptimal Nph partitioning. Our results provide insights into photoacclimation and can be applied to crop model improvement.

Keywords: Functional partitioning; light; mechanistic model; nitrogen reallocation; nitrogen supply; optimal; photosynthetic acclimation.


Figures

Fig. 1.
Fig. 1.
Simulated effects of daily light interception (ILd, mol photons m−2 d−1) and nitrogen supply level in the nutrient solution (NS, mM) on maximum protein synthesis rate (Smax,X) in Eq. (7) using coefficients from Table 1, of (A) the carboxylation, (B) the electron transport and (C) the light harvesting pools. The colors denote the normalized maximum protein synthesis rate, which is Smax,X normalized by the potential maximum protein synthesis rate (Smm,X) in Eq. (7). The data obtained in the growth chamber experiment were used for the parameterization. The arrows above and beside the figures indicate the corresponding average environmental conditions in the greenhouse experiment: high light (HL) 21.4 mol photons m−2 d−1; low light (LL) 8.5 mol photons m−2 d−1; high nitrogen (HN) 8.2 mM; low nitrogen (LN) 2.0 mM.
Fig. 2.
Fig. 2.
Comparisons between simulated and observed leaf photosynthetic parameters. (A) Light-saturated net photosynthetic rate under PPFD 1300 µmol photons m−2 s−1 (A1300, µmol CO2 m−2 s−1); (B) daytime respiration rate (Rd, µmol CO2 m−2 s−1); (C) leaf photosynthetic nitrogen (Nph, mmol N m−2); (D) maximum carboxylation rate (Vcmax, µmol CO2 m−2 s−1); (E) maximum electron transport rate (Jmax, µmol e m−2 s−1); (F) chlorophyll (Chl, mmol Chl m−2); (G) partitioning fraction of the carboxylation pool (pV); (H) partitioning fraction of the electron transport pool (pJ); and (I) partitioning fraction of the light harvesting pool (pC). The observed data were obtained in the greenhouse experiment. The dotted grey lines are one-to-one lines. Root mean squared deviation (RMSD) and accuracy of the predictions are shown (see Materials and methods).
Fig. 3.
Fig. 3.
Comparisons of leaf photosynthetic nitrogen (Nph, mmol N m−2; A, B), partitioning fractions of the carboxylation pool (pV; C, D), the electron transport pool (pJ; E, F), and the light harvesting pool (pC; G, H) between high and low nitrogen supply (HN and LN, respectively; A, C, E, G) and between high and low light conditions (HL and LL, respectively; B, D, F, H). Each point represents the measurements in the greenhouse experiment obtained from a comparable canopy layer. The orange open circles indicate leaves grown under HL, the black closed circles indicate LL, the blue open squares indicate HN and the black closed squares indicate LN. The size of the circles increases with leaf age, ranging from 77 °Cd to 414 °Cd. The solid lines show the linear regression y=ax + b. The P values of the slope a are shown. The values of a are specified with 95% confidence intervals when they are significantly different from 1. The dotted grey lines are one-to-one lines.
Fig. 4.
Fig. 4.
Leaf photosynthetic nitrogen (Nph, mmol N m−2) distributions along the canopy depth, characterized by leaf area index (LAI, m2 m−2). Variations in nitrogen distribution were created using a distribution factor fd ranging from 0.5 to 5.0 at intervals of 0.5 in Eq. (18) under different growth conditions. (A) High nitrogen and high light (HN+HL); (B) high nitrogen and low light (HN+LL); (C) low nitrogen and high light (LN+HL); (D) low nitrogen and low light (LN+LL). Simulated control Nph distributions (fd=1) are indicated by the green lines.
Fig. 5.
Fig. 5.
Effects of photosynthetic nitrogen (Nph) distributions with different values of fd (Fig. 4) on daily canopy carbon assimilation (DCA) under different daily photosynthetic photon integrals (DPI, mol photons m−2 d−1) relative to average DPI during acclimation (aDPI). (A) Two-fold aDPI (aDPI200); (B) aDPI (aDPI100); (C) half aDPI (aDPI200). Acropetal Nph reallocation increases with fd. Plants grown under high nitrogen and high light (HN+HL, orange open circles), under high nitrogen and low light (HN+LL, black closed circles), under low nitrogen and high light (LN+HL, orange open triangles), and under low nitrogen and low light (LN+LL, black closed triangles) are compared under given DPI. The relative change in DCA was calculated by dividing the DCA obtained with a given Nph distribution by the DCA obtained with the control Nph distribution (fd=1) under same DPI. A change within ±5% (grey shading) is considered insignificant.
Fig. 6.
Fig. 6.
Increase in daily canopy carbon assimilation (DCA) by optimizing photosynthetic nitrogen (Nph) partitioning for different growth conditions under various daily photosynthetic photon integrals (DPI, mol photons m−2 d−1). The increase in DCA was the DCA with the optimal partitioning under a given DPI in comparison with the control partitioning [fp,X=1 in Eq. (19)]. An increase less than 5% (grey shading) is considered insignificant. The average DPI during acclimation (aDPI) is indicated by the orange arrow for HL (21.4 mol photons m−2 d−1) and by the black arrow for LL (8.5 mol photons m−2 d−1). The asterisks indicate the scenarios compared in Figs 7, 8 and Table 4 with 50%, 100% and 200% aDPI. The symbols and colors used here are the same as those in Fig. 5.
Fig. 7.
Fig. 7.
Ratio between optimal and control partitioning fractions (optimal pX/control pX) of the carboxylation pool (pV, orange circles), the electron transport pool (pJ, red triangles), the light harvesting pool (pC, green squares), and contributions of daily leaf carbon assimilation (DLA) to the daily canopy carbon assimilation (DCA) increase by optimal partitioning (grey bars, right y-axis) along the canopy depth [leaf area index (LAI) m2 m−2] under 200% average daily photosynthetic photon integral during acclimation (aDPI200) for plants grown under (A) high nitrogen and high light (HN+HL), (B) high nitrogen and low light (HN+LL), (C) low nitrogen and high light (LN+HL), (D) low nitrogen and low light (LN+LL) conditions. Photosynthetic nitrogen partitioning is close to optimum for HN+LL and LN+LL under aDPI200, which corresponds to a DPI of 42.7 and 17.1 mol photons m−2 d−1 for HL and LL, respectively. See Table 4 for the increase in DCA by the optimal partitioning.
Fig. 8.
Fig. 8.
Ratio between optimal and control partitioning fractions (optimal pX/control pX), and contributions of daily leaf carbon assimilation (DLA) to the daily canopy carbon assimilation (DCA) increase by optimal partitioning (grey bars, right y-axis) along the canopy depth [leaf area index (LAI) m2 m−2] under 50% average daily photon integral during acclimation (aDPI50) for plants grown under (A) high nitrogen and high light (HN+HL), (B) high nitrogen and low light (HN+LL), (C) low nitrogen and high light (LN+HL), (D) low nitrogen and low light (LN+LL) conditions. Photosynthetic nitrogen partitioning is close to optimum for LN+HL under aDPI50, which corresponds to a DPI of 10.7 and 4.3 mol photons m−2 d−1 for HL and LL, respectively. The symbols and colors used here are the same as those in Fig. 7. See Table 4 for the increase in DCA by the optimal partitioning.

References

    1. Anten NP , Miyazawa K , Hikosaka K , Nagashima H , Hirose T. 1998. Leaf nitrogen distribution in relation to leaf age and photon flux density in dominant and subordinate plants in dense stands of a dicotyledonous herb. Oecologia 113, 314–324. - PubMed
    1. Anten NP , Schieving F , Werger MJ. 1995. Patterns of light and nitrogen distribution in relation to whole canopy carbon gain in C3 and C4 mono- and dicotyledonous species. Oecologia 101, 504–513. - PubMed
    1. Athanasiou K , Dyson BC , Webster RE , Johnson GN. 2010. Dynamic acclimation of photosynthesis increases plant fitness in changing environments. Plant Physiology 152, 366–373. - PMC - PubMed
    1. Bathellier C , Tcherkez G , Lorimer GH , Farquhar GD. 2018. Rubisco is not really so bad. Plant, Cell & Environment 41, 705–716. - PubMed
    1. Boote KJ , Jones JW , White JW , Asseng S , Lizaso JI. 2013. Putting mechanisms into crop production models. Plant, Cell & Environment 36, 1658–1672. - PubMed

Publication types