. 2018 Nov 16;46(20):10917-10929.
doi: 10.1093/nar/gky746.

Conformational switch in the ribosomal protein S1 guides unfolding of structured RNAs for translation initiation

Affiliations

Conformational switch in the ribosomal protein S1 guides unfolding of structured RNAs for translation initiation

Nusrat Shahin Qureshi et al. Nucleic Acids Res. .

Abstract

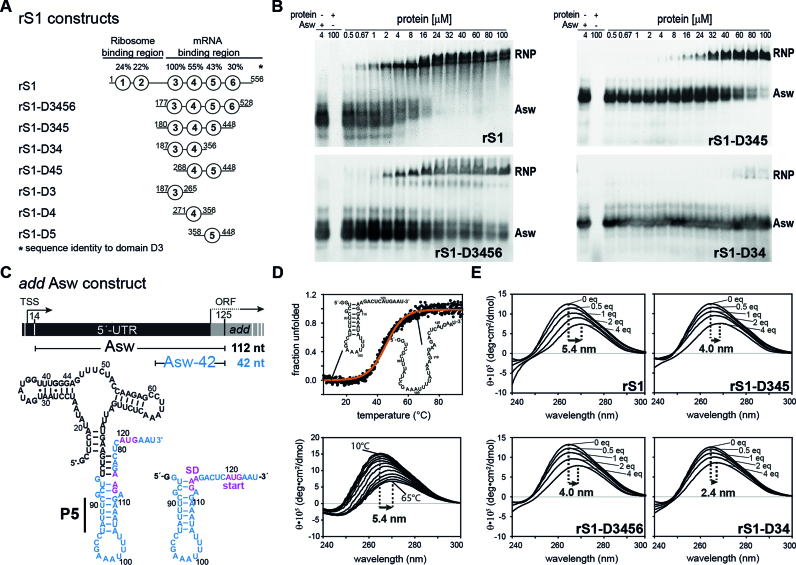
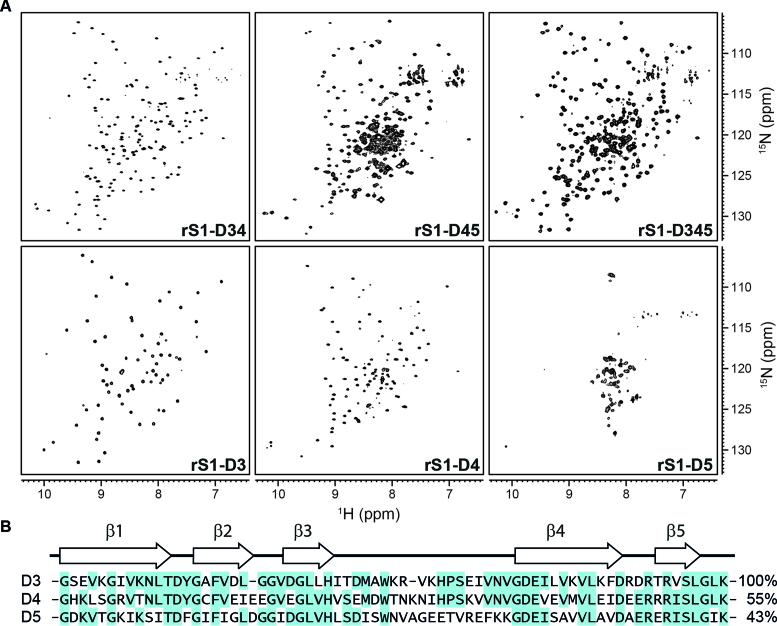
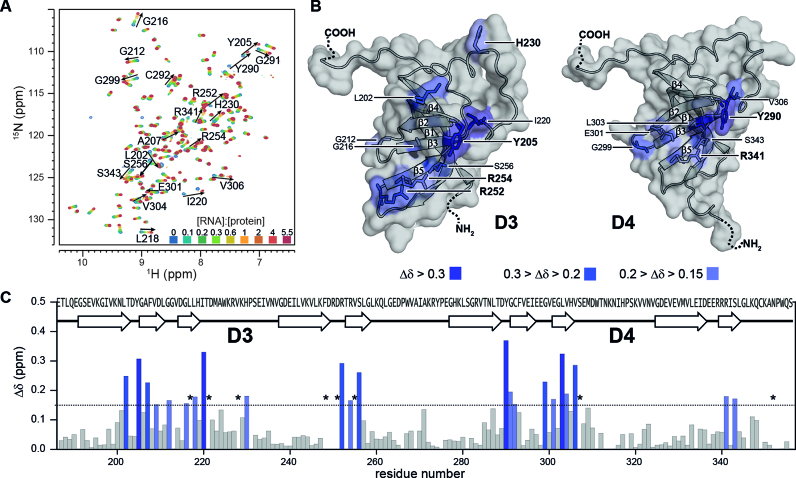
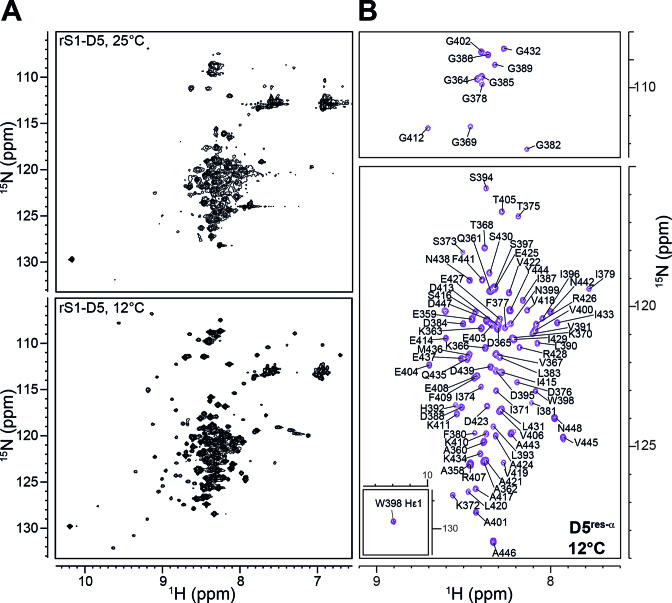
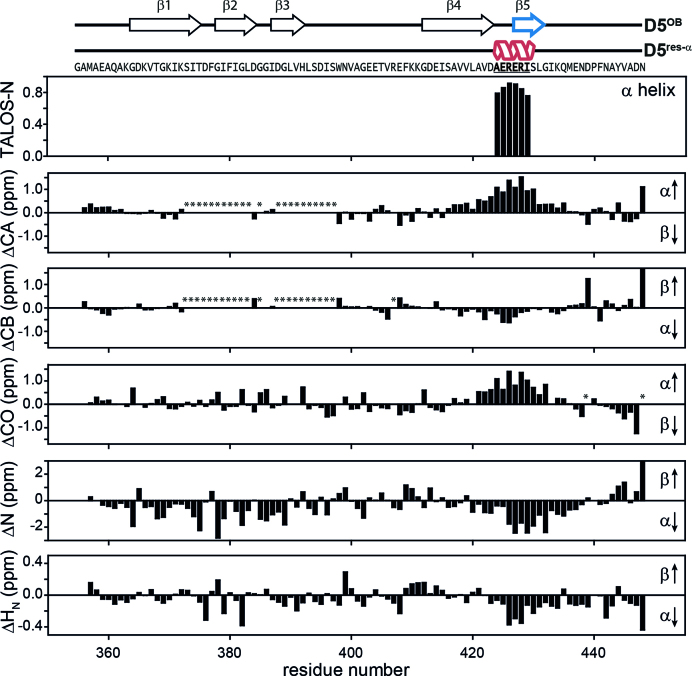
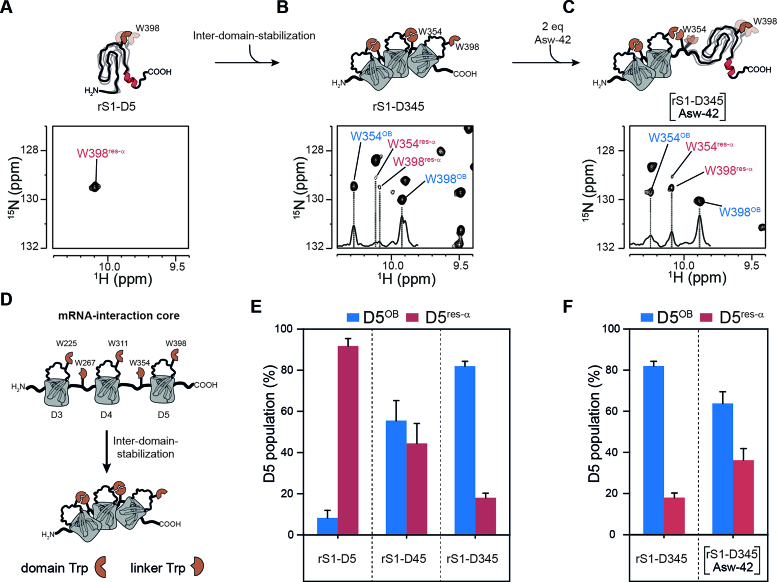
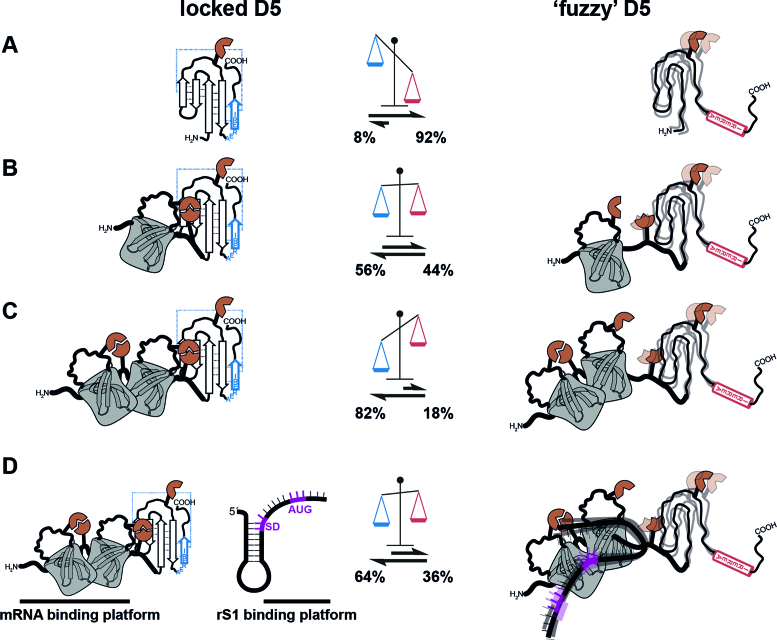
Initiation of bacterial translation requires that the ribosome-binding site in mRNAs adopts single-stranded conformations. In Gram-negative bacteria the ribosomal protein S1 (rS1) is a key player in resolving of structured elements in mRNAs. However, the exact mechanism of how rS1 unfolds persistent secondary structures in the translation initiation region (TIR) is still unknown. Here, we show by NMR spectroscopy that Vibrio vulnificus rS1 displays a unique architecture of its mRNA-binding domains, where domains D3 and D4 provide the mRNA-binding platform and cover the nucleotide binding length of the full-length rS1. D5 significantly increases rS1's chaperone activity, although it displays structural heterogeneity both in isolation and in presence of the other domains, albeit to varying degrees. The heterogeneity is induced by the switch between the two equilibrium conformations and is triggered by an order-to-order transition of two mutually exclusive secondary structures (β-strand-to-α-helix) of the 'AERERI' sequence. The conformational switching is exploited for melting of structured 5'-UTR's, as the conformational heterogeneity of D5 can compensate the entropic penalty of complex formation. Our data thus provides a detailed understanding of the intricate coupling of protein and RNA folding dynamics enabling translation initiation of structured mRNAs.


Figures

Figure 1.
Figure 1.
RNA-binding and –chaperone activity of rS1 and its truncated versions. (A) Schematic overview of the rS1 constructs used in this study. Fragments are aligned according to their amino acid sequence. Sequence identities compared to domain D3 are displayed on the top. (B) Electrophoretic mobility shift assays (EMSAs) of selected rS1 constructs, using full-length add Asw (4 μM) as RNA substrate. Increasing protein concentrations are depicted on the top of the gels. The EMSAs were performed on discontinuous gels and only the resolving phases are displayed. Bands reporting on complex formation or free RNA are labeled with RNP or Asw, respectively. Two bands are observed for the free RNA, as the ligand-free riboswitch adopts two conformations (apoA and apoB) (38). In case of the full-length rS1 these states are also resolved for the RNP, since the EMSA was performed at higher powers in order to ensure migration of the complex into the resolving phase of the gel. In addition for the full-length rS1 a high-molecular species was observed (<5%) that did not migrate into the resolving phase of the discontinuous gel (not displayed). (C) Schematic overview of add Asw constructs. Asw-42 is highlighted in blue and the location of the P5 helix is indicated. The add gene from V. vulnificus including the transcription start site (TSS) and the open reading frame (ORF) is displayed on the top. (D) Thermal unfolding of Asw-42 (10 μM) to visualize the red-shift of CD maxima upon RNA melting. Temperature-dependent CD spectra of Asw-42 are shown. They were used as a benchmark for CD titration experiments reporting on RNA melting. (E) rS1-induced unfolding of Asw-42 (10 μM) as measured by CD spectra. All CD titration experiments were carried out at 10°C. Molar ratios of [protein]:[RNA] are depicted in the plots. The maximal shifts are displayed.
Figure 2.
Figure 2.
Comparison of the mRNA-binding core domains by NMR and sequence. (A) 1H–15N-BEST-TROSY spectra of rS1 constructs as indicated. The spectrum of rS1-D345 was acquired at 35°C and 950 MHz. All other spectra were acquired at 30°C and 600 MHz. (B) Domain sequences were aligned using the Multiple Sequence Alignment tool from Clustal Omega (68–70). Sequence identities in comparison to domain D3 are displayed on the right. Secondary structure elements were computed using SWISS-MODEL (71–74) and are displayed on the top. Identical residues are highlighted.
Figure 3.
Figure 3.
Interaction of rS1-D34 with Asw-14. (A) Superposition of 1H-15N-BEST-TROSY acquired at 35°C and 600 MHz. NMR titration was performed with 100 μM 15N-labeled rS1-D34. Unlabeled Asw-14 was added stepwise with ratios ranging from 0 to 5.5 equivalents. The molar ratio ([RNA]:[protein]) is color coded within the superimposed spectra. (B) Cartoon representations of D3 and D4 model structures that were generated in SWISS-MODEL (71–74) using the PDB entry 2KHI (18) as template for homology modeling. Observed chemical shift perturbations of binding site reporters are plotted and color coded according to CSP values. The surface is displayed and solvent exposed residues are additionally shown as sticks. Surface binding site reporters are annotated and basic and aromatic residues are highlighted. (C) Chemical shift perturbations, calculated as described in the method section, between free and bound rS1-D34 are plotted as function of rS1-D34 sequence. Horizontal line indicates threshold value that was used to identify binding site reporters (53). Asterisks mark residues that are undetectable due to RNA-induced exchange broadening. Missing values represent either prolines or undetectable residues (G213, R250, W311, N313, N315 are exchange broadened at 35°C. D249, T253, K314, L346, A269 and C349 could not be assigned as the amide resonances were absent from 1H–15N-correlation spectra).
Figure 4.
Figure 4.
The two conformational states of rS1-D5. (A) 1H–15N-HSQC spectra were acquired at the displayed temperatures and at 900 MHz. (B) Annotated resonance assignment for D5res-α. The spectrum (acquired at 12°C and 900 MHz) is identical to the spectrum in panel (A) but to exclusively display the predominantly unstructured D5 state, the 1H–15N-HSQC is plotted at higher contour levels.
Figure 5.
Figure 5.
Structural characteristics of the D5res-α state. The chemical shifts of backbone atoms are sensitive for local structure. Their deviations from random coil values can be used for determination of secondary structure based on experimental data. In the upper plot the fractional secondary structure as calculated from TALOS-N is plotted against the protein sequence (59), where an α-helix is found between A424-I429. The lower plots display 1H, 15N and 13C secondary chemical shifts as a function of residue number. They were calculated as Δ = δobs − δrc (58), where δobs are the observed chemical shifts and δrc are the random coil chemical shifts. δrc were generated using the Javascript provided by Alex Maltsev, on the website of the University of Copenhagen (http://www1.bio.ku.dk/english/research/bms/research/sbinlab/groups/mak/randomcoil/script; 18 April 2018). The expected secondary structure element is indicated within the plot with arrows. All secondary chemical shift values indicate α-helical structure of the sequence stretch A421-G432. The largest values coincide with the AERERI sequence, strongly pointing towards α-helical structure of this particular sequence. In case of ΔCB and ΔN the secondary chemical shifts for N448 are truncated and have a value of 1.9 and 5.7, respectively. Asterisks mark not observed resonances. For clarity primary sequence and secondary structure elements of both rS1-D5 states are displayed on the very top of the figure.
Figure 6.
Figure 6.
Structural heterogeneity of D5 in presence of preceding domains and RNA. (A) The 1H–15N-HSQC of rS1-D5 was acquired at 35°C and 950 MHz and an excerpt of tryptophan indole region is displayed to illustrate the res-α state. (B) and (C) displays excerpts of tryptophan indole region of rS1-D345 in the absence and presence of two equivalents Asw-42, respectively. For the NMR titration experiments, 1H–15N-BEST-TROSY (NS = 96) spectra were acquired at 35°C and 950 MHz. Unlabeled Asw-42 was added stepwise with ratios ranging from 0 to 2 equivalents. In the presence of RNA a huge intensity decrease of rS1-D345 resonances was observed. Hence, the titration end point was additionally acquired with more number of scans (NS = 256). This spectrum was used for determination of D5-populations and is displayed in panel (C). Positive 1D projections are displayed within the spectra. W-Hϵ1 resonances of D5res-αare annotated in red and of D5OB in blue. (D) Schematic overview of tryptophan-mediated domain stabilization. (E) The populations of the two D5 states are plotted against rS1 constructs. Populations of each reporter signal were determined from their intensities as formula image and vice versa. The populations were averaged over all reporter peaks for each rS1-construct. Error bars represent standard deviation of the average. (F) D5 population of rS1-D345 is plotted in the absence and presence (2 equivalents) of Asw-42. The rS1-D345-induced melting of Asw-42 was also monitored by NMR and is displayed in Supplementary Figure S7.
Figure 7.
Figure 7.
Intrinsic structural heterogeneity of domain D5. Schematic representation of the D5OB and D5res-α conformational states within the rS1 constructs (A) rS1-D5, (B) rS1-D45 and (C) rS1-D345. The populations are displayed in the scheme. (D) D5 populations in the absence and presence of Asw-42.

Similar articles

Cited by

References

    1. Cristofari G., Darlix J.-L.. The ubiquitous nature of RNA chaperone proteins. Prog. Nucleic Acid Res. Mol. Biol. 2002; 72:223–268. - PubMed
    1. Rajkowitsch L., Chen D., Stampfl S., Semrad K., Waldsich C., Mayer O., Jantsch M.F., Konrat R., Bläsi U., Schroeder R.. RNA chaperones, RNA annealers and RNA helicases. RNA Biol. 2007; 4:118–130. - PubMed
    1. Doetsch M., Fürtig B., Gstrein T., Stampfl S., Schroeder R.. The RNA annealing mechanism of the HIV-1 Tat peptide: Conversion of the RNA into an annealing-competent conformation. Nucleic Acids Res. 2011; 39:4405–4418. - PMC - PubMed
    1. Herschlag D. RNA chaperones and the RNA folding problem. J. Biol. Chem. 1995; 270:20871–20874. - PubMed
    1. Woodson S.A. Taming free energy landscapes with RNA chaperones. RNA Biol. 2010; 7:677–686. - PMC - PubMed

Publication types

MeSH terms

LinkOut - more resources