

Variation graph toolkit improves read mapping by representing genetic variation in the reference
- PMID: 30125266
- PMCID: PMC6126949
- DOI: 10.1038/nbt.4227
Variation graph toolkit improves read mapping by representing genetic variation in the reference
Abstract
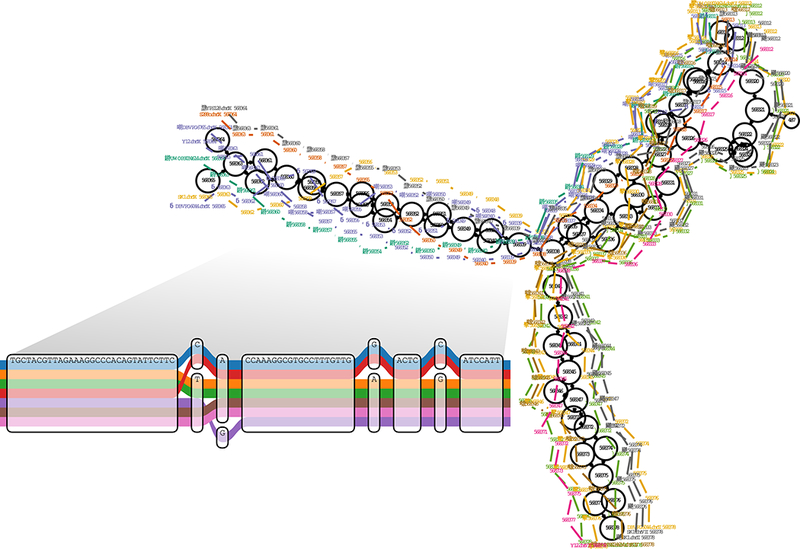
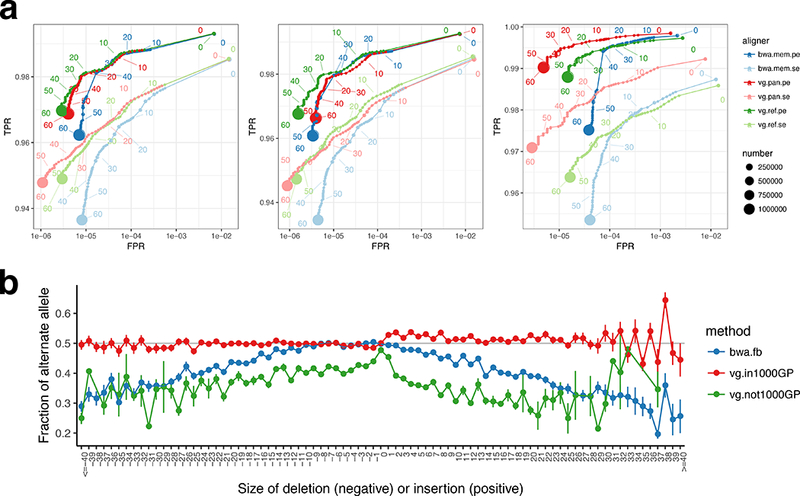
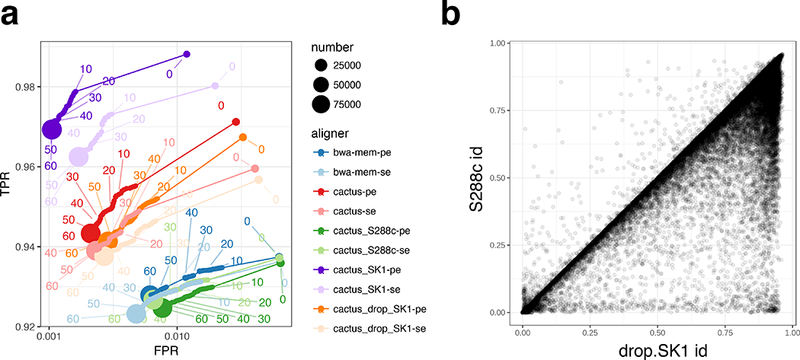
Reference genomes guide our interpretation of DNA sequence data. However, conventional linear references represent only one version of each locus, ignoring variation in the population. Poor representation of an individual's genome sequence impacts read mapping and introduces bias. Variation graphs are bidirected DNA sequence graphs that compactly represent genetic variation across a population, including large-scale structural variation such as inversions and duplications. Previous graph genome software implementations have been limited by scalability or topological constraints. Here we present vg, a toolkit of computational methods for creating, manipulating, and using these structures as references at the scale of the human genome. vg provides an efficient approach to mapping reads onto arbitrary variation graphs using generalized compressed suffix arrays, with improved accuracy over alignment to a linear reference, and effectively removing reference bias. These capabilities make using variation graphs as references for DNA sequencing practical at a gigabase scale, or at the topological complexity of de novo assemblies.
Conflict of interest statement
COMPETING FINANCIAL INTERESTS
ML is an employee of, and EG consults for, DNAnexus Inc. RD holds shares in and consults for Congenica Ltd and Dovetail Inc. The remaining authors declare no competing financial interests.
Figures
Comment in
-
Genomes for all.Nat Biotechnol. 2018 Sep 6;36(9):815-816. doi: 10.1038/nbt.4244. Nat Biotechnol. 2018. PMID: 30188541 No abstract available.
References
-
- Eggertsson HP et al. Graphtyper enables population-scale genotyping using pangenome graphs. Nat. Genet 49, 1654–1660 (2017). - PubMed
-
- Siren J Indexing variation graphs. Proc. 19th Workshop on Algorithm Engineering and Experiments (ALENEX) (2017).
Publication types
MeSH terms
Substances
Grants and funding
LinkOut - more resources
Full Text Sources
Other Literature Sources
