. 2018 Aug 20;16(8):e2004974.
doi: 10.1371/journal.pbio.2004974. eCollection 2018 Aug.

Timescales of influenza A/H3N2 antibody dynamics

Affiliations

Timescales of influenza A/H3N2 antibody dynamics

Adam J Kucharski et al. PLoS Biol. .

Abstract

Human immunity influences the evolution and impact of influenza strains. Because individuals are infected with multiple influenza strains during their lifetime, and each virus can generate a cross-reactive antibody response, it is challenging to quantify the processes that shape observed immune responses or to reliably detect recent infection from serological samples. Using a Bayesian model of antibody dynamics at multiple timescales, we explain complex cross-reactive antibody landscapes by inferring participants' histories of infection with serological data from cross-sectional and longitudinal studies of influenza A/H3N2 in southern China and Vietnam. We find that individual-level influenza antibody profiles can be explained by a short-lived, broadly cross-reactive response that decays within a year to leave a smaller long-term response acting against a narrower range of strains. We also demonstrate that accounting for dynamic immune responses alongside infection history can provide a more accurate alternative to traditional definitions of seroconversion for the estimation of infection attack rates. Our work provides a general model for quantifying aspects of influenza immunity acting at multiple timescales based on contemporary serological data and suggests a two-armed immune response to influenza infection consistent with competitive dynamics between B cell populations. This approach to analysing multiple timescales for antigenic responses could also be applied to other multistrain pathogens such as dengue and related flaviviruses.


Conflict of interest statement

The authors have declared that no competing interests exist.

Figures
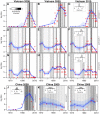
Fig 1
Fig 1. Representative individual-level HI titres against influenza in Vietnam (A–I) and southern China (J–L).
(A–C) Example participant from Vietnam dataset. Strong evidence of infection in 2009, leading to rise in titres and back boost from broad short-term cross-reaction, then decay in following year. Red points show observed titre. Titres correspond to strains isolated in each year, based on antigenic path shown in S1 Fig. Blue lines show median titre in fitted model, with blue regions showing 50% and 95% MCMC credibility intervals. Black lines show samples from the posterior distribution of individual infection histories, with opacity indicating the probability of infection (i.e., proportion of MCMC samples that estimated infection in that year). The (C) inset shows distribution of estimated total infections. (D–F) Second Vietnam participant. No estimated infections between 2008 and 2010, so titres are at equilibrium. (G–I) Third Vietnam participant. Infection in 2009 leading to broad boost, with titres generally highest against recent strains (H) then decline to equilibrium, with lower mean titres against recent strains as a result of antigenic seniority (I). (J–L) Cross-sectional results from southern China, indicating (J) evidence of multiple recent infections for participant aged 15 years; (K) decline in titres as a result of antigenic seniority (participant aged 41 years); (L) evidence of infections early and late in life (participant aged 57 years). MCMC, Markov chain Monte Carlo.
Fig 2
Fig 2. Expected titres against strains at different points in antigenic space for a given infection sequence.
(A) Simulated log titres against different strains in antigenic space following a single infection in 1968, with test conducted in 1968. Parameters are drawn from the maximum a posteriori model estimate. Red vertical dashed line shows antigenic location of infecting strain. Black points at the base show location of strains isolated up to this year; grey points show location of strain isolates in subsequent years; black dashed line shows antigenic summary path used to fit model (S1 Fig). (B) Estimated titres along the antigenic summary path (dashed black line in (A)). Red line shows year of infection. (C) Simulated log titres following on single infection in 1968, with test conducted in 1969. (D) Estimated titres along antigenic summary path in 1969. (E) Simulated log titres following infections in 1968 and 1988, with test conducted in 1988. (F) Estimated titres along antigenic summary path in 1988. (G) Simulated log titres following infections in 1968 and 1988, with test conducted in 1989. (H) Estimated titres along antigenic summary path in 1989.
Fig 3
Fig 3. Estimation of influenza A/H3N2 attack rates.
(A) Inference of attack rates using simulated data for 69 participants, with same strains as tested in the Ha Nam data. Main plot: Blue lines show the estimated attack rate with binomial confidence interval; red lines show the attack rates in years when samples were taken; black circles show the true attack rate in the original simulation. Inset: year of circulation for the 57 test strains used, which included repeats in some years. (B) Main: accuracy of attack rate estimates in (A) was high for years in which serological samples were collected (shown as red dots). Hollow black points show the attack rate based on a 2-fold rise in titre against strain in that year (points shown for years 2008–2011, which had sufficient test strains or samples to perform this calculation); solid points show the attack rate based on a 4-fold rise. Inset: distribution of differences between estimated and actual attack rates in same years across 12 simulation studies. Red line indicates estimates from model; dashed black line shows estimates based on a 2-fold rise in titre; solid black line shows estimates based on a 4-fold rise. (C) Proportion of the Vietnam study population estimated to have been infected in each year, based on real data. Blue lines show the estimated attack rate with binomial confidence interval; red lines show attack rates in years when samples were taken. (D) Accuracy of attack rate estimates using different methods. Plot shows model estimates of attack rates in 2008–2012 (red points in (C)) and number of positive H3 isolates reported in Vietnam during the same intervals as the samples were taken. Hollow black points show the attack rate based on a 2-fold rise in titre against strain in that year (point not shown for 2012, as no test strains for this year were available, so a rise could not be calculated); solid points show the attack rate based on a 4-fold rise.

References

    1. Gostic KM, Ambrose M, Worobey M, Lloyd-Smith JO. Potent protection against H5N1 and H7N9 influenza via childhood hemagglutinin imprinting. Science. 2016;354(6313):722–726. 10.1126/science.aag1322 - DOI - PMC - PubMed
    1. Miller E, Hoschler K, Hardelid P, Stanford E, Andrews N, Zambon M. Incidence of 2009 pandemic influenza A H1N1 infection in England: a cross-sectional serological study. The Lancet. 2010;375(1100–1108). - PubMed
    1. Baguelin M, Flasche S, Camacho A, Demiris N, Miller E, Edmunds WJ. Assessing Optimal Target Populations for Influenza Vaccination Programmes: An Evidence Synthesis and Modelling Study. PLoS Med. 2013;10(10). - PMC - PubMed
    1. Ferguson NM, Galvani AP, Bush RM. Ecological and immunological determinants of influenza evolution. Nature. 2003;422:428–433. 10.1038/nature01509 - DOI - PubMed
    1. Jones JC, Baranovich T, Marathe BM, Danner AF, Seiler JP, Franks J, et al. Risk Assessment of H2N2 Influenza Viruses from the Avian Reservoir. J Virol. 2014;88(2):1175–88. 10.1128/JVI.02526-13 - DOI - PMC - PubMed

Publication types

MeSH terms