. 2018 Aug 20;14(8):e1007221.
doi: 10.1371/journal.ppat.1007221. eCollection 2018 Aug.

An EBNA3C-deleted Epstein-Barr virus (EBV) mutant causes B-cell lymphomas with delayed onset in a cord blood-humanized mouse model

Affiliations

An EBNA3C-deleted Epstein-Barr virus (EBV) mutant causes B-cell lymphomas with delayed onset in a cord blood-humanized mouse model

James C Romero-Masters et al. PLoS Pathog. .

Abstract

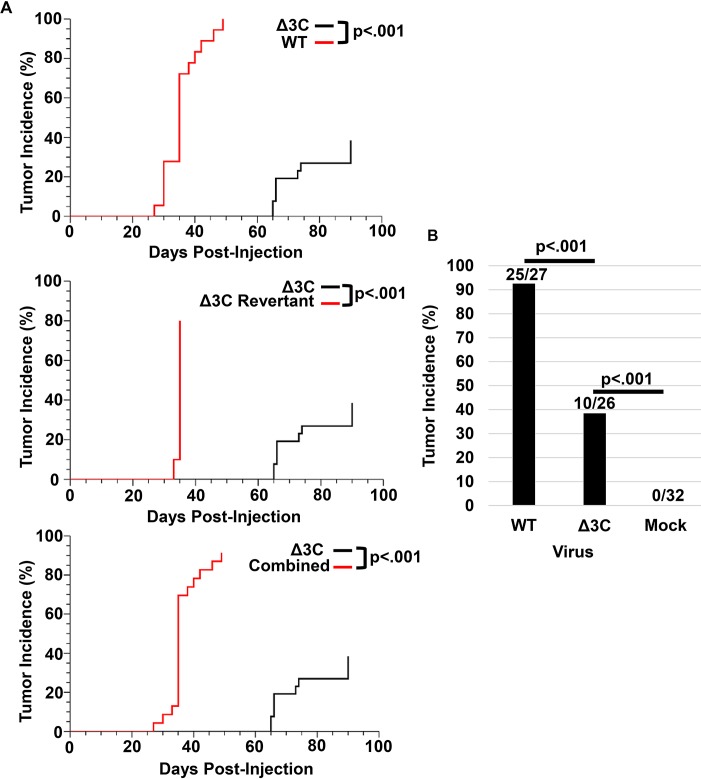
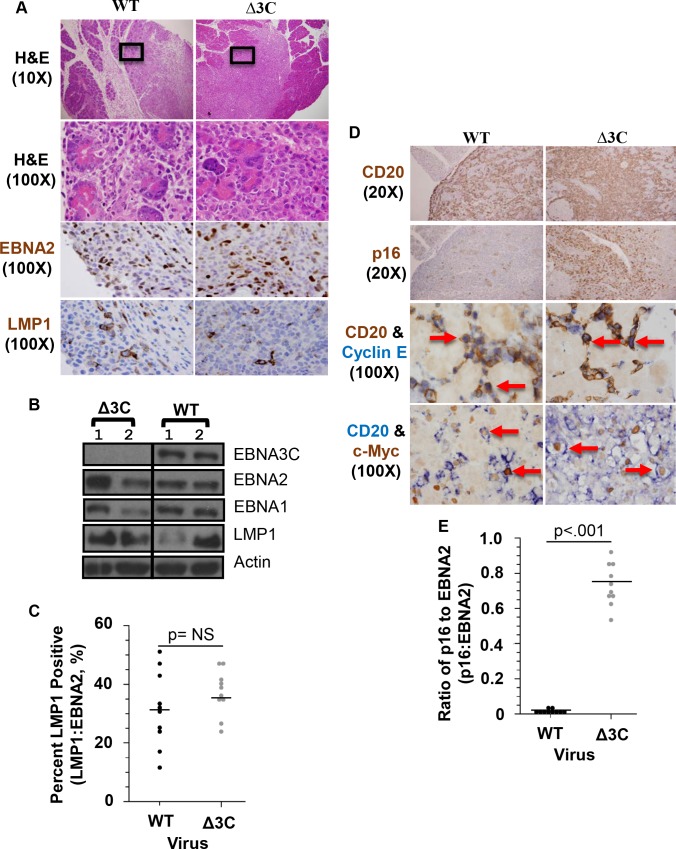
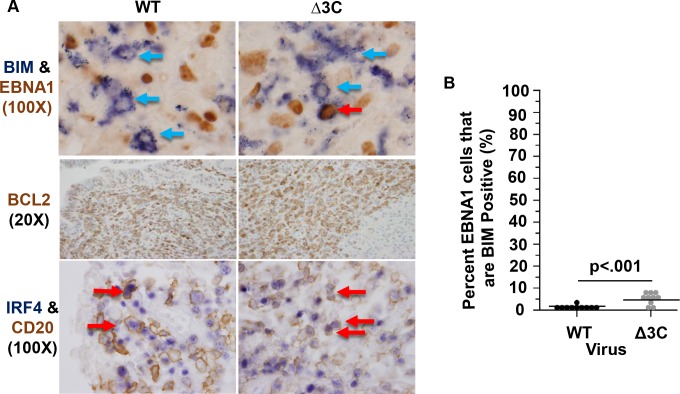
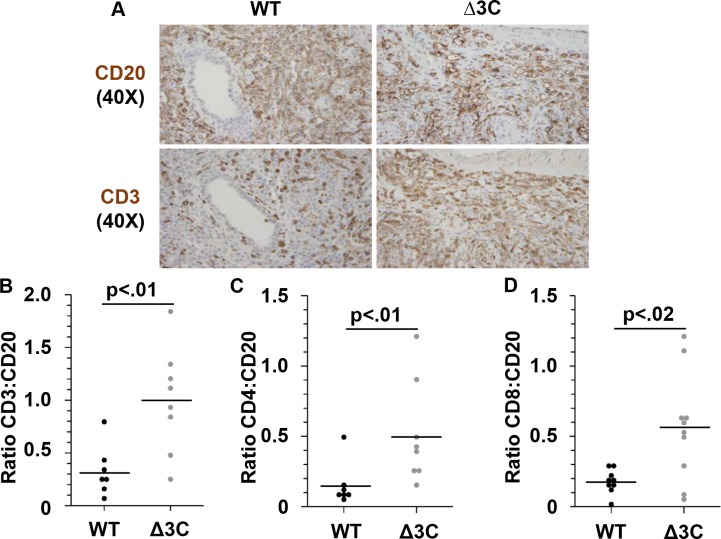
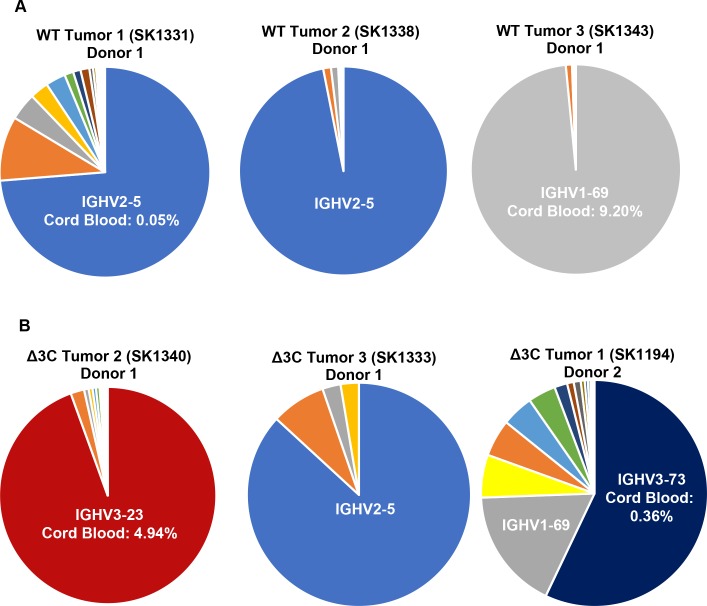
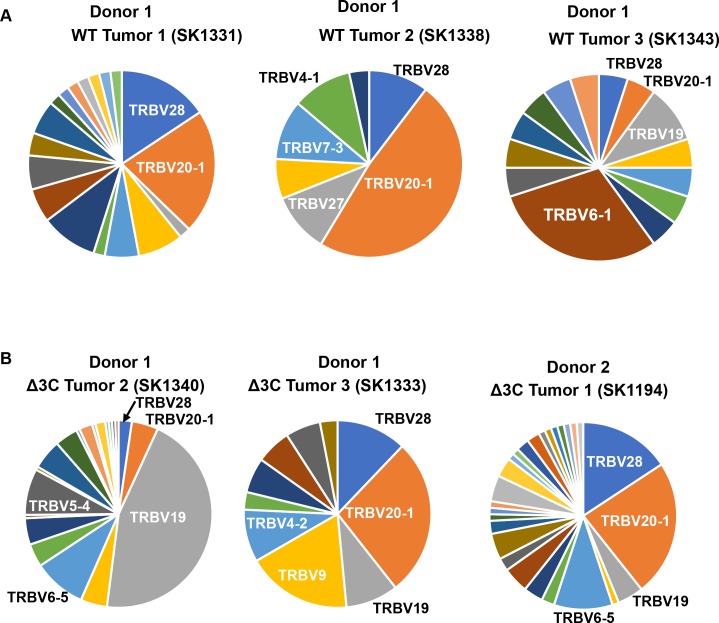
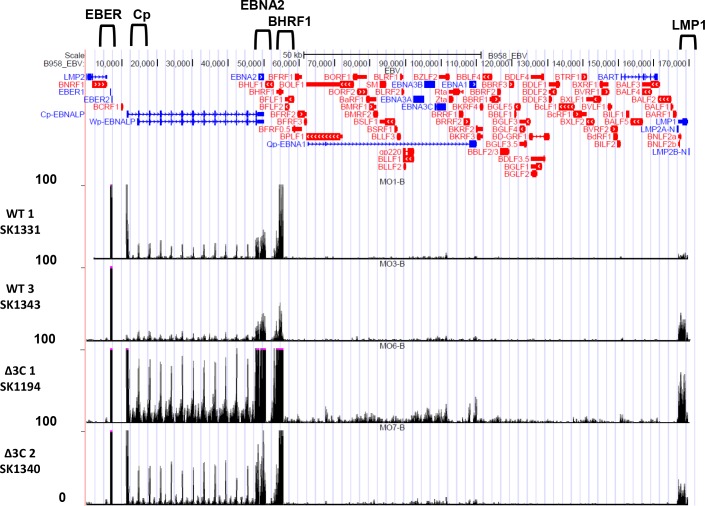
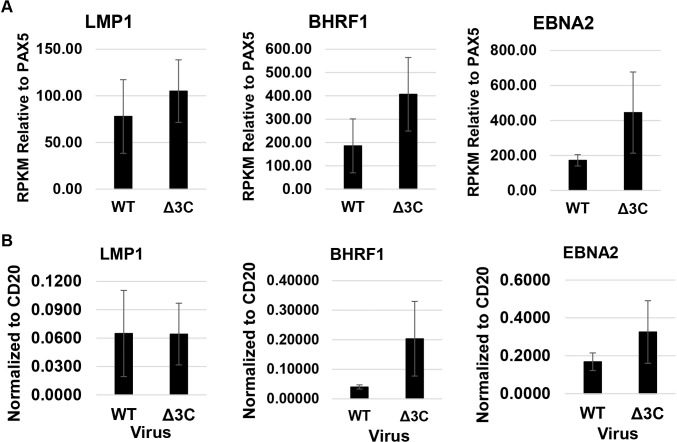
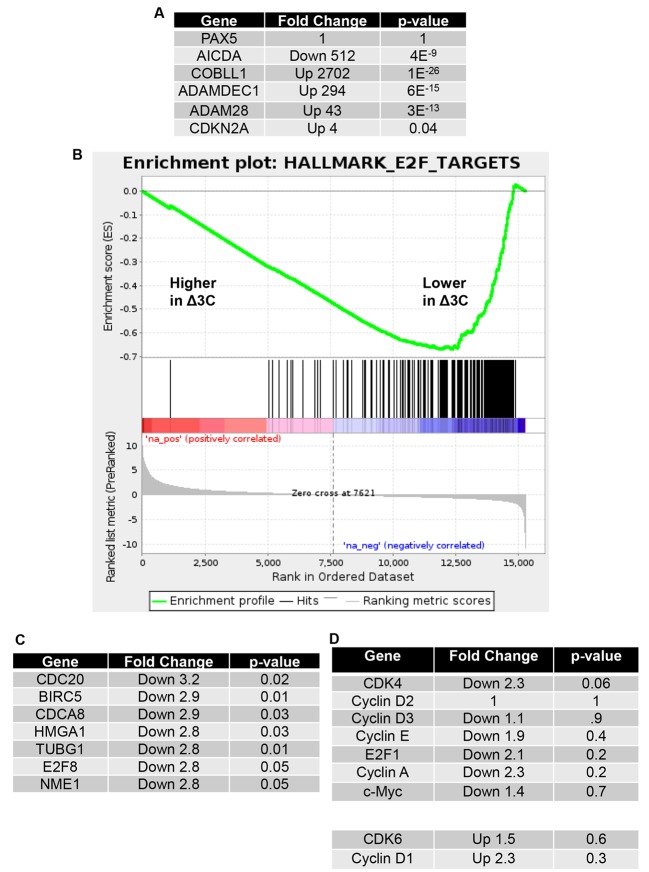
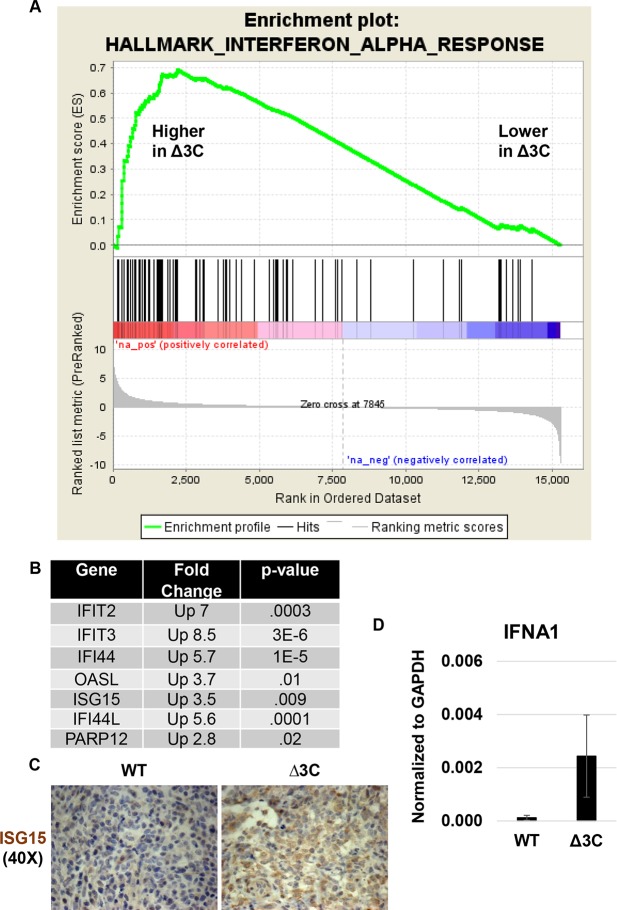
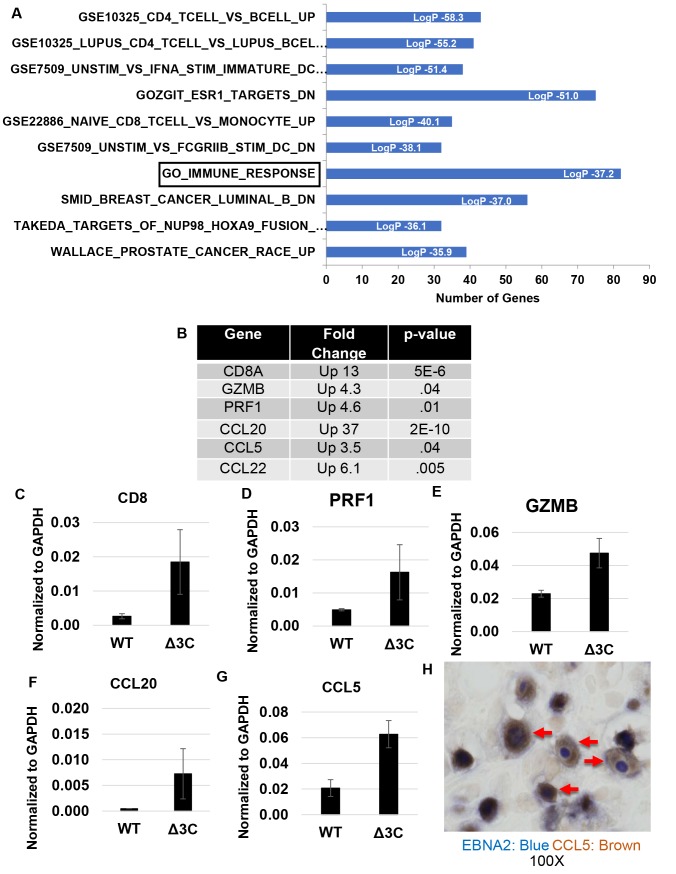
EBV causes human B-cell lymphomas and transforms B cells in vitro. EBNA3C, an EBV protein expressed in latently-infected cells, is required for EBV transformation of B cells in vitro. While EBNA3C undoubtedly plays a key role in allowing EBV to successfully infect B cells, many EBV+ lymphomas do not express this protein, suggesting that cellular mutations and/or signaling pathways may obviate the need for EBNA3C in vivo under certain conditions. EBNA3C collaborates with EBNA3A to repress expression of the CDKN2A-encoded tumor suppressors, p16 and p14, and EBNA3C-deleted EBV transforms B cells containing a p16 germline mutation in vitro. Here we have examined the phenotype of an EBNAC-deleted virus (Δ3C EBV) in a cord blood-humanized mouse model (CBH). We found that the Δ3C virus induced fewer lymphomas (occurring with a delayed onset) in comparison to the wild-type (WT) control virus, although a subset (10/26) of Δ3C-infected CBH mice eventually developed invasive diffuse large B cell lymphomas with type III latency. Both WT and Δ3C viruses induced B-cell lymphomas with restricted B-cell populations and heterogeneous T-cell infiltration. In comparison to WT-infected tumors, Δ3C-infected tumors had greatly increased p16 levels, and RNA-seq analysis revealed a decrease in E2F target gene expression. However, we found that Δ3C-infected tumors expressed c-Myc and cyclin E at similar levels compared to WT-infected tumors, allowing cells to at least partially bypass p16-mediated cell cycle inhibition. The anti-apoptotic proteins, BCL2 and IRF4, were expressed in Δ3C-infected tumors, likely helping cells avoid c-Myc-induced apoptosis. Unexpectedly, Δ3C-infected tumors had increased T-cell infiltration, increased expression of T-cell chemokines (CCL5, CCL20 and CCL22) and enhanced type I interferon response in comparison to WT tumors. Together, these results reveal that EBNA3C contributes to, but is not essential for, EBV-induced lymphomagenesis in CBH mice, and suggest potentially important immunologic roles of EBNA3C in vivo.


Conflict of interest statement

The authors have declared that no competing interests exist.

Figures

Fig 1
Fig 1. EBNA3C-mutant virus (Δ3C) causes lymphomas at reduced efficiency, and with a delayed-onset, in the cord blood-humanized (CBH) mouse model.
(A). The rate and incidence of tumors in animals infected with WT versus Δ3C viruses are shown (upper panel). The rate and incidence of tumors in animals infected with revertant virus versus Δ3C viruses are shown (middle panel). The rate and incidence of tumors in animals infected with either WT or revertant viruses, versus Δ3C virus, are shown (lower panel). A log-rank statistical test was performed to determine statistical significance for the Kaplan-Meier curve analysis. (B) The frequency of EBV-positive tumors in animals infected with wild-type or revertant control viruses (WT), the Δ3C virus, or mock-infected animals, is shown. A two-sided Bernard’s exact test was performed to determine statistical significance of any differences in tumor frequency.
Fig 2
Fig 2. Δ3C virus causes DLBCLS with type III viral latency that express high levels of p16, but still express cyclin E and c-Myc.
(A) Lymphomas invading the pancreas, harvested from CBH mice injected with WT control or Δ3C viruses, are shown. Tissues were formalin-fixed and paraffin-embedded, and then subjected to H&E stain, and IHC staining for EBNA2 (EBV latent protein) and LMP1 (EBV latent protein) on adjacent slides as indicated (WT: SK999 and Δ3C: SK1005). (B) Protein extracts derived from lymphomas infected with WT (SK449R and SK447R) or Δ3C viruses (SK449LR and SK447U) were used to perform immunoblots to detect EBNA3C, EBNA2, EBNA1, LMP1 and actin as indicated. (C) The percent LMP1-positive cells were determined by comparing the total number of LMP1-positive cells versus the total number of EBNA2-positive cells on adjacent slides in 10 tumors infected with either the WT or Δ3C viruses. Wilcoxon rank-sum statistical test (two-sided) was performed. (D) IHC single staining was performed using antibodies against CD20 (B-cell marker), or p16 on adjacent slides (WT: SK999 and Δ3C: SK1005), and co-staining IHC studies were performed using antibodies against cyclin E (purple) and CD20 (brown) (WT: SK1189 and Δ3C: SK1183), or c-Myc (brown) and CD20 (purple) (WT: SK1331 and Δ3C: SK1348), as indicated. Examples of co-staining cells are indicated with arrows. (E) Quantification of the ratio of EBNA2-positive to p16-positive cells in 10 different WT- and Δ3C-infected animals is shown. Wilcoxon rank-sum test was performed. The EBV infected animals used in each image are indicated for each figure and are further detailed in S3 Table.
Fig 3
Fig 3. Δ3C-induced lymphomas express low levels of the pro-apoptotic protein, BIM, and express the pro-survival proteins, BCL2 and IRF4.
(A) IHC co-staining was performed for BIM (purple) and EBNA1 (brown) (WT: SK1331 and Δ3C: SK1348), or CD20 (brown) and IRF4 (purple) (WT: SK1335 and Δ3C: SK1340), as indicated. Representative BIM1/EBNA1 or IRF4/CD20 co-staining is indicated with red arrows and representative BIM+ EBNA1- cells indicated with blue. An example of a BIM+/EBNA1+ cell in a Δ3C-induced lymphoma is indicated. Single staining was performed for BCL2 (WT: SK1193 and Δ3C: SK1183). (B) The number of BIM+, EBNA1+ co-staining cells compared to the total number of EBNA1-positive cells was quantitated in each tumor type. Wilcoxon rank-sum test was performed.
Fig 4
Fig 4. Δ3C virus-induced lymphomas have increased T-cell infiltration of both CD8+ and CD4+ T cells.
(A) IHC staining was performed for CD20 (B-cell marker) and CD3 (total T-cell marker) on adjacent slides (WT: SK1189 and Δ3C: SK1192). Representative images are shown for WT- and Δ3C-infected animals. (B) Quantification of the ratio of CD3+ cells to CD20+ cells in at least 7 different tumors from each condition is shown. (C) Quantification of the ratio of CD4+ cells to CD20+ cells in at least 7 different tumors. (D) Quantification of the ratio of CD8+ cells to CD20+ cells in at least 9 different tumors. Wilcoxon rank-sum test was performed on all quantification analyses.
Fig 5
Fig 5. WT virus- and Δ3C virus-induced lymphomas are derived from a restricted B-cell population.
(A-B) RNA-seq analysis was performed using RNA isolated from 3 different tumors infected with either the WT or Δ3C viruses. The relative frequency of the IGH transcripts containing various different IGHV genes is shown for each tumor; the frequency of the dominant IGHV genes in IGH transcripts of normal cord blood is also indicated.
Fig 6
Fig 6. WT virus and Δ3C virus-induced lymphomas have a heterogeneousT cell response.
(A-B) The frequency of the TRBV gene reads in the RNA-seq analysis of different tumors was determined by comparing the number of reads from each individual TRBV gene to the total number of TRBV gene reads.
Fig 7
Fig 7. EBV genome mapping of RNAseq reads in Δ3C virus- and WT virus-induced lymphomas.
RNA-seq reads were mapped to the EBV genomes of 2 different tumors infected with each virus type. The locations of the Cp promoter, and the EBER, EBNA2, BHRF1 and LMP1 transcripts are indicated above the EBV genome map.
Fig 8
Fig 8. Δ3C virus-induced lymphomas may have increased expression of EBV BHRF1 and EBNA2 transcripts compared to WT virus-induced lymphomas.
(A) The average RPKM values of LMP1, EBNA2, and BHRF1, normalized to the PAX5 (B-cell specific) RPKM value of the same tumor, are shown, along with standard error. (B) qPCR analysis of cDNA generated from tumors was performed to quantitate expression of the LMP1, EBNA2, and latent BHRF1 transcripts, respectively. Results were normalized relative to the level of human CD20 (B-cell specific) transcript in each tumor. Standard error is shown.
Fig 9
Fig 9. Δ3C virus-induced lymphomas have decreased expression of E2F target genes.
RNA was isolated from tumors infected with the WT- or Δ3C virus-induced lymphomas, and RNA-seq performed. Mouse cell transcripts were removed from further analysis, and the levels of human genes in each tumor type was compared as described in the methods. (A). The relative level of cellular gene transcripts in EBNA3C-infected tumors, versus WT virus-infected tumors is shown for PAX5 (a B cell-specific gene), and known EBNA3C target genes. The fold-change in cellular gene expression in EBNA3C-infected tumors versus WT infected tumors is indicated, as well as the p-value for each difference. (B). A gene set enrichment analysis (GSEA) plot for the “Hallmark_E2F_Targets” gene set is shown in Δ3C virus-induced lymphomas compared to WT virus-infected lymphomas. (C). The most downregulated genes in the “Hallmark_E2F_Targets” gene set are shown, along with the fold-change in Δ3C virus–infected versus WT virus-infected cells, and the associated p-value. (D). The relative expression levels of genes encoding proteins important for activation of cell cycle progression are compared in Δ3C virus–infected versus WT virus-infected tumors, and the p-value for differences indicated.
Fig 10
Fig 10. Δ3C virus-induced lymphomas have a gene expression signature suggestive increased type 1 Interferon signaling.
(A). GSEA enrichment plot for the “Hallmark_Interferon_Alpha_Respsonse” gene set is shown. (B). Examples of genes in the “Hallmark_Interferon_Alpha_Respsonse” gene set that are of highly upregulated in the Δ3C virus–infected lymphomas relative to the WT virus-infected lymphomas are shown, and p-values are indicated. (C). IHC analysis using antibody targeting ISG15 is shown in tumors infected with the Δ3C virus or WT virus as indicated. (WT: SK1331 and Δ3C: SK1340) (D). qPCR analysis of cDNA generated from tumors was performed to quantitate expression of the human IFNA1 gene (using human specific primers) in WT virus- and Δ3C virus-induced lymphomas. Results were normalized to the level of GAPDH transcript. Standard error is shown.
Fig 11
Fig 11. Δ3C virus-induced lymphomas have a signature suggestive of increased T-cell infiltration, and have increased expression of T-cell chemokine genes.
(A). Molecular signature pathway analysis of RNA-seq results obtained from Δ3C virus-induced lymphomas versus WT virus-induced lymphomas is shown. (B). Examples of genes included in the “GO_Immune_Response” gene set (boxed in Fig 10A) that are of highly upregulated in the Δ3C virus–infected lymphomas relative to the WT virus-infected lymphomas are shown, and p-values are indicated. (C-G). qPCR was performed using cDNA isolated from Δ3C virus-induced lymphomas versus WT virus-infected lymphomas, using human specific primers to amplify genes shown in Fig 10B. Results were normalized to the level of GAPDH transcript. Standard error is shown. (H). IHC analysis using antibodies against EBNA2 (purple) and CCL5 (brown) in Δ3C virus-induced lymphomas was performed (Δ3C: SK1348). Examples of co-staining cells are indicated with arrows.

References

    1. Johannsen EC, Kaye KM. Epstein-Barr (infectious mononucleosis, Epstein-Barr virus-associated malignant diseases, and other diseases). Princ Pract Infect Dis. 2014;2: 1989–2010. 10.1016/B978-1-4557-4801-3.00141–7 - DOI
    1. Thorley-Lawson DA. EBV Persistence—Introducing the Virus. Curr Top Microbiol Immunol. 2015;390: 151–209. 10.1007/978-3-319-22822-8_8 - DOI - PMC - PubMed
    1. Kenney SC, Mertz JE. Regulation of the latent-lytic switch in Epstein-Barr virus. Semin Cancer Biol. 2014;26: 60–68. 10.1016/j.semcancer.2014.01.002 - DOI - PMC - PubMed
    1. Shannon-Lowe C, Rickinson AB, Bell AI. Epstein-Barr virus-associated lymphomas. Philos Trans R Soc Lond B Biol Sci. 2017;372 10.1098/rstb.2016.0271 - DOI - PMC - PubMed
    1. Young LS, Dawson CW. Epstein-Barr virus and nasopharyngeal carcinoma. Chin J Cancer. 2014;33: 581–590. 10.5732/cjc.014.10197 - DOI - PMC - PubMed

Publication types

MeSH terms

Substances