. 2018 Aug 20;14(8):e1007153.
doi: 10.1371/journal.ppat.1007153. eCollection 2018 Aug.

The C. difficile clnRAB operon initiates adaptations to the host environment in response to LL-37

Affiliations

The C. difficile clnRAB operon initiates adaptations to the host environment in response to LL-37

Emily C Woods et al. PLoS Pathog. .

Abstract

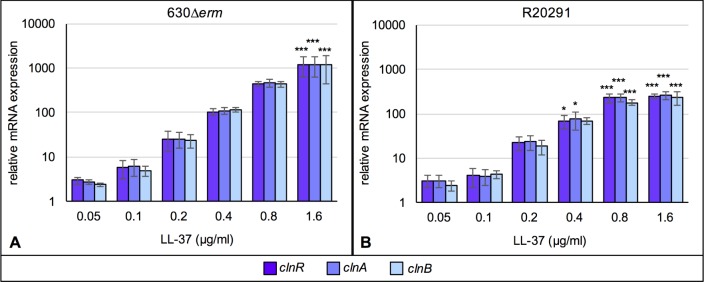
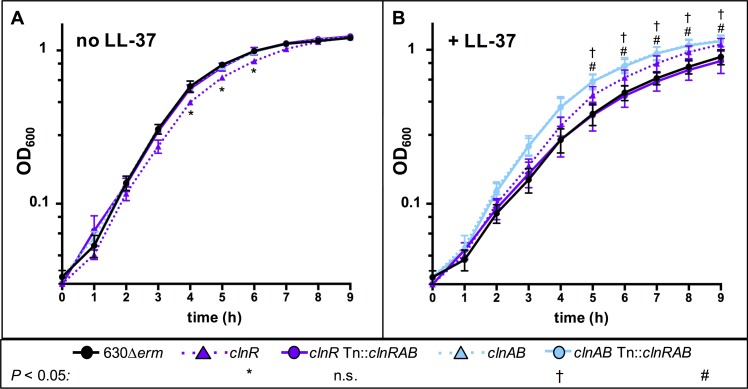
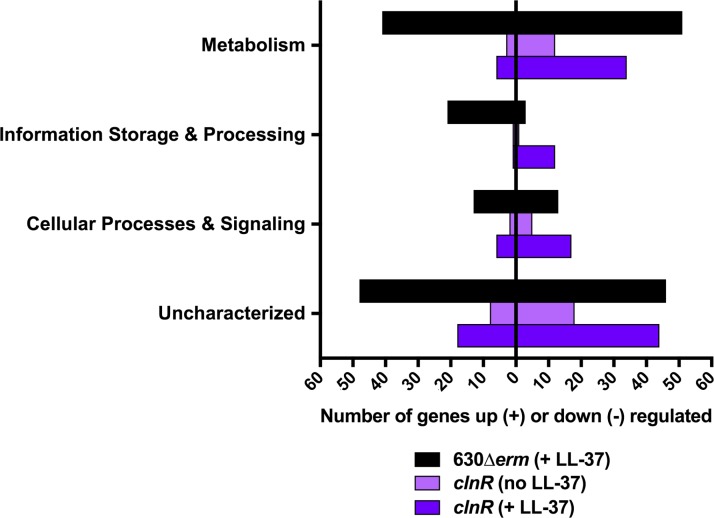
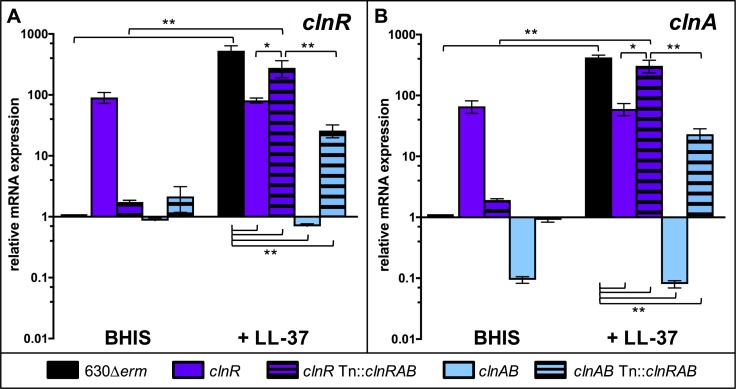
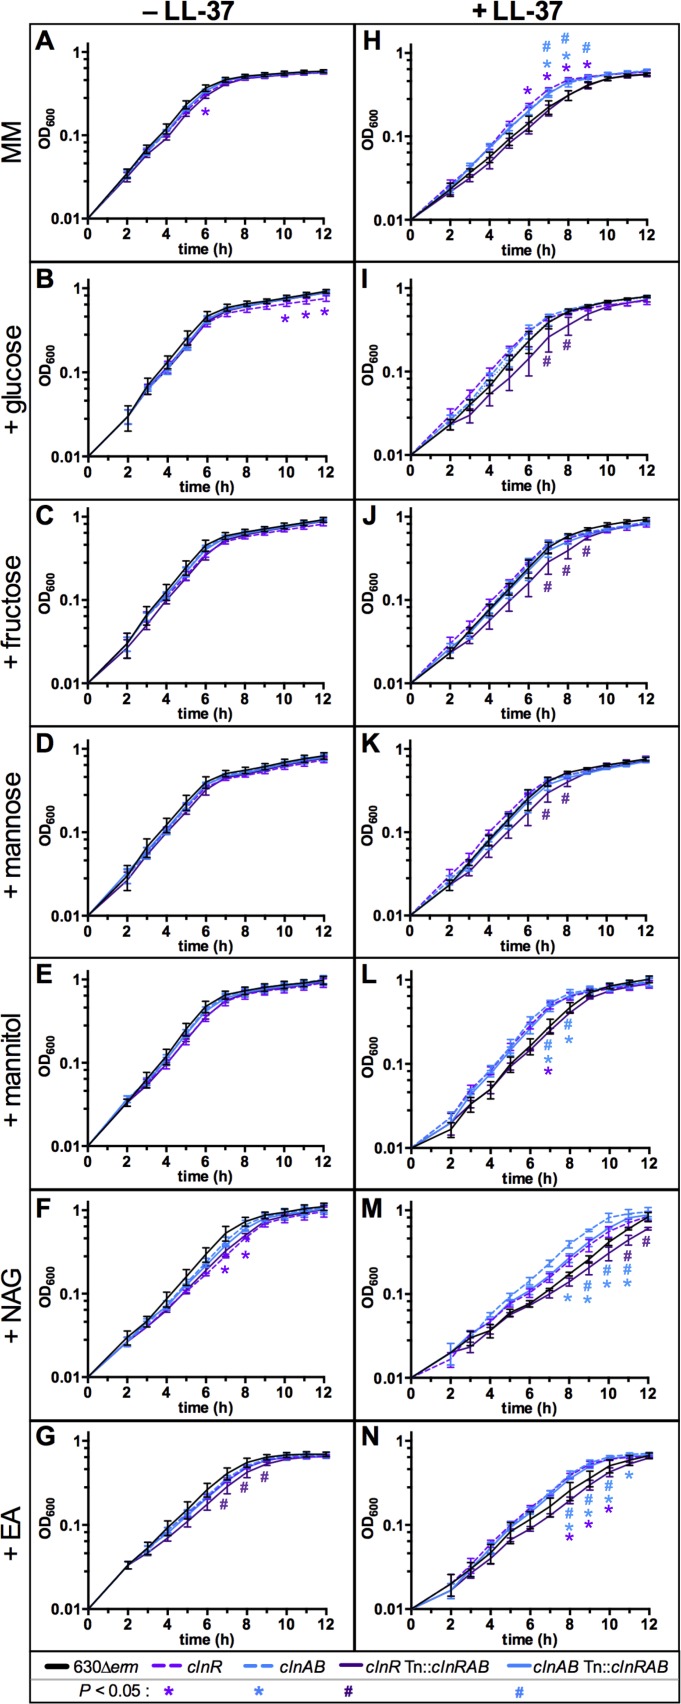
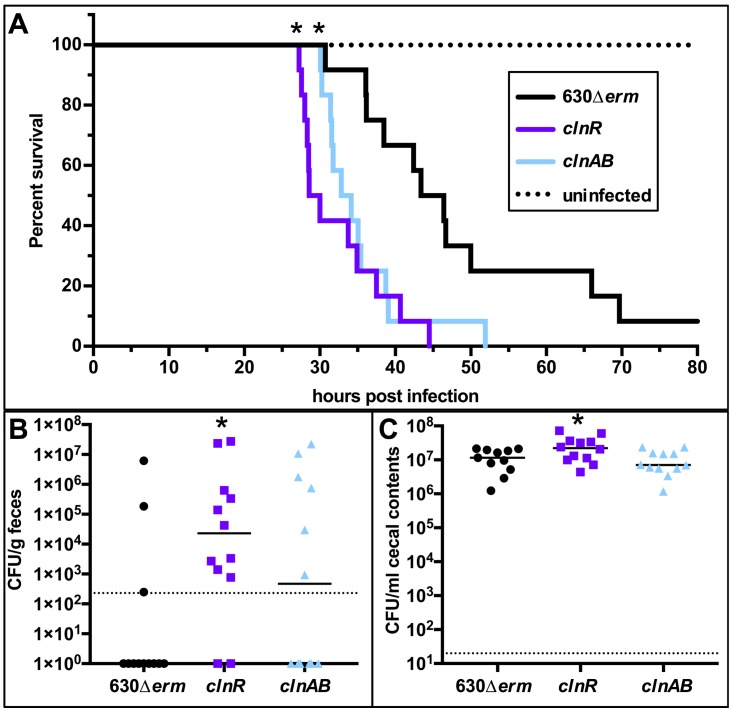
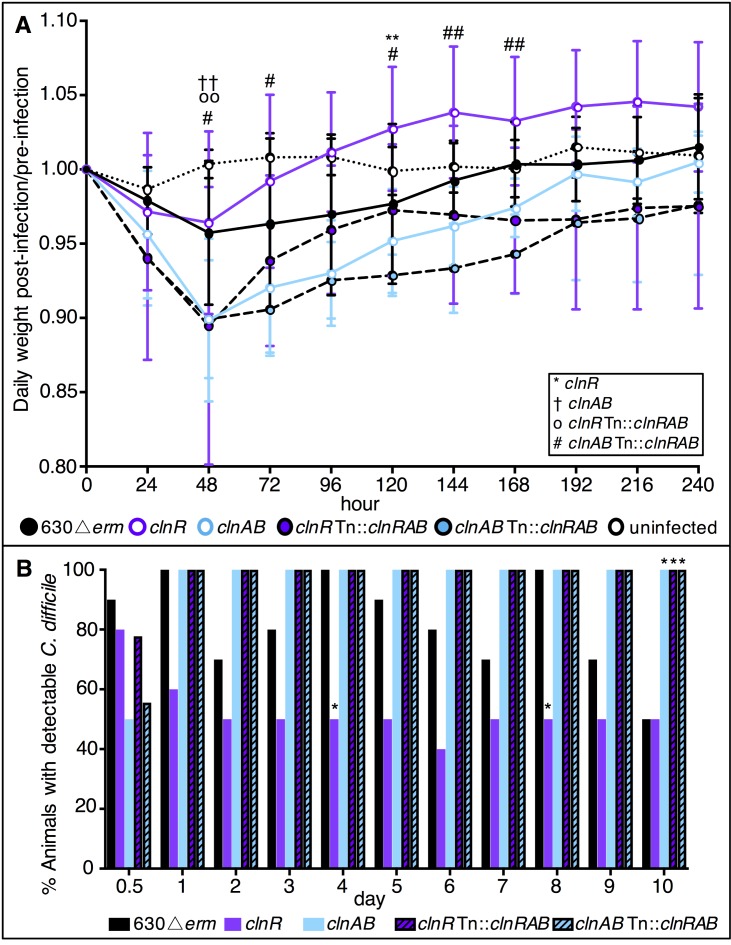
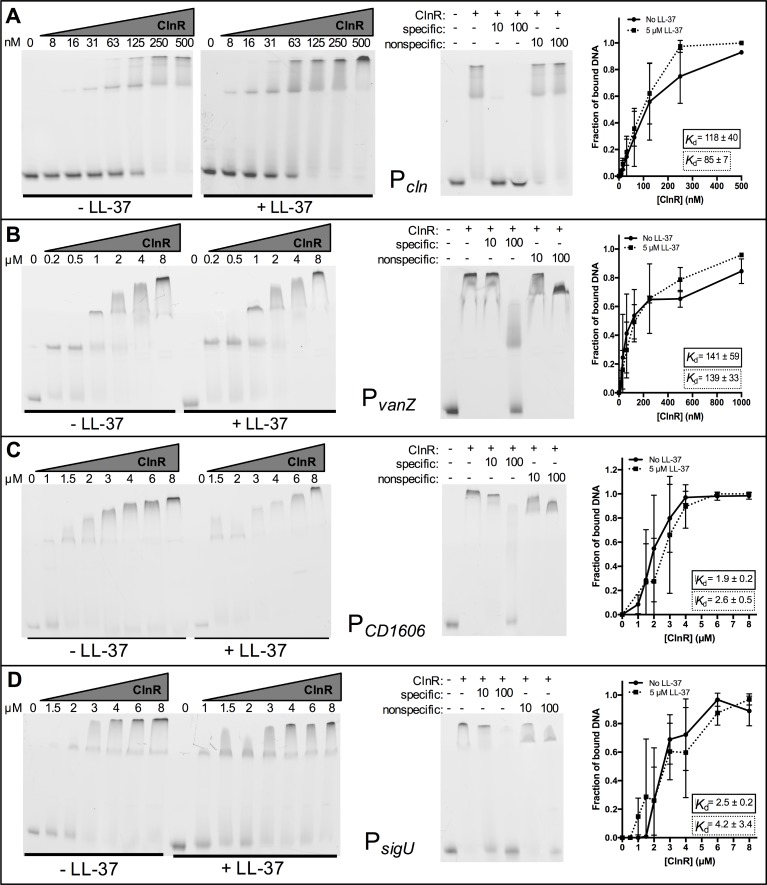
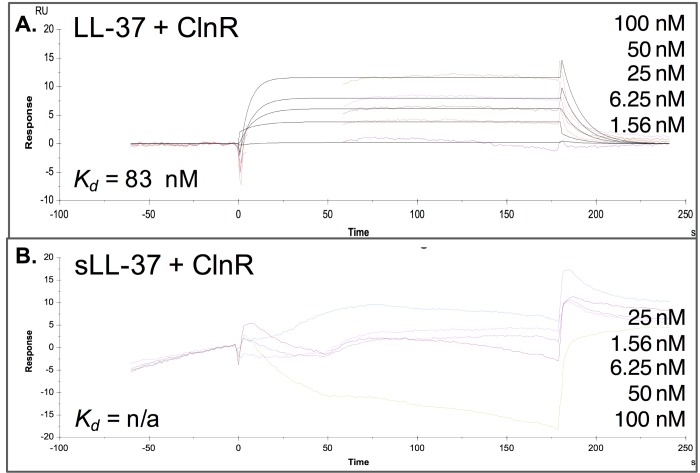
To cause disease, Clostridioides (Clostridium) difficile must resist killing by innate immune effectors in the intestine, including the host antimicrobial peptide, cathelicidin (LL-37). The mechanisms that enable C. difficile to adapt to the intestine in the presence of antimicrobial peptides are unknown. Expression analyses revealed an operon, CD630_16170-CD630_16190 (clnRAB), which is highly induced by LL-37 and is not expressed in response to other cell-surface active antimicrobials. This operon encodes a predicted transcriptional regulator (ClnR) and an ABC transporter system (ClnAB), all of which are required for function. Analyses of a clnR mutant indicate that ClnR is a pleiotropic regulator that directly binds to LL-37 and controls expression of numerous genes, including many involved in metabolism, cellular transport, signaling, gene regulation, and pathogenesis. The data suggest that ClnRAB is a novel regulatory mechanism that senses LL-37 as a host signal and regulates gene expression to adapt to the host intestinal environment during infection.


Conflict of interest statement

The authors have declared that no competing interests exist.

Figures

Fig 1
Fig 1. Expression of CD630_16170-CD630_16190 is induced by LL-37 in a dose-dependent manner.
Active cultures of A) 630Δerm and B) R20291 were grown in BHIS or BHIS with 0.05, 0.1, 0.2, 0.4, 0.8 or 1.6 μg/ml LL-37. Samples were harvested, cDNA generated, and qRT-PCR performed as described in Methods. mRNA levels are normalized to expression levels in BHIS alone. Bars represent the mean and standard deviation for at least three biological replicates. Expression levels of each gene were analyzed by one-way ANOVA and Dunnett’s multiple comparisons test, comparing to expression without LL-37. Adjusted p values indicated by * ≤ 0.05, ** ≤ 0.01, *** ≤ 0.001.
Fig 2
Fig 2. Growth of clnR and clnAB mutants with and without LL-37.
Active cultures of 630Δerm (black circles), clnR (MC885; purple triangles), clnR Tn::clnRAB (MC950; purple circles), clnAB (MC935; blue triangles), clnAB Tn::clnRAB (MC953; blue circles) were diluted to an OD600 of 0.05 in A) BHIS alone or B) BHIS with 2.5 μg/ml LL-37. Graphs represent the means +/- SEM from three independent replicates. Data were analyzed by two-way ANOVA with Dunnett’s multiple comparisons test, comparing to 630Δerm at the same time point. * † # indicate adjusted p < 0.05 for individual strains, as indicated; ns: not significant.
Fig 3
Fig 3. LL-37 and ClnR impact global gene expression.
The genes listed in S1 Table (black) and S4 Table (light and dark purple) were assigned COG classifications according to the 2014 COG database. COG classifications were then grouped according to broader functions of Metabolism (COG classes C, E, F, G, H, I, P, and Q), Information Storage & Processing (COG classes A, B, J, K, and L), Cellular Processes & Signaling (COG classes D, M, N, O, T, U, V, W, Y, and Z), and Uncharacterized (COG classes R and S, or unassigned). Genes with functions that fall within two different groups are represented within both of the groups.
Fig 4
Fig 4. ClnR acts as a conditional repressor and inducer of clnRAB expression.
Cultures of 630Δerm, clnR (MC885), clnR Tn::clnRAB (MC950), clnAB (MC935), and clnAB Tn::clnRAB (MC953) were grown in BHIS alone or BHIS with 2 μg/ml LL-37. RNA samples were collected and processed for qRT-PCR analysis as described in Methods. Graphs show the mean mRNA expression levels of A) clnR and B) clnA relative to expression in strain 630Δerm in BHIS alone. Error bars represent the standard error of the mean from at least three independent experiments. Data were analyzed by two-way ANOVA and Tukey’s multiple comparisons test, with comparisons indicated by brackets. * indicates p < 0.05, ** indicates p ≤ 0.0001.
Fig 5
Fig 5. ClnR and LL-37 regulate the metabolism of nutrients.
Active cultures of strain 630Δerm (black), the clnR mutant (MC885, light purple), the clnAB mutant (MC935, light blue), clnR Tn::clnRAB (MC950, dark purple), and clnAB Tn::clnRAB (MC953, dark blue) were diluted to an OD600 in 0.01 in minimal media (MM) either without (A-G) or with (H-N) 0.5 μg/ml LL-37. Base minimal media (A, H) or MM supplemented with 30 mM glucose (B, I), 30 mM fructose (C, J), 30 mM mannose (D, K), 30 mM mannitol (E, L), 30 mM N-acetylglucoseamine (NAG) (F, M), or 30 mM ethanolamine (EA) (G, N). Graphs are plotted as the means +/- SEM from three independent replicates. Data were analyzed by two-way ANOVA with Dunnett’s multiple comparison test, comparing to 630Δerm at each time point. Adjusted p value < 0.05 indicated by the symbols in the legend.
Fig 6
Fig 6. clnR and clnAB mutants are more virulent in a hamster model of infection.
Syrian golden hamsters were inoculated with approximately 5000 spores of strain 630Δerm (n = 12), clnR (MC885; n = 12), or clnAB (MC935; n = 12). A) Kaplan-Meier survival curve depicting time to morbidity. Mean times to morbidity were: 630Δerm 46.0 ± 12.2 (n = 11); clnR 32.5 ± 5.8 (n = 12); clnA 35.2 ± 6.1 (n = 12). * indicates p ≤ 0.01 by log-rank test. B) Total C. difficile CFU recovered from fecal samples collected at 12 h.p.i. Dotted line demarcates lowest limit of detection. Solid black line marks the median. Fisher’s exact test compared the number of animals without and with detectable CFU compared to 630Δerm (* indicates p < 0.05). C) Total C. difficile CFU recovered from cecal contents collected post-mortem. Dotted line demarcates limit of detection. Solid black line marks the median. Numbers of CFU are compared to 630Δerm by one-way ANOVA with Dunnett’s multiple comparisons test (* indicates p < 0.05).
Fig 7
Fig 7. Mice infected with a clnR mutant recover more quickly.
C57BL/6 mice were inoculated with approximately 1 x 10⁵ spores of 630Δerm (n = 10), clnR (MC885; n = 10), clnAB (MC935; n = 10), clnR Tn::clnRAB (MC950; n = 9), or clnAB Tn::clnRAB (MC953; n = 9) as detailed in Methods. A) Daily weights were calculated relative to the animal’s starting weight. Graph shows the mean ± SEM. Data were analyzed by two-way ANOVA with Dunnett’s multiple comparisons test, comparing each strain to 630Δerm. See legend for significance symbol key. One symbol indicates adjusted p value <0.05, two symbols indicates p <0.002. B) The percentage of animals with detectable CFU in their feces (Days 0.5–9) or cecal contents (Day 10). Data were analyzed by one-way ANOVA with Dunnett’s multiple comparisons test comparing each strain to 630Δerm at the same time point. * indicates adjusted p value <0.05.
Fig 8
Fig 8. ClnR directly and specifically binds several DNA targets.
Electrophoretic mobility shift assays were performed as described in Methods using His-tagged ClnR and fluorescein-labeled DNA encompassing regions upstream of A) clnR, B) vanZ, C) CD1606, or D) sigU. ClnR was added to reactions at varying concentrations (specified in nM in A, in μM elsewhere) either without or with 0.5 μM LL-37, as indicated. Competitive EMSAs were performed with the addition of unlabeled target DNA (specific) or unlabeled Pspo0A DNA (non-specific) at either 10x or 100x the concentration of labeled target DNA. 125 nM ClnR was used for the competitive EMSA for Pcln, 8 μM for all others. Apparent Kd values were calculated as described in Methods. Graphs are the binding curves showing the mean and standard deviation from three independent replicates.
Fig 9
Fig 9. ClnR binds specifically to LL-37.
Kinetic analysis of ClnR-LL-37 binding. Surface Plasmon Resonance (SPR) sensorgram quantifying binding of His-ClnR to immobilized A) LL-37 or B) scrambled LL-37 (sLL-37; negative control) measured as the relative response in resonance units (RU) after reference background subtraction. The concentrations of His-ClnR applied are listed in their order on the graphs, respectively. Affinity modeling (1:1) was used to calculate the dissociation constant for binding. LL-37-ClnR: Kd = 83 ± 14 nM; sLL-37-ClnR: no significant binding detected.

Similar articles

Cited by

References

    1. Lessa FC, Mu Y, Bamberg WM, Beldavs ZG, Dumyati GK, Dunn JR, et al. Burden of Clostridium difficile infection in the United States. N Engl J Med. 2015;372(9):825–34. 10.1056/NEJMoa1408913 . - DOI - PMC - PubMed
    1. Postma N, Kiers D, Pickkers P. The challenge of Clostridium difficile infection: Overview of clinical manifestations, diagnostic tools and therapeutic options. Int J Antimicrob Agents. 2015. 10.1016/j.ijantimicag.2015.11.001 . - DOI - PubMed
    1. Borriello SP. The influence of the normal flora on Clostridium difficile colonisation of the gut. Ann Med. 1990;22(1):61–7. . - PubMed
    1. Rolfe RD, Helebian S, Finegold SM. Bacterial interference between Clostridium difficile and normal fecal flora. J Infect Dis. 1981;143(3):470–5. . - PubMed
    1. Peschel A, Sahl HG. The co-evolution of host cationic antimicrobial peptides and microbial resistance. Nat Rev Microbiol. 2006;4(7):529–36. Epub 2006/06/17. 10.1038/nrmicro1441 . - DOI - PubMed

Publication types

Substances

LinkOut - more resources