Randomized Controlled Trial
. 2019 Feb;105(2):388-401.
doi: 10.1002/cpt.1219. Epub 2018 Oct 9.

Pharmacokinetics-Pharmacodynamics of High-Dose Ivermectin with Dihydroartemisinin-Piperaquine on Mosquitocidal Activity and QT-Prolongation (IVERMAL)

Affiliations
Randomized Controlled Trial

Pharmacokinetics-Pharmacodynamics of High-Dose Ivermectin with Dihydroartemisinin-Piperaquine on Mosquitocidal Activity and QT-Prolongation (IVERMAL)

Menno R Smit et al. Clin Pharmacol Ther. 2019 Feb.

Abstract

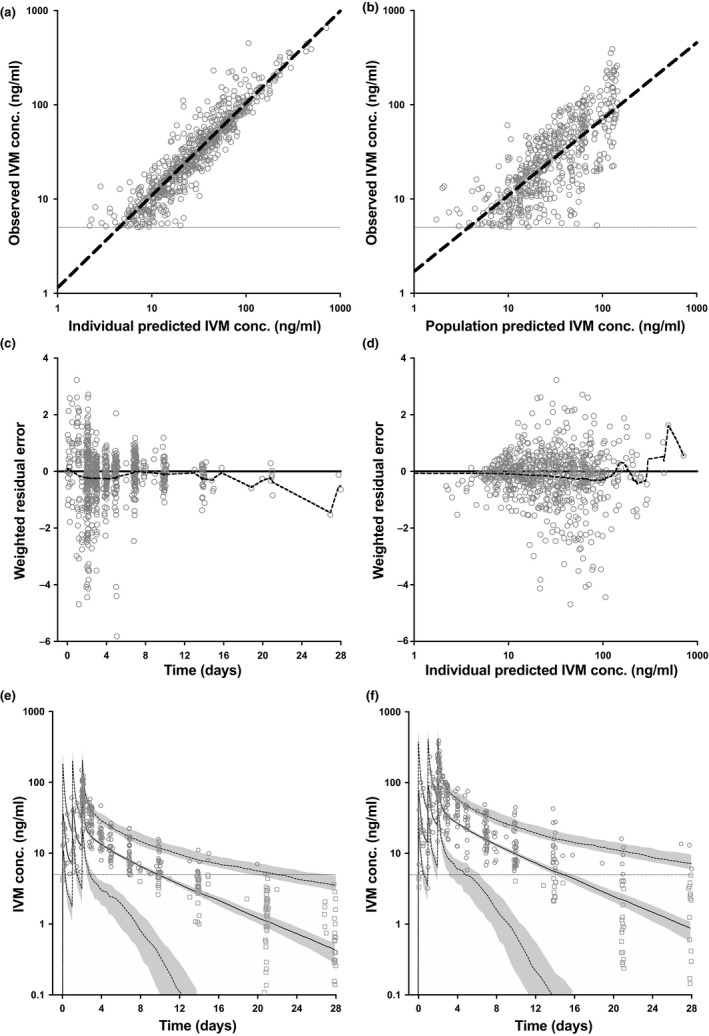
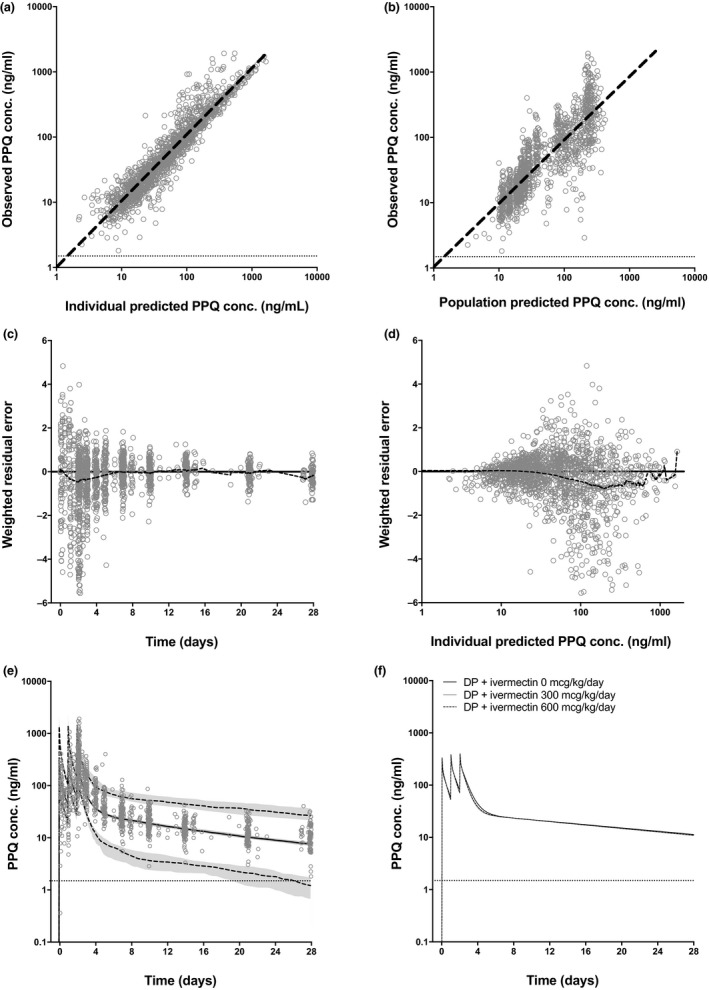
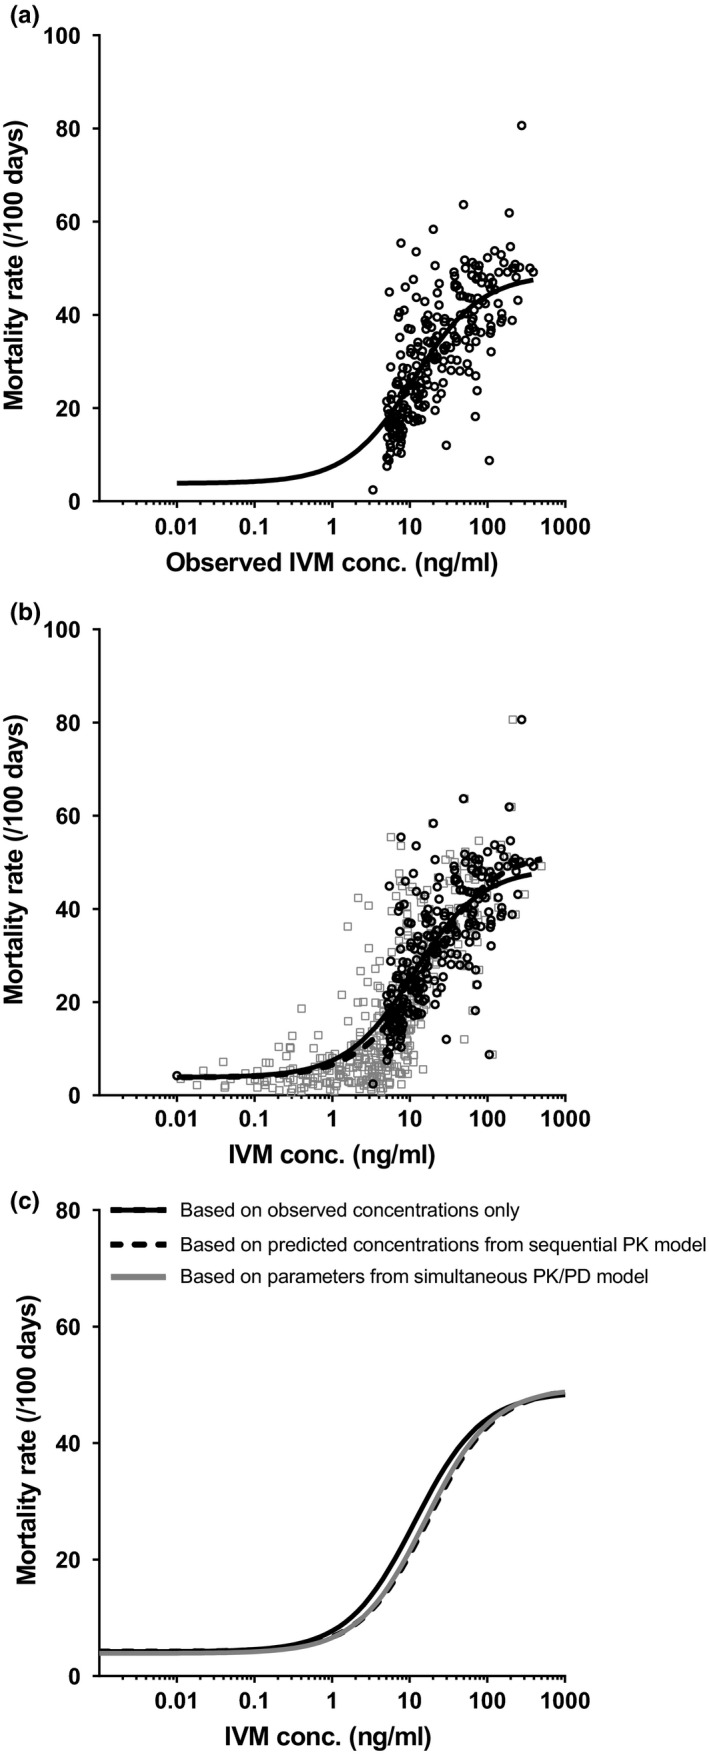
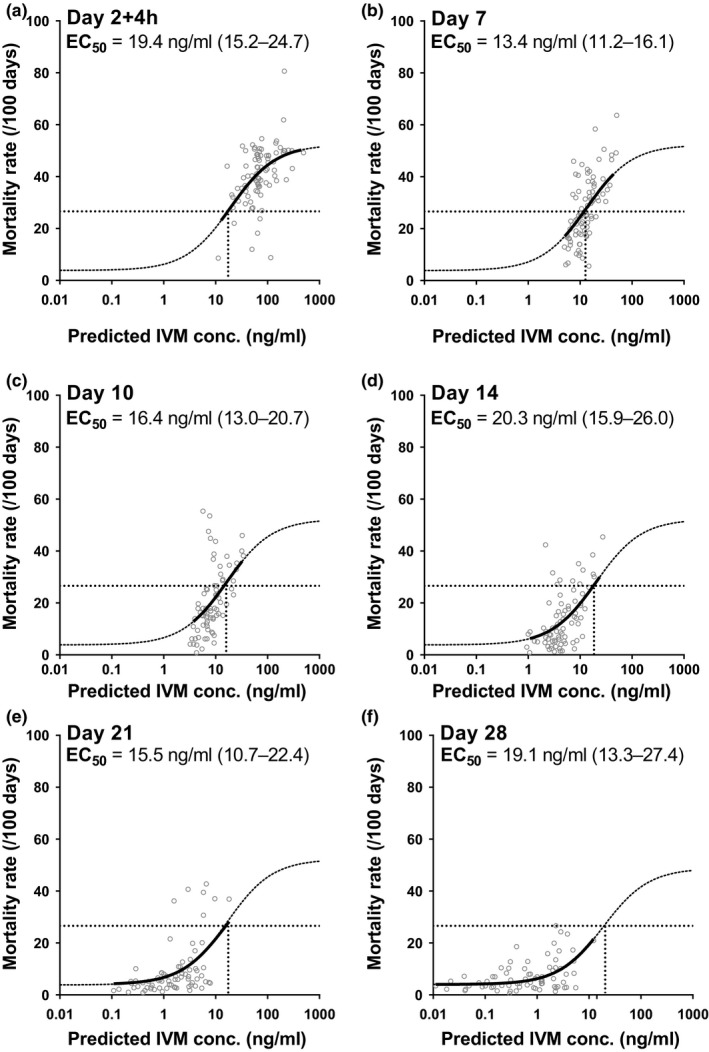
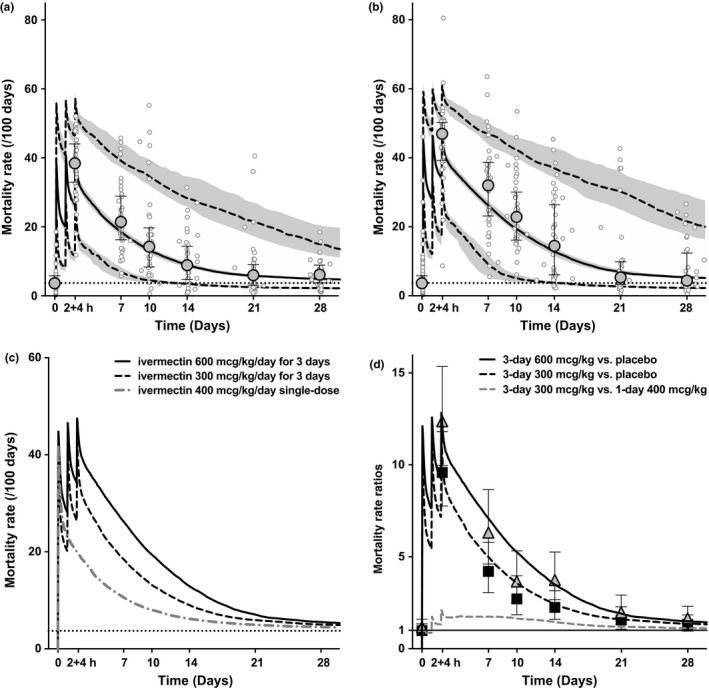
High-dose ivermectin, co-administered for 3 days with dihydroartemisinin-piperaquine (DP), killed mosquitoes feeding on individuals for at least 28 days posttreatment in a recent trial (IVERMAL), whereas 7 days was predicted pretrial. The current study assessed the relationship between ivermectin blood concentrations and the observed mosquitocidal effects against Anopheles gambiae s.s. Three days of ivermectin 0, 300, or 600 mcg/kg/day plus DP was randomly assigned to 141 adults with uncomplicated malaria in Kenya. During 28 days of follow-up, 1,393 venous and 335 paired capillary plasma samples, 850 mosquito-cluster mortality rates, and 524 QTcF-intervals were collected. Using pharmacokinetic/pharmacodynamic (PK/PD) modeling, we show a consistent correlation between predicted ivermectin concentrations and observed mosquitocidal-effects throughout the 28-day study duration, without invoking an unidentified mosquitocidal metabolite or drug-drug interaction. Ivermectin had no effect on piperaquine's PKs or QTcF-prolongation. The PK/PD model can be used to design new treatment regimens with predicted mosquitocidal effect. This methodology could be used to evaluate effectiveness of other endectocides.


Conflict of interest statement

The authors declared no competing interests for this work.

Figures

Figure 1
Figure 1
Ivermectin pharmacokinetic model (sequential approach) using venous and capillary concentrations: goodness‐of‐fit and simulation. (a) Ivermectin individual predicted concentrations (n = 1,029) vs. observed concentrations (n = 708) (slope = 0.98, R 2 = 0.8652). (b) Ivermectin population predicted concentrations vs. observed concentrations (slope = 0.81, R 2 = 0.5793). (c) Weighted residual error distribution of predicted vs. observed ivermectin concentrations over time (mean = −0.23 over 28 days) (dashed black line = locally weighted scatterplot smoothing (LOESS) curve fit through residuals). (d) Weighted residual error distribution of predicted vs. observed ivermectin concentrations over predicted ivermectin concentration (mean = −0.23 over a range of 1–353 ng/mL; dashed black line = LOESS curve fit through residuals). (e) Observed ivermectin venous concentrations (gray circles) with predicted concentrations for those unobserved (gray squares), overlaid with simulation of ivermectin 300 mcg/kg/day for 3 days (solid black line = median; dashed gray lines = 5% and 95% percentiles; shaded gray area = 95% confidence interval for the percentiles). (f) Similar to e with ivermectin 600 mcg/kg/day for 3 days. IVM, ivermectin; conc., concentration; lower limit of quantification, 5 ng/mL (horizontal gray line). Simulations included 1,000 individuals of 60 kg bodyweight.
Figure 2
Figure 2
Piperaquine pharmacokinetic model using venous and capillary concentrations: goodness‐of‐fit and simulation. (a) Piperaquine individual predicted concentrations (n = 1,581) vs. observed concentrations (n = 1,578; slope = 1.04, R 2 = 0.9273). (b) Piperaquine population predicted concentrations vs. observed concentrations (slope = 0.93, R 2 = 0.8332). (c) Weighted residual error distribution of predicted vs. observed piperaquine concentrations over time (mean = −0.23 over 28 days; dashed black line = locally weighted scatterplot smoothing (LOESS) curve fit through residuals). (d) Weighted residual error distribution of predicted vs. observed piperaquine concentrations over predicted ivermectin concentration (mean = −0.20 over a range of 2–1,421 ng/mL; dashed black line = LOESS curve fit through residuals) (e) Observed piperaquine venous concentrations (gray circles) overlaid with simulation of piperaquine 960 mg/day for 3 days (solid black line = median; dashed gray lines = 5% and 95% percentiles; shaded gray area = 95% confidence interval for the percentiles). (f) Simulation of piperaquine 960 mg/day for 3 days based on parameters derived from patients concomitantly receiving ivermectin 0 mcg/kg/day (solid black line), ivermectin 300 mcg/kg/day (solid gray line) or ivermectin 600 mcg/kg/day (black dashed line). Conc., concentration; DP, dihydroartemisinin‐piperaquine; lower limit of quantification, 1.5 ng/mL (horizontal gray line); PPQ, piperaquine. Simulations included 1,000 individuals of 60 kg bodyweight.
Figure 3
Figure 3
(a) Relationship between observed ivermectin venous concentration and mosquito mortality rate (/100 days). Open circles (n = 246 concentrations above lower limit of quantification (LLOQ) with paired mortality rate) represent observed data. The solid line represents sigmoidal three‐parameter maximum effect (Emax) fit. (b) Similar to a, however, now overlaid with predicted ivermectin venous concentrations for all samples (including those that were below LLOQ) with observed mosquito mortality rates in patients that received ivermectin (gray squares, n = 567). The dashed line represents the sigmoidal three‐parameter Emax fits for the predicted concentrations. (c) A comparison between the exposure relationship of a, b, and the exposure‐effect relationship generated using the simultaneous pharmacokinetic/pharmacodynamic (PK/PD) model, which incorporated PD data in the process of PK modeling and vice versa. IVM, ivermectin; conc., concentration.
Figure 4
Figure 4
The exposure‐effect relationship between predicted ivermectin (IVM) concentrations (from the sequential pharmacokinetic (PK) model, using PK data from all days) and corresponding observed mosquito mortality rates separated by day of analysis after initiation of treatment. Minimum effect (Emin) and maximum effect (Emax) were fixed to the values determined by analyzing the entire dataset and half‐maximal effective concentration (EC50) concentrations (95% confidence intervals) were estimated as shown in the figure.
Figure 5
Figure 5
Ivermectin pharmacokinetic (PK) and pharmacodynamic (PD) simulation of mosquito mortality rate (using simultaneous approach) with (a) 300 mcg/kg/day for 3 days, and (b) 600 mcg/kg/day for 3 days. Mosquito mortality rate simulated median (solid black line), 5th and 95th percentiles (dashed lines), and 95% confidence intervals (CIs; shaded gray areas), with observed mosquito mortality rates per sample (open circles), observed median ± interquartile range mortality rate per study visit (ball‐whiskers), and minimum effect (Emin; horizontal dashed line). (c) Comparison of both regimens with a simulation of a 400 mcg/kg single‐dose. Simulations included 1,000 individuals of 60 kg bodyweight. (d) Mortality rate ratios calculated as incidence rate ratios using the PK/PD model (incidence rate ratio; lines) and as hazard ratios (HRs) with 95% CIs as per main efficacy results8 (HR; triangles: 600 mcg/kg/day for 3 days vs. placebo, squares: 300 mcg/kg/day for 3 days vs. placebo, and whiskers: 95%CIs). Conc., concentration; PPQ, piperaquine.

References

    1. Eisele, T.P. et al Short‐term impact of mass drug administration with dihydroartemisinin plus piperaquine on malaria in Southern province Zambia: a cluster‐randomized controlled trial. J. Infect. Dis. 214, 1831–1839 (2016). - PMC - PubMed
    1. Mwesigwa, J. et al Mass drug administration and reactive case detection for malaria elimination. ASTMH 2017 session. Am. J. Trop. Med. Hyg. 97(suppl. 5), 411–413 (2017).
    1. von Seidlein, L. et al Targeted malaria elimination in the greater Mekong subregion using mass drug administration. ECTMIH 2017 Session. Trop. Med. Int. Health 22, 394–396 (2017).
    1. Chaccour, C.J. et al Ivermectin to reduce malaria transmission: a research agenda for a promising new tool for elimination. Malar. J. 12, 153 (2013). - PMC - PubMed
    1. Smit, M.R. et al Efficacy and safety of high‐dose ivermectin for reducing malaria transmission (IVERMAL): protocol for a double‐blind, randomized, placebo‐controlled, dose‐finding trial in Western Kenya. JMIR Res. Protoc. 5, e213 (2016). - PMC - PubMed

Publication types

MeSH terms