Review
. 2018 Aug 17;8(8):157.
doi: 10.3390/brainsci8080157.

Magnetoencephalography: Clinical and Research Practices

Affiliations
Review

Magnetoencephalography: Clinical and Research Practices

Jennifer R Stapleton-Kotloski et al. Brain Sci. .

Abstract

Magnetoencephalography (MEG) is a neurophysiological technique that detects the magnetic fields associated with brain activity. Synthetic aperture magnetometry (SAM), a MEG magnetic source imaging technique, can be used to construct both detailed maps of global brain activity as well as virtual electrode signals, which provide information that is similar to invasive electrode recordings. This innovative approach has demonstrated utility in both clinical and research settings. For individuals with epilepsy, MEG provides valuable, nonredundant information. MEG accurately localizes the irritative zone associated with interictal spikes, often detecting epileptiform activity other methods cannot, and may give localizing information when other methods fail. These capabilities potentially greatly increase the population eligible for epilepsy surgery and improve planning for those undergoing surgery. MEG methods can be readily adapted to research settings, allowing noninvasive assessment of whole brain neurophysiological activity, with a theoretical spatial range down to submillimeter voxels, and in both humans and nonhuman primates. The combination of clinical and research activities with MEG offers a unique opportunity to advance translational research from bench to bedside and back.

Keywords: epilepsy; magnetic source imaging; magnetoencephalography; synthetic aperture magnetometry.


Conflict of interest statement

The authors declare no conflicts of interest.

Figures

Figure 1
Figure 1
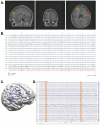
(A) The raw magnetoencephalogram (MEG) sensor data (black traces) exhibited strong artifacts due the patient’s vagal nerve stimulator (VNS), but the virtual electrode signal (red) from the amygdala displayed clear spikes. (B) The synthetic aperture magnetometry (SAM) (g2) statistical parametric maps indicated a right hippocampal focus as well as (C) another focus in the amygdala. (D) A computerized tomography (CT) scan reveals the placement of the hippocampal and amydalar depth electrodes, as well as the location of the hippocampal focus (green cross) as identified by SAM(g2). (E) An example of a seizure that arose from the anterior hippocampal and amygdalar electrodes, (black asterisks). (F) A coronal plane ictal single-photon emission computerized tomography (SPECT) image demonstrating hyperperfusion of the right temporal lobe (arrow). (G) A coronal plane 18F-fluorodeoxyglucose (FDG) (positron emission tomography) PET image demonstrating hypometabolism of the right temporal lobe (arrow).
Figure 1
Figure 1
(A) The raw magnetoencephalogram (MEG) sensor data (black traces) exhibited strong artifacts due the patient’s vagal nerve stimulator (VNS), but the virtual electrode signal (red) from the amygdala displayed clear spikes. (B) The synthetic aperture magnetometry (SAM) (g2) statistical parametric maps indicated a right hippocampal focus as well as (C) another focus in the amygdala. (D) A computerized tomography (CT) scan reveals the placement of the hippocampal and amydalar depth electrodes, as well as the location of the hippocampal focus (green cross) as identified by SAM(g2). (E) An example of a seizure that arose from the anterior hippocampal and amygdalar electrodes, (black asterisks). (F) A coronal plane ictal single-photon emission computerized tomography (SPECT) image demonstrating hyperperfusion of the right temporal lobe (arrow). (G) A coronal plane 18F-fluorodeoxyglucose (FDG) (positron emission tomography) PET image demonstrating hypometabolism of the right temporal lobe (arrow).
Figure 2
Figure 2
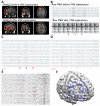
(A) SAM(g2) identified a single focus in the right middle frontal gyrus. (B) The virtual electrode (red) exhibited numerous small, sharp spikes which were not visible in the simultaneous EEG (black traces). (C) Stereo EEG electrodes (green arrows) placed directly over the MEG focus (red sphere) exhibited frequent epileptiform activity ((D), green arrow), two spikes of which are highlighted in orange.
Figure 3
Figure 3
(A) SAM(g2) indicated the presence of a left occipital focus with numerous MEG-only spikes visible on the virtual electrode ((B), red trace). The simultaneous scalp EEG recording (black traces) did not detect these spikes.
Figure 4
Figure 4
(A) Prior to VNS implantation, equivalent current dipole map of interictal spikes was nonlocalizing. The yellow circle indicates the dipole position, and the yellow tail indicates dipole magnitude and orientation. (B) Dipole map of interictal spikes following VNS implantation. Dipoles localize to VNS leads in the patient’s neck. Tails have been omitted for clarity. All images are in radiological coordinates, where the patient’s left is presented on the right side of each figure.
Figure 5
Figure 5
(A) SAM(g2) analysis of the MEG recording before VNS implantation (upper panel) and after VNS implantation (lower panel) identifies a peak of kurtosis at the same anatomical location. (B) The raw MEG recording (black traces, displayed as a butterfly plot) before VNS implantation (upper panel) and after VNS implantation (lower panel). The raw MEG recording after VNS implantation was heavily contaminated by artifact from the patient’s VNS, while the virtual electrode signals (lower panel, red trace) permitted the identification of epileptiform activity (lower panel, asterisks). (C) Epileptiform activity (asterisks) identified within the virtual electrode (red trace) coincided with poorly localized activity on the simultaneously recorded scalp EEG (black traces). (D) A run of epileptiform activity was seen in the virtual electrode (red trace) prior to a poorly localized discharge that was observed on scalp EEG (black traces). (E) Electrocorticography was used to identify an ictal focus (red trace). (F) Reconstruction of the patient’s brain from her own MRI illustrates the placement of the subdural grid (blue disks). The electrode that was determined to overlie the ictal focus (green disk, red trace from (E)) colocalized with the peak identified from the MEG recording (red cross).
Figure 6
Figure 6
(A) SAM(g2) maps reveal a strong focus in the left posterior temporal/lateral occipital cortex. (B) A MEG-only electrographic seizure emanating from the left temporal/occipital focus was visible in the upper virtual electrode (red, top trace). The patient reported experiencing her aura during this event, which later evolved into a tonic clonic event and necessitated her removal from the scanner. The lower virtual electrode (red, bottom trace) corresponds to activity from one of the mesial temporal foci, but epileptiform signals were not evident during this initial time frame. The simultaneous EEG (black, upper traces) did not reveal the discharge. (C) During a recorded seizure, electrocorticography (ECoG) demonstrates early epileptiform activity (red channel) at an electrode ((D), green) near the SAM(g2) peaks (red crosses). The ECoG positions are approximate because they were reconstructed based on x-ray images and because the patient experienced swelling after implantation.

References

    1. Baillet S., Mosher J.C., Leahy R.M. Electromagnetic brain mapping. IEEE Signal Process. Mag. 2001;18:14–30. doi: 10.1109/79.962275. - DOI
    1. Caton R. The Electric Currents of the Brain. BMJ. 1875;2:278. doi: 10.1080/00029238.1970.11080764. - DOI
    1. Cohen D. Magnetoencephalography: Detection of the brain’s electrical activity with a superconducting magnetometer. Science. 1972;175:664–666. doi: 10.1126/science.175.4022.664. - DOI - PubMed
    1. Burle B., Spieser L., Roger C., Casini L., Hasbroucq T., Vidal F. Spatial and temporal resolutions of EEG: Is it really black and white? A scalp current density view. Int. J. Psychophysiol. 2015;97:210–220. doi: 10.1016/j.ijpsycho.2015.05.004. - DOI - PMC - PubMed
    1. Hillebrand A., Barnes G.R., Hubert P. International Review of Neurobiology. Volume 68. Academic Press; New York, NY, USA: 2005. Beamformer Analysis of MEG Data; pp. 149–171. - PubMed

LinkOut - more resources