. 2018 Aug 20;17(1):67.
doi: 10.1186/s12940-018-0413-y.

Statistical software for analyzing the health effects of multiple concurrent exposures via Bayesian kernel machine regression

Affiliations

Statistical software for analyzing the health effects of multiple concurrent exposures via Bayesian kernel machine regression

Jennifer F Bobb et al. Environ Health. .

Abstract

Background: Estimating the health effects of multi-pollutant mixtures is of increasing interest in environmental epidemiology. Recently, a new approach for estimating the health effects of mixtures, Bayesian kernel machine regression (BKMR), has been developed. This method estimates the multivariable exposure-response function in a flexible and parsimonious way, conducts variable selection on the (potentially high-dimensional) vector of exposures, and allows for a grouped variable selection approach that can accommodate highly correlated exposures. However, the application of this novel method has been limited by a lack of available software, the need to derive interpretable output in a computationally efficient manner, and the inability to apply the method to non-continuous outcome variables.

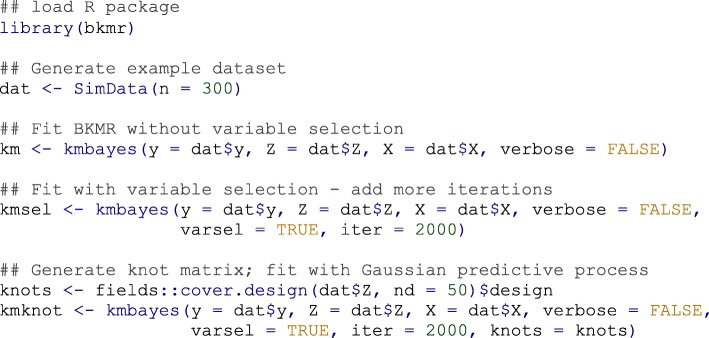
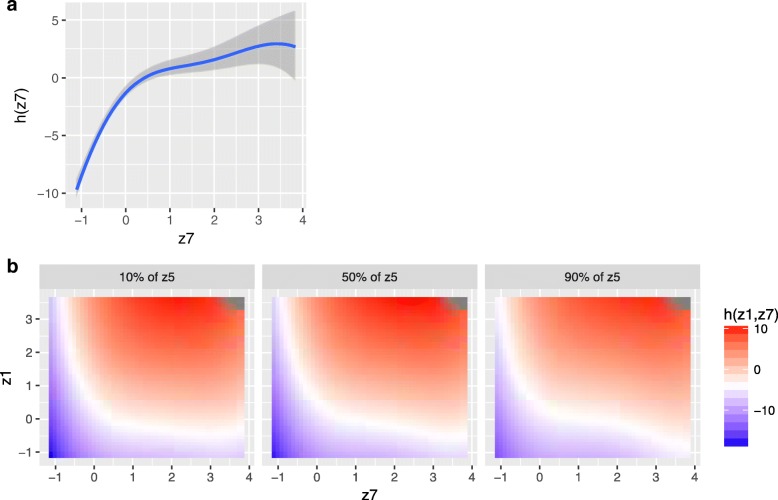
Methods: This paper addresses these limitations by (i) introducing an open-source software package in the R programming language, the bkmr R package, (ii) demonstrating methods for visualizing high-dimensional exposure-response functions, and for estimating scientifically relevant summaries, (iii) illustrating a probit regression implementation of BKMR for binary outcomes, and (iv) describing a fast version of BKMR that utilizes a Gaussian predictive process approach. All of the methods are illustrated using fully reproducible examples with the provided R code.

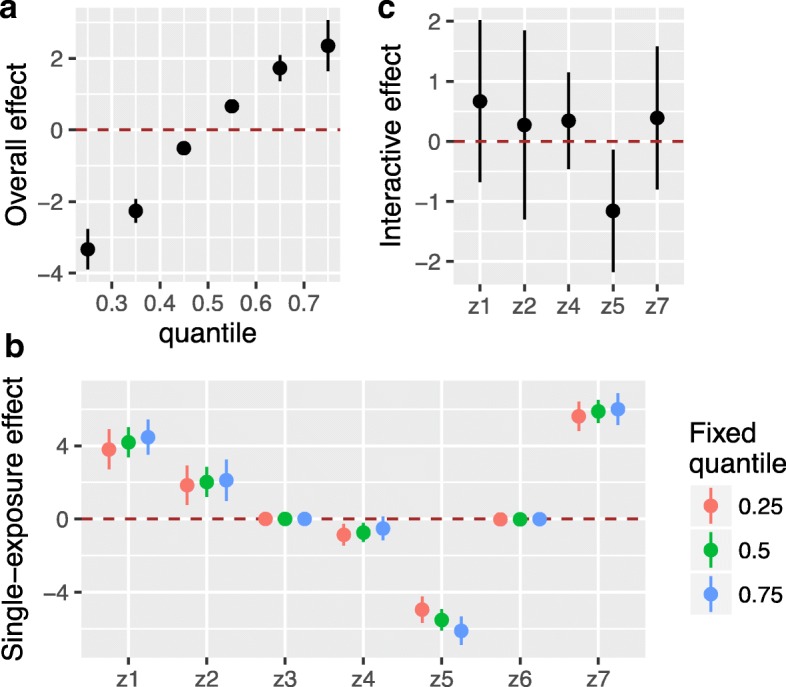
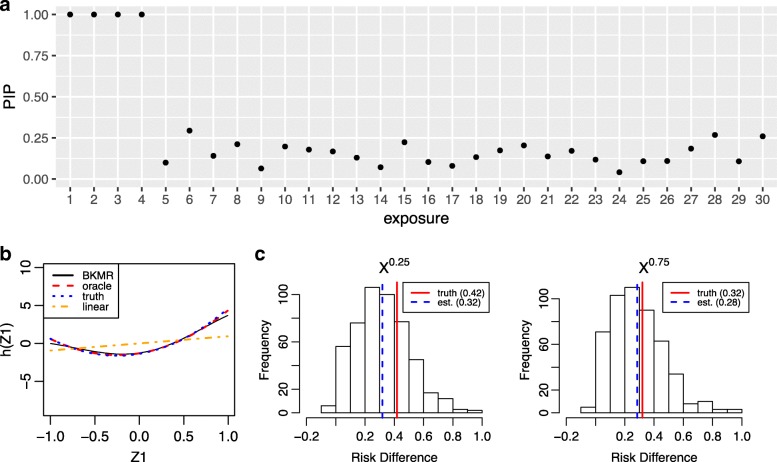
Results: Applying the methods to a continuous outcome example illustrated the ability of the BKMR implementation to estimate the health effects of multi-pollutant mixtures in the context of a highly nonlinear, biologically-based dose-response function, and to estimate overall, single-exposure, and interactive health effects. The Gaussian predictive process method led to a substantial reduction in the runtime, without a major decrease in accuracy. In the setting of a larger number of exposures and a dichotomous outcome, the probit BKMR implementation was able to correctly identify the variables included in the exposure-response function and yielded interpretable quantities on the scale of a latent continuous outcome or on the scale of the outcome probability.

Conclusions: This newly developed software, integrated suite of tools, and extended methodology makes BKMR accessible for use across a broad range of epidemiological applications in which multiple risk factors have complex effects on health.

Keywords: Exposure-response; Health risk estimation; Mixtures; Multiple exposures; Variable selection.


Conflict of interest statement

Ethics approval and consent to participate

Not applicable

Consent for publication

Not applicable

Competing interests

The authors declare that they have no competing interests.

Publisher’s Note

Springer Nature remains neutral with regard to jurisdictional claims in published maps and institutional affiliations.

Figures

Fig. 1
Fig. 1
Usage example showing R code to fit BKMR with a continuous outcome. Here ‘y’ denotes the response vector of length n (where n is the number of observations); ‘Z’ is the n-by-M exposure matrix, where M is the number of exposure variables included in the exposure-response function h; and ‘X’ is the n-by-P covariate matrix, where P is the number of covariates
Fig. 2
Fig. 2
Cross-sections of the exposure-response function h(z1, …, z7), estimated using Bayesian kernel machine regression. a Univariate exposure-response function of z7 (95% credible intervals [CI]), where the remaining exposures are fixed at their median values. b Bivariate exposure-response function of z7 and z1 for z5 fixed at either its 10th, 50th, or 90th percentile, and for the remaining exposures fixed at their median values
Fig. 3
Fig. 3
Numerical summaries of the exposure-response function h(z1, …, z7), estimated using Bayesian kernel machine regression. a Overall effect of the mixture (95% CI), defined as the difference in the response when all of the exposures are fixed at a specific quantile (ranging from 0.25 to 0.75), as compared to when all of the exposures are fixed at their median value. b Single-exposure health effects (95% CI), defined as the change in the response associated with a change in a particular exposure from its 25th to its 75th percentile, where all of the other exposures are fixed at a specific quantile (0.25, 0.50, or 0.75). c Interactive effects, defined as the change in the single-exposure health effects when all of the remaining exposures are fixed at their 25th percentile as compared to when they are fixed at their 75th percentile (i.e., red points from Panel b subtracted from the corresponding blue points)
Fig. 4
Fig. 4
Example output from fitting probit Bayesian kernel machine regression to simulated data. a Posterior inclusion probabilities (PIPs) provide a measure of variable importance ranging from 0 to 1. Exposures 1–4 were included in h in the true data-generating model. b Univariate exposure-response function of z1 estimated from BKMR, in comparison to a probit generalized linear model (GLM) assuming linear terms of each of the exposure variables (“linear”), a probit GLM that uses the correct model form (“oracle”), and the true exposure-response function (“truth”). Under probit regression, h may be interpreted as the relationship between the exposure variables and an underlying, continuous latent outcome (e.g., a continuous marker of underlying health status for a binary health outcome). c Posterior distribution of the risk difference comparing the probability of the binary outcome when exposure 2 is at its 75th percentile versus its 50th percentile, for all of the exposures fixed at their median value, and for the single confounder x fixed at its 25th or 75th percentile (left and right panels, respectively), along with the posterior mean estimate (“est”) and the true risk difference (“truth”)

References

    1. Billionnet C, Sherrill D. Annesi-Maesano I, study G: estimating the health effects of exposure to multi-pollutant mixture. Ann Epidemiol. 2012;22:126–141. doi: 10.1016/j.annepidem.2011.11.004. - DOI - PubMed
    1. Hu H, Shine J, Wright RO. The challenge posed to children's health by mixtures of toxic waste: the Tar Creek superfund site as a case-study. Pediatr Clin N Am. 2007;54:155–175. doi: 10.1016/j.pcl.2006.11.009. - DOI - PMC - PubMed
    1. Gennings C, Sabo R, Carney E. Identifying subsets of complex mixtures most associated with complex diseases: polychlorinated biphenyls and endometriosis as a case study. Epidemiology. 2010;21(Suppl 4):S77–S84. - PubMed
    1. Carlin DJ, Rider CV, Woychik R, Birnbaum LS. Unraveling the health effects of environmental mixtures: an NIEHS priority. Environ Health Perspect. 2013;121:A6–A8. doi: 10.1289/ehp.1206182. - DOI - PMC - PubMed
    1. Braun JM, Gennings C, Hauser R, Webster TF. What can epidemiological studies tell us about the impact of chemical mixtures on human health? Environ Health Perspect. 2016;124:A6–A9. doi: 10.1289/ehp.1510569. - DOI - PMC - PubMed

Publication types

MeSH terms

Substances