. 2018 Aug 20;11(1):46.
doi: 10.1186/s13041-018-0390-7.

A zinc-finger fusion protein refines Gal4-defined neural circuits

Affiliations

A zinc-finger fusion protein refines Gal4-defined neural circuits

Shamprasad Varija Raghu et al. Mol Brain. .

Abstract

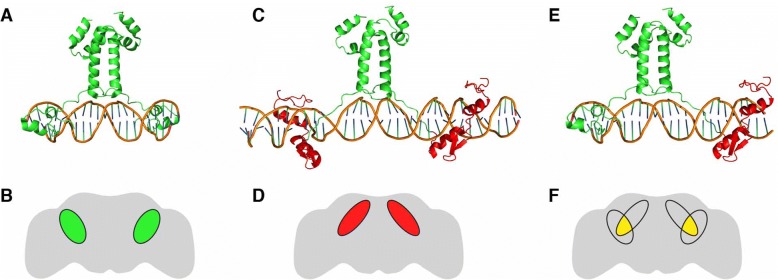
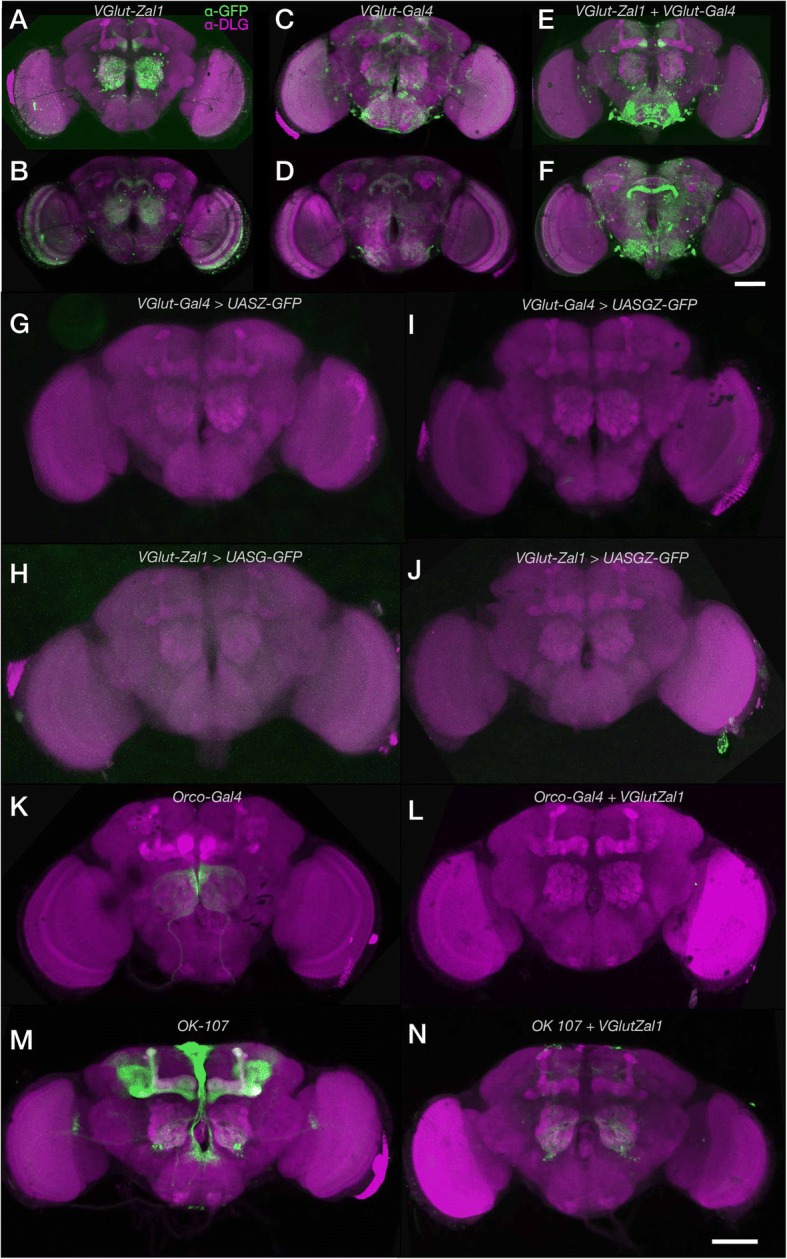
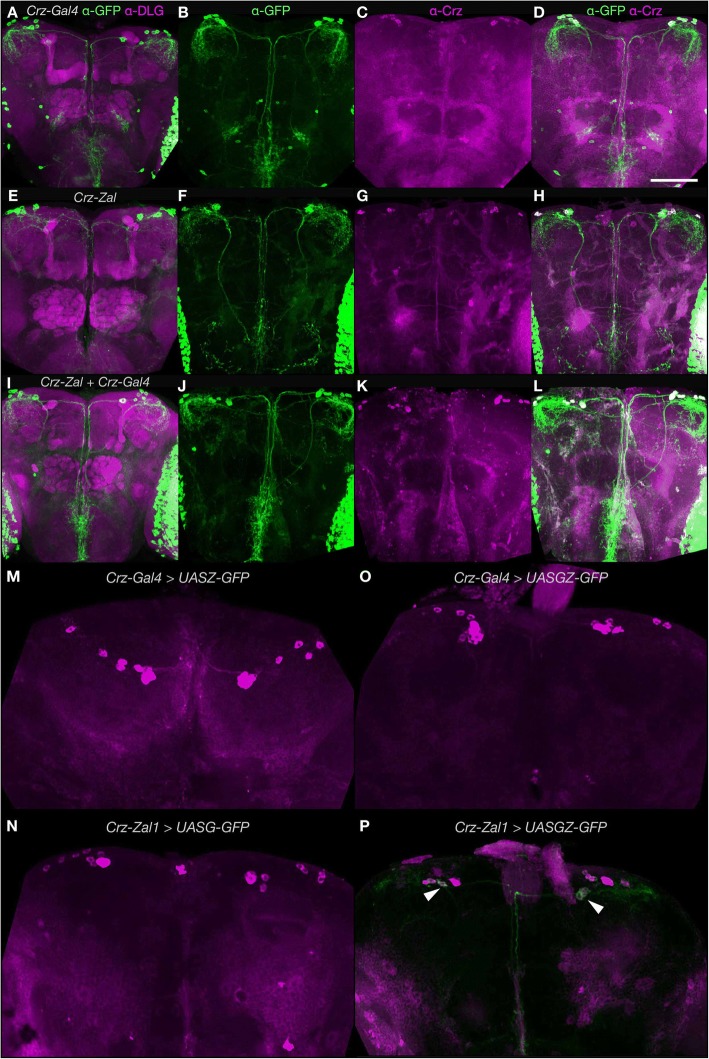
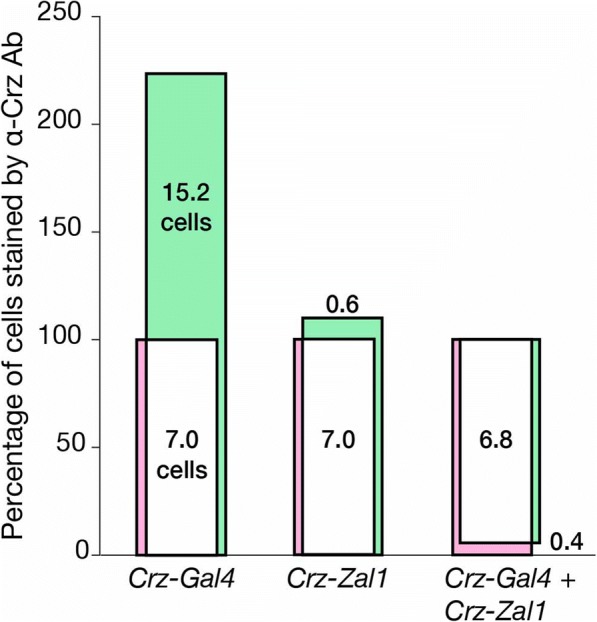
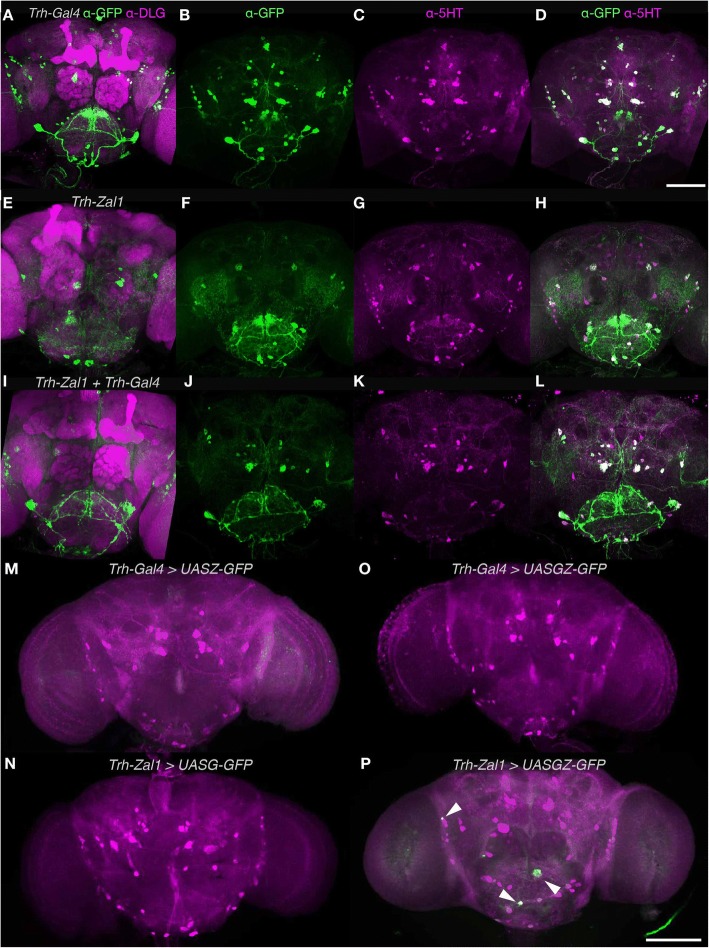
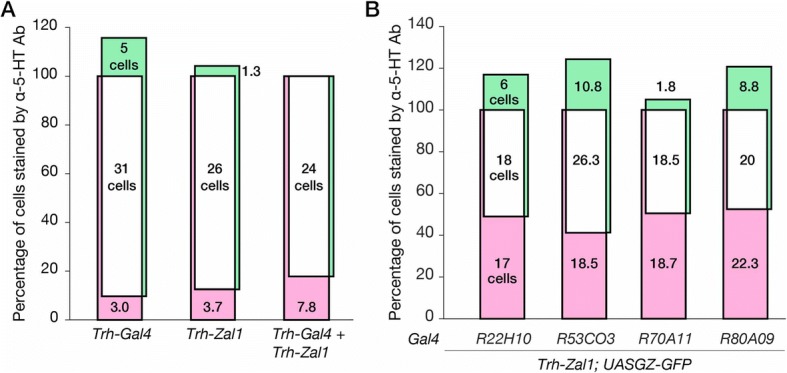
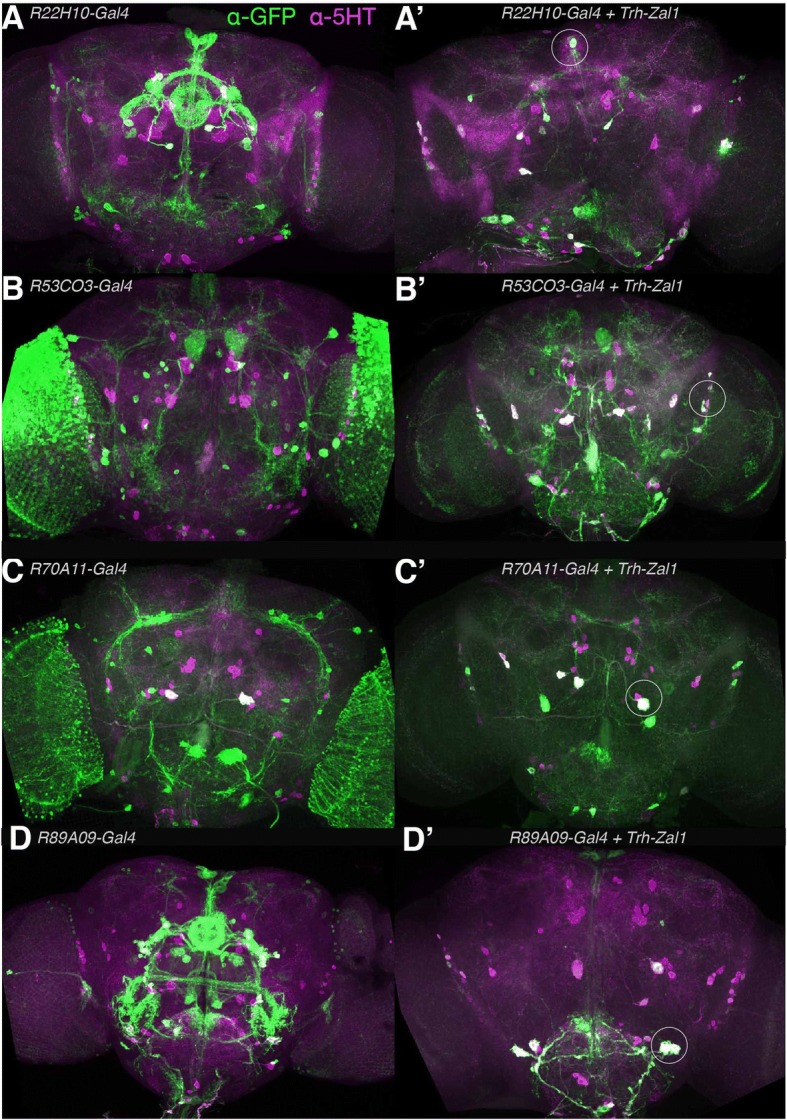
The analysis of behavior requires that the underlying neuronal circuits are identified and genetically isolated. In several major model species-most notably Drosophila-neurogeneticists identify and isolate neural circuits with a binary heterologous expression-control system: Gal4-UASG. One limitation of Gal4-UASG is that expression patterns are often too broad to map circuits precisely. To help refine the range of Gal4 lines, we developed an intersectional genetic AND operator. Interoperable with Gal4, the new system's key component is a fusion protein in which the DNA-binding domain of Gal4 has been replaced with a zinc finger domain with a different DNA-binding specificity. In combination with its cognate binding site (UASZ) the zinc-finger-replaced Gal4 ('Zal1') was functional as a standalone transcription factor. Zal1 transgenes also refined Gal4 expression ranges when combined with UASGZ, a hybrid upstream activation sequence. In this way, combining Gal4 and Zal1 drivers captured restricted cell sets compared with single drivers and improved genetic fidelity. This intersectional genetic AND operation presumably derives from the action of a heterodimeric transcription factor: Gal4-Zal1. Configurations of Zal1-UASZ and Zal1-Gal4-UASGZ are versatile tools for defining, refining, and manipulating targeted neural expression patterns with precision.


Conflict of interest statement

Ethics approval and consent to participate

No ethics approval was required or sought.

Consent for publication

Not applicable.

Competing interests

The authors declare that they have no competing interests.

Publisher’s Note

Springer Nature remains neutral with regard to jurisdictional claims in published maps and institutional affiliations.

Figures

Fig. 1
Fig. 1
Structural models of Gal4 and Zal1; the experimental expression concept. a Structural model of Gal4 protein domains in the native homodimeric configuration; two zinc fingers constitute the DNA-binding domain. Only the DNA-binding domain, linker and dimerization domain of Gal4 are shown. b A hypothetical expression pattern for Gal4 homodimer driving expression from a UASG effector gene in the adult fly brain. c. A hypothetical structural model of Zal1 protein in which the zinc fingers of Gal4 are replaced with fingers 1 and 2 from the crystal structure of EGR1, shown in red. d A hypothetical expression pattern for Zal1 homodimer driving expression from a UASZ effector gene. e A model of the Gal4-Zal1 heterodimer. f A hypothetical expression pattern produced by Gal4-Zal1 heterodimer in the presence of a UASGZ effector gene
Fig. 2
Fig. 2
VGlut-Zal1 drives reporter expression with similar fidelity to VGlut-Gal4 and generates distinct intersected expression pattern in combination of Gal4 lines. In adult fly brains, widespread GFP expression was observed for both VGlut drivers and their combination. ab Maximum intensity projection images of (a) the brain anterior to the ellipsoid body and (b) the ellipsoid-posterior brain of a UASZ-mCD8GFP/+; VGlut-Zal1/+ fly stained with α-GFP (green) and α-DLG (magenta) antibodies. cd Maximum intensity projections of the anterior (c) and posterior (d) expression patterns in a UASG-mCD8GFP/+; VGlut-Gal4/+ brain stained with α-GFP (green) and α-DLG (magenta) antibodies. ef Projection images of an anterior (e) and posterior (f) portions of a UASGZ-mCD8GFP/+; VGlut-Zal1/VGlut-Gal4 brain stained with α-GFP (green) and α-DLG (magenta) antibodies. gh. VGlut-Gal4 and VGlut-Zal1 are not individually active at non-cognate UAS sites. VGlut-Gal4; UASZ-GFP and VGlut-Zal1; UASG-GFP brains stained with α-GFP showed little or no green fluorescence. i.VGlut-Gal4; UASGZ-GFP and j. VGlut-Zal1; UASGZ-GFP brains were α-GFP-negative. k. Expression pattern of Orco-Gal4 crossed with UASG-GFP. l Intersectional expression pattern of Orco-Gal4 generated using VGlut-Zal1; no GFP expression was observed. m The expression pattern of OK107-Gal4 crossed with UASG-GFP. n The intersectional expression pattern of OK107-Gal4 with VGlut-Zal1. Images show staining with α-GFP (green) and α-DLG (magenta). Scale bars represents 200 μm; dorsal is up
Fig. 3
Fig. 3
A combination of Crz-Zal1 and Crz-Gal4 drives expression in corazonergic cells. Maximum intensity projection (MIP) images of brain immunofluorescence. ad MIP images of (A) of a UASG-mCD8GFP/+;Crz-Gal4/+ brain stained with α-GFP (green) and α-DLG (magenta) antibodies. b An image of a Crz-Gal4/UASZ-mCD8GFP brain stained with α-GFP (green), (C) and α-Crz antibodies (magenta) and (D) combined image. eh UASZ-mCD8GFP/+; Crz-Zal1/+ brains stained with α-GFP, (e) α-DLG (magenta) and (h) α-Crz. i UASGZ-mCD8GFP/+;Crz-Gal4/+; Crz-ZAL1 brains stained with α-GFP and α-DLG (magenta) antibodies. j A Crz-Gal4/UASGZ-mCD8GFP brain stained with α-GFP, k α-Crz, and l combined image. m. Control brains were stained with α-GFP and α-Crz. Crz-Gal4 is inactive at non-cognate UASZ sites in Crz-Gal4; UASZ-GFP brains. n Crz-Zal1; UASG-GFP brains stained with α-GFP showed no green fluorescence. o Crz-Gal4; UASGZ-GFP brains showed no fluorescence. p Crz-Zal1; UASGZ-GFP showed weak expression in a few Crz cells (arrows indicate expression). Scale bar represents 200 μm; dorsal is up
Fig. 4
Fig. 4
Quantification of Gal4- and Zal1-mediated genetic intersection in Crz cells. A Venn plot shows cell counts of α-GFP and α-Crz antibody staining as percentages. Bar heights are quantitative; bar areas are not. Counts of cells staining positively for Crz were defined as constituting 100% of α-Crz + cells (magenta bar). Counts of cells staining α-GFP+ were defined as the driver’s expression range (green bar). The overlap between α-Crz + and α-GFP+ cells is displayed in white. Left The Crz-Gal4 driver expresses GFP in all seven Crz + neurons, along with expression in 15 ectopic cells. Center Crz-Zal1 expresses in all 7 corazonergic cells along with ectopic expression in less than one cell. Right The Crz-Gal4/Crz-Zal1 double driver expresses in Crz + cells exclusively
Fig. 5
Fig. 5
The Trh-Zal1 + Trh-Gal4 combination drives expression in the majority of serotonergic cells ad. MIPs of (a) of a UASG-mCD8GFP/+; Trh-Gal4/+ brain stained with α-GFP (green) and α-DLG (magenta) antibodies. b A Trh-Gal4/UASG-mCD8GFP brain stained with α-GFP (green), (c) with α-5HT antibodies and (d) combined image. e-h. MIPs of (e) a UASZ-mCD8GFP/+; Trh-Zal1/+ brain stained with α-GFP and α-DLG (magenta); (f) a Trh-Zal1/UASZ-mCD8GFP brain stained with α-GFP (green), (g) with α-5HT, and (h) combined image. il. MIPs of (i) a UASGZ-mCD8GFP/+; Trh-Zal1/Trh-Gal4 brain stained with α-GFP and α-DLG (magenta); (j) a Trh-Zal1; Trh-Gal4/UASGZ-mCD8GFP brain stained with α-GFP, (k) with α-5HT and (l) combined image. m A Trh-Gal4; UASZ-GFP brain stained with α-GFP showed no green fluorescence n. ATrh-Zal1; UASG-GFP brain showed no α-GFP fluorescence. o A Trh-Gal4; UASGZ-GFP brain showed no α-GFP fluorescence p. A Trh-Zal1; UASGZ-GFP brain showed weak GFP expression in a few cells; arrows indicate expression. The brains M–P were stained with α-GFP and α-5-HT. Scale bar represents 200 μm; dorsal is up
Fig. 6
Fig. 6
Genetic intersection of Trh-Zal1 with Trh-Gal4 and enhancer trap lines results in high-fidelity expression. a. A Venn plot displays α-GFP+ expression as a percentage of α-5-HT+ cells. Left Trh-Gal4 drives expression in 90% of serotonergic neurons, along with 17% of expression in ectopic cells; Center similarly, Trh-Zal1 drives expression in ~ 88% of serotonergic cells with ectopic expression in 4% of 5-HT+ cells. Right The Trh-Gal4/Trh-Zal1 combination drives expression in ~ 82% of serotonergic cells with no expression in ectopic cells. The total-count mean of 5-HT+ cells ranged from 30 to 34 per brain hemisphere. b. The R22H10-Gal4 + Trh-Zal1 combination has 51% extensiveness within the antibody stain, with 75% fidelity. The R53C03-Gal4 + Trh-Zal1 combination: 59% extensiveness and 71% fidelity. R70A11-Gal4 + Trh-Zal1 combination: 49.5% extensiveness and 91% fidelity. R89A09-Gal4 + Trh-Zal1 combination: 47.5% extensiveness and 69.5% fidelity. The total-count mean of 5-HT+ cells ranged from 35 to 42 per brain hemisphere
Fig. 7
Fig. 7
In combination with different Gal4 lines, Trh-Zal1 defines distinct intersectional high-fidelity serotonergic neuronal sets. a-d. Expression patterns of UASG-GFP signal as driven from Gal4 lines: R22H10, R53C03, R70A11, and R89A09. Brain images show staining with α-GFP (green) and α-5HT (magenta) antibodies. a’-d’ The respective intersectional expression patterns when the drivers are used in combination with Trh-Zal1. a’ Intersectional expression from R22H10-Gal4 + Trh-Zal1 shows highly specific expression in serotonergic LP2 and SE3 cells (arrowhead) b’. Intersectional expression of R53C03-Gal4 + Trh-Zal1 shows specific expression in a few LP2, IP and SE1 serotonergic cells. c’. Intersectional expression of R70A11-Gal4 + Trh-Zal1 shows very specific serotonergic expression: two LP2, two PLP and IP cells. A few ectopic cells can also be seen in the subesophageal zone (SEZ). d’ Intersection of R89A09-Gal4 with Trh-Zal1 resulted in very specific expression pattern in the serotonergic SE3 cells

Similar articles

Cited by

References

    1. Alekseyenko OV, Lee C, Kravitz EA. Targeted manipulation of serotonergic neurotransmission affects the escalation of aggression in adult male Drosophila melanogaster. PloS one. 2010;5(5):e10806. doi: 10.1371/journal.pone.0010806. - DOI - PMC - PubMed
    1. Altman D, et al. Statistics with confidence: confidence interval and statistical guidelines. Bristol: BMJ Books; 2000.
    1. Bellen HJ, Tong C, Tsuda H. 100 years of Drosophila research and its impact on vertebrate neuroscience: a history lesson for the future. Nat Rev Neurosci. 2010;11(7):514–522. doi: 10.1038/nrn2839. - DOI - PMC - PubMed
    1. Bohm RA, et al. A genetic mosaic approach for neural circuit mapping in Drosophila. Proc Natl Acad Sci USA. 2010;107(37):16378–16383. doi: 10.1073/pnas.1004669107. - DOI - PMC - PubMed
    1. Brand AH, Perrimon N. Targeted gene expression as a means of altering cell fates and generating dominant phenotypes. Development. 1993;118(2):401–415. - PubMed

Publication types

MeSH terms

LinkOut - more resources