

Decreasing fire season precipitation increased recent western US forest wildfire activity
- PMID: 30126983
- PMCID: PMC6130364
- DOI: 10.1073/pnas.1802316115
Decreasing fire season precipitation increased recent western US forest wildfire activity
Abstract
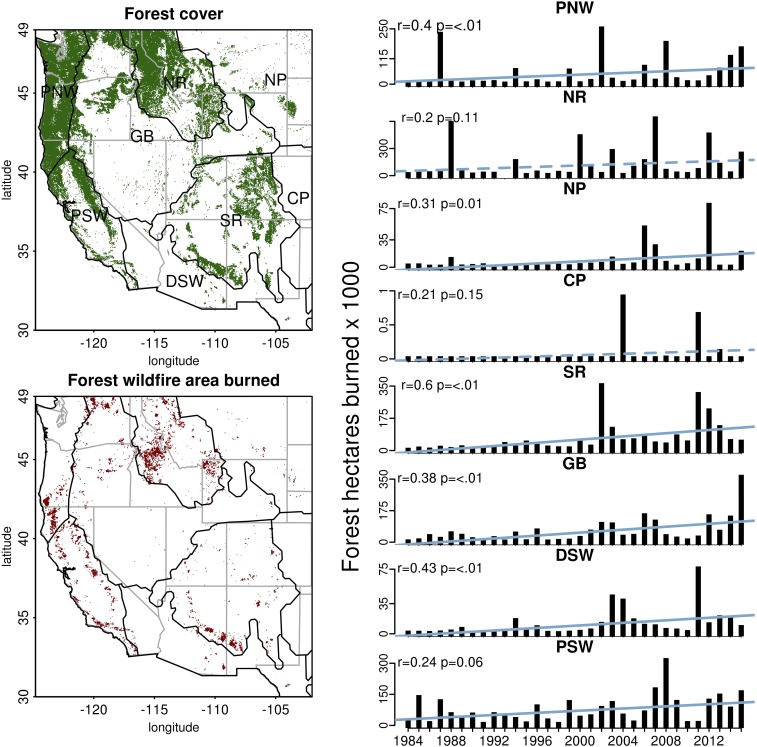
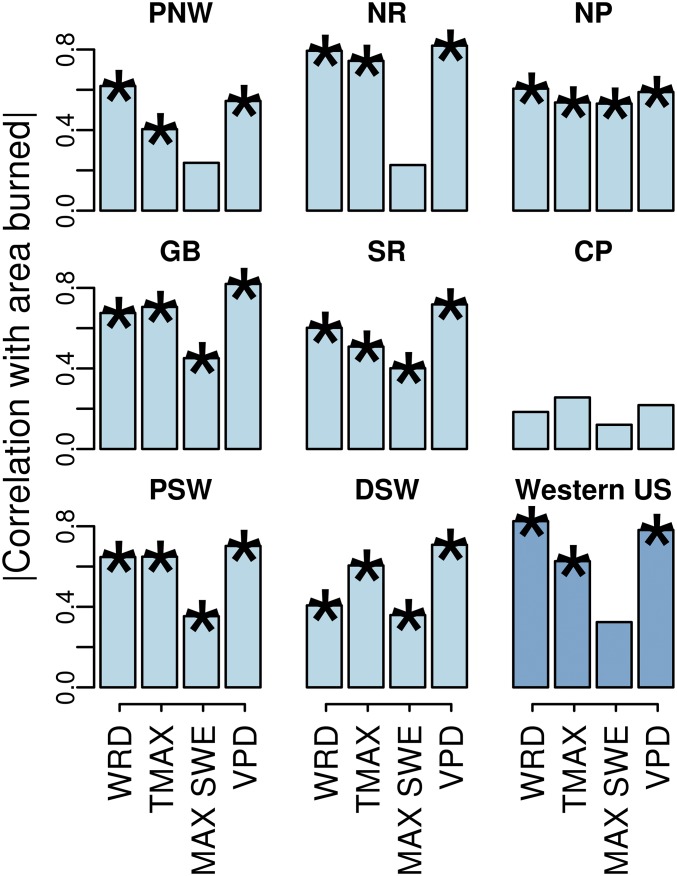
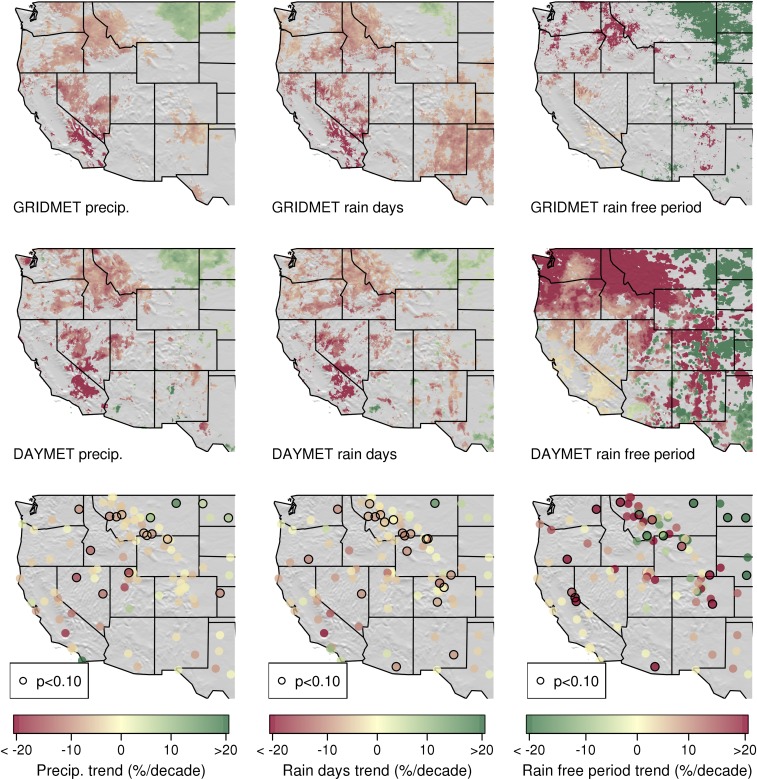
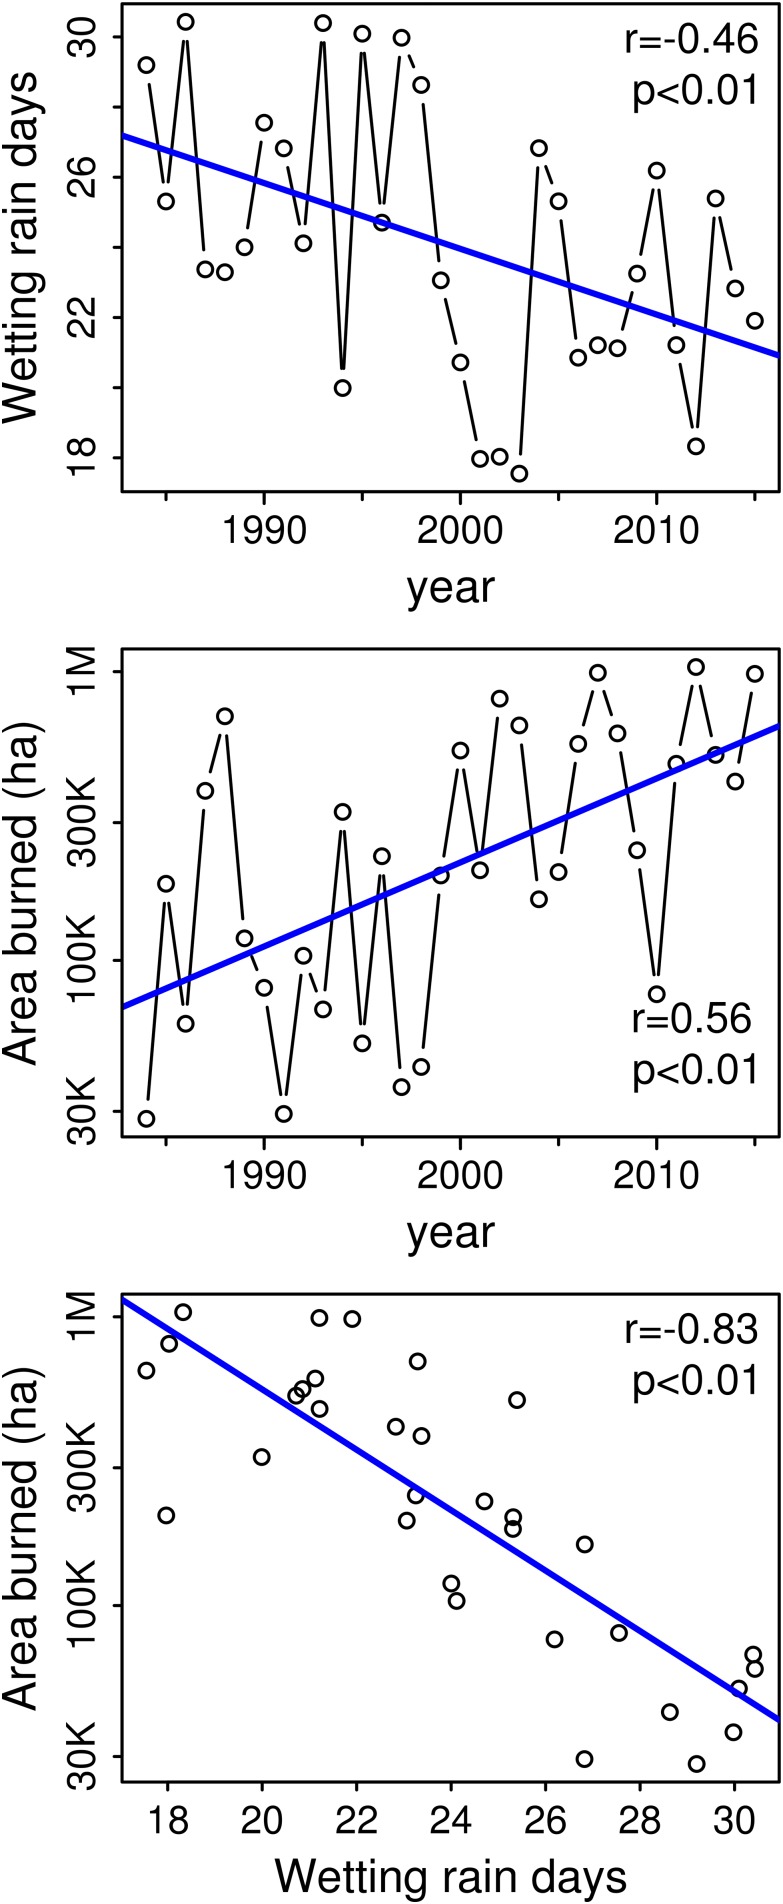
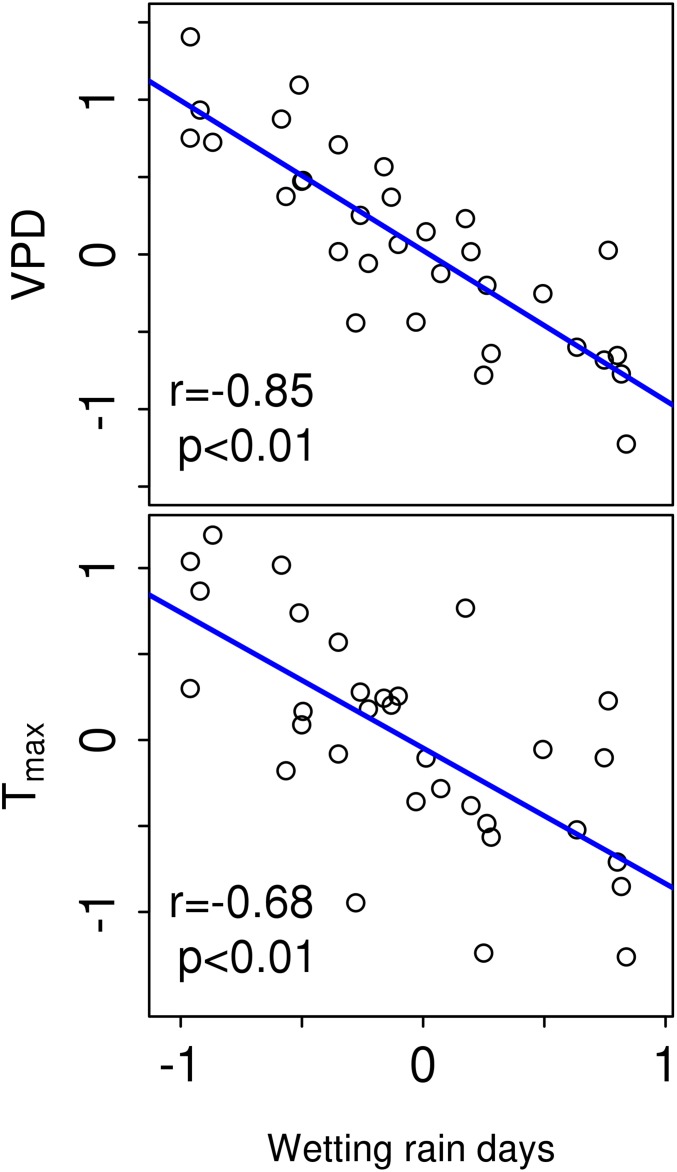
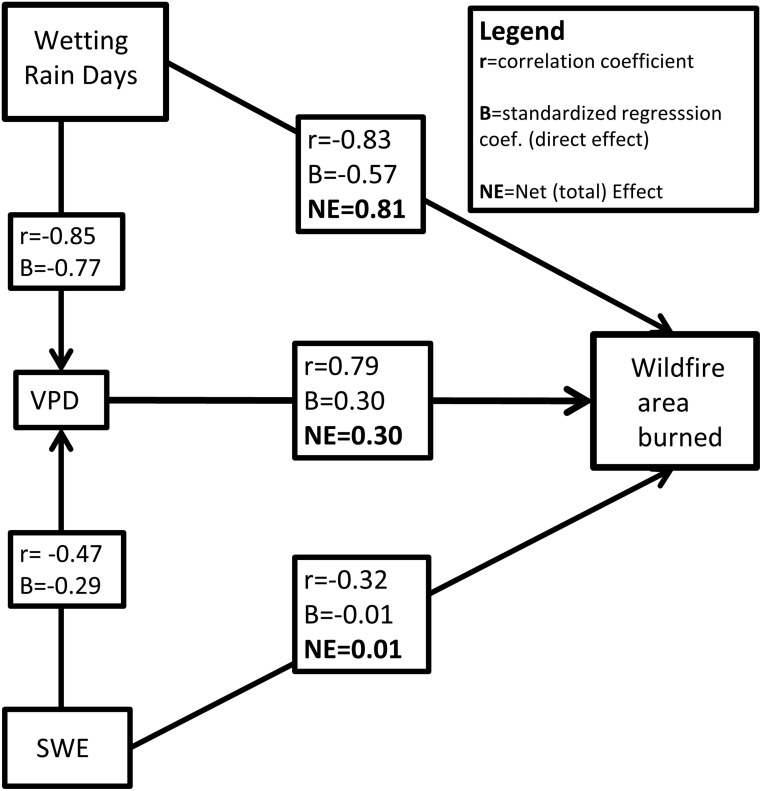
Western United States wildfire increases have been generally attributed to warming temperatures, either through effects on winter snowpack or summer evaporation. However, near-surface air temperature and evaporative demand are strongly influenced by moisture availability and these interactions and their role in regulating fire activity have never been fully explored. Here we show that previously unnoted declines in summer precipitation from 1979 to 2016 across 31-45% of the forested areas in the western United States are strongly associated with burned area variations. The number of wetting rain days (WRD; days with precipitation ≥2.54 mm) during the fire season partially regulated the temperature and subsequent vapor pressure deficit (VPD) previously implicated as a primary driver of annual wildfire area burned. We use path analysis to decompose the relative influence of declining snowpack, rising temperatures, and declining precipitation on observed fire activity increases. After accounting for interactions, the net effect of WRD anomalies on wildfire area burned was more than 2.5 times greater than the net effect of VPD, and both the WRD and VPD effects were substantially greater than the influence of winter snowpack. These results suggest that precipitation during the fire season exerts the strongest control on burned area either directly through its wetting effects or indirectly through feedbacks to VPD. If these trends persist, decreases in summer precipitation and the associated summertime aridity increases would lead to more burned area across the western United States with far-reaching ecological and socioeconomic impacts.
Keywords: climate change; hydrology; wildfire.
Conflict of interest statement
The authors declare no conflict of interest.
Figures
References
-
- Westerling AL, Hidalgo HG, Cayan DR, Swetnam TW. Warming and earlier spring increase western U.S. forest wildfire activity. Science. 2006;313:940–943. - PubMed
-
- Westerling AL, Gershunov A, Brown TJ, Cayan DR, Dettinger MD. Climate and wildfire in the western United States. Bull Am Meteorol Soc. 2003;84:595–604.
-
- Holden ZA, Morgan P, Crimmins MA, Steinhorst RK, Smith AMS. Fire season precipitation variability influences fire extent and severity in a large southwestern wilderness area, United States. Geophys Res Lett. 2007;34:L16708.
-
- Littell JS, McKenzie D, Peterson DL, Westerling AL. Climate and wildfire area burned in western U.S. ecoprovinces, 1916-2003. Ecol Appl. 2009;19:1003–1021. - PubMed
Publication types
MeSH terms
LinkOut - more resources
Full Text Sources
Other Literature Sources
Medical
