. 2018 Sep 4;115(36):E8460-E8468.
doi: 10.1073/pnas.1800431115. Epub 2018 Aug 20.

Circadian clock protein BMAL1 regulates IL-1β in macrophages via NRF2

Affiliations

Circadian clock protein BMAL1 regulates IL-1β in macrophages via NRF2

James O Early et al. Proc Natl Acad Sci U S A. .

Abstract

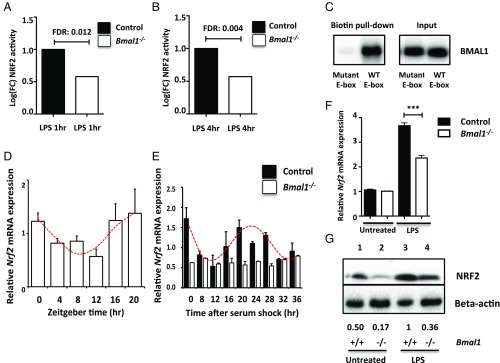
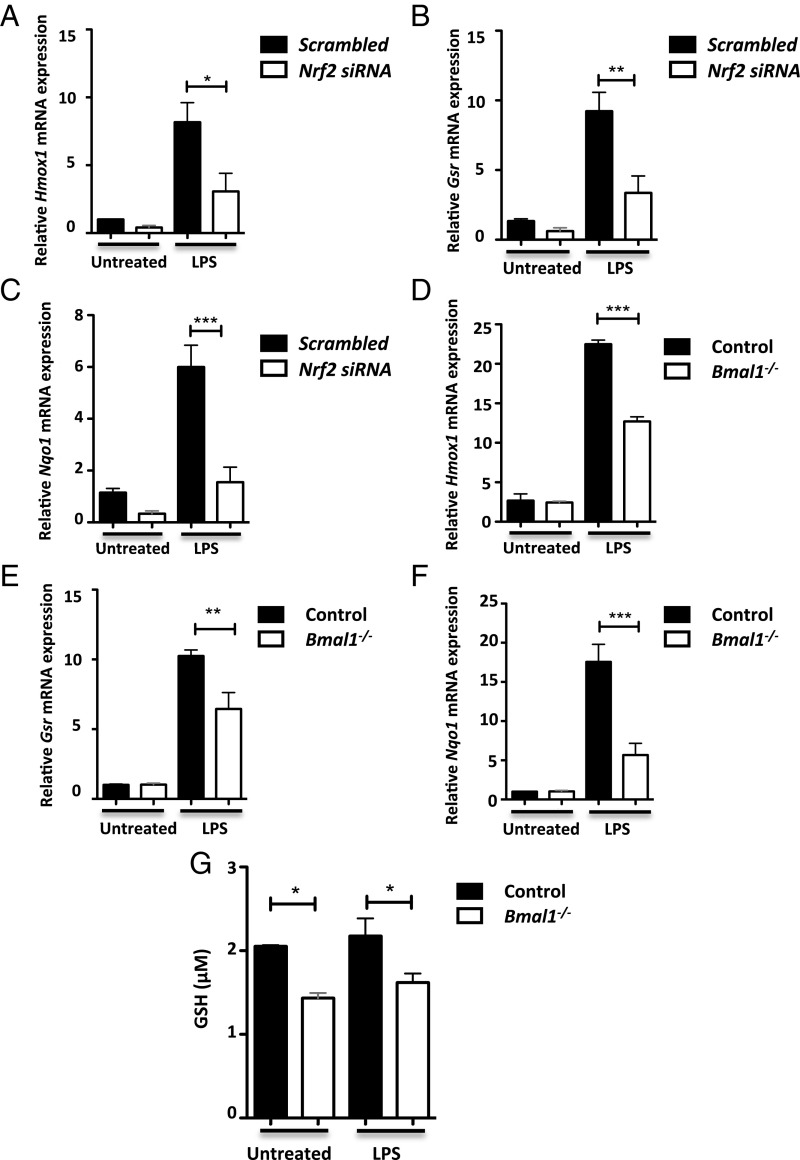
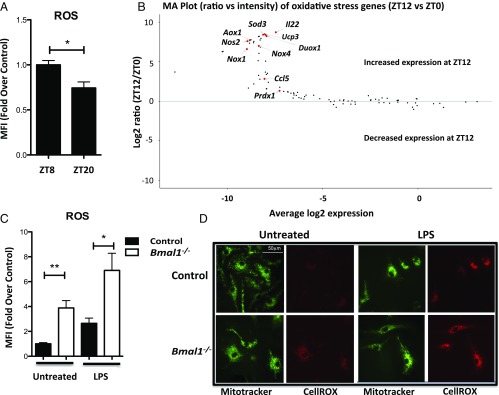
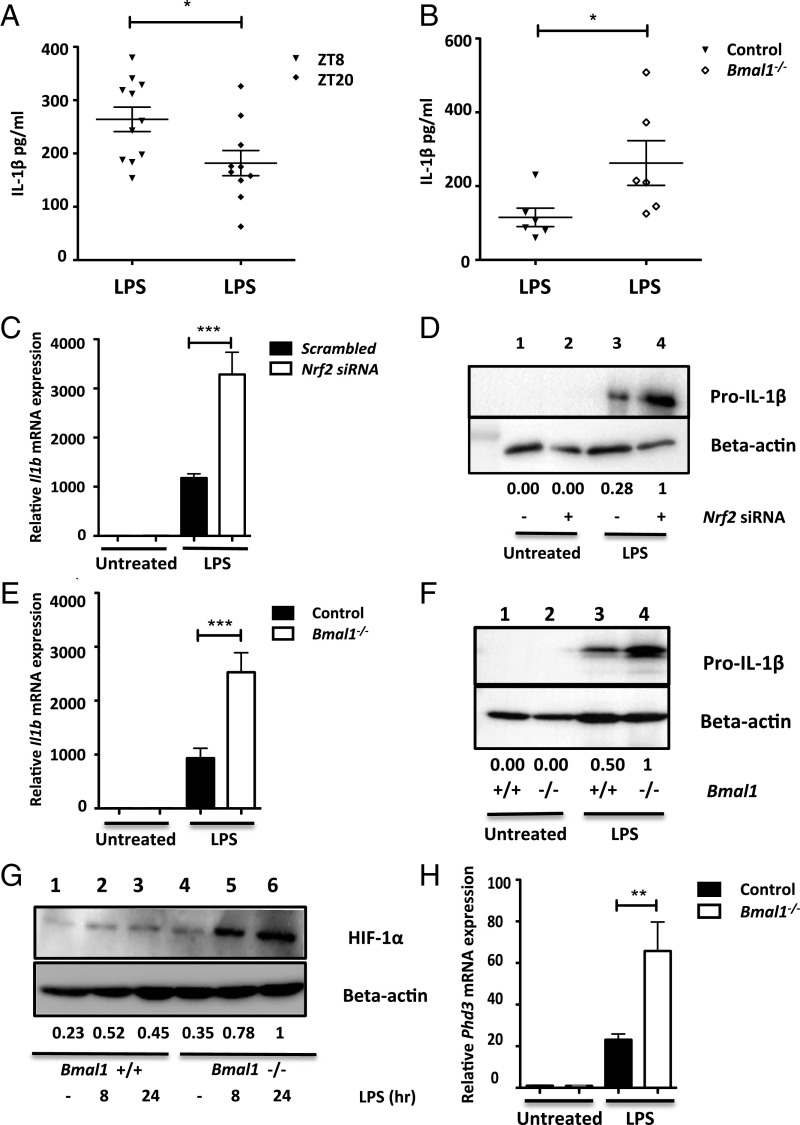
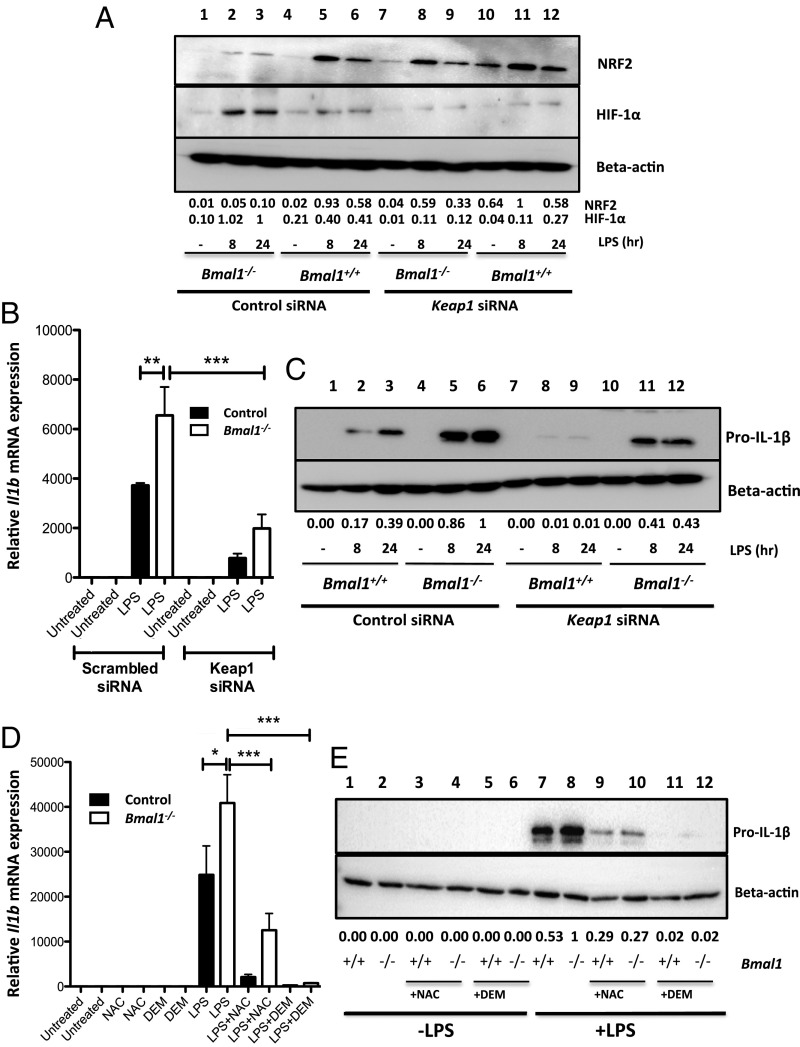
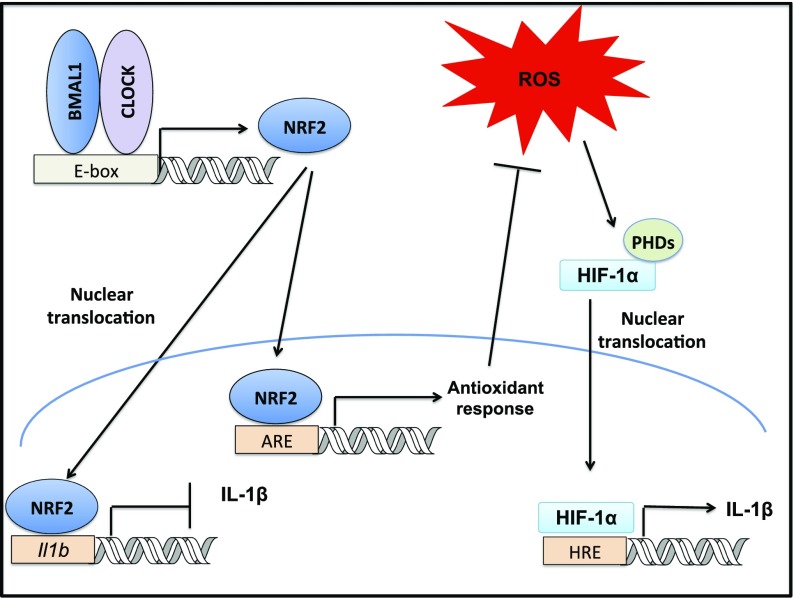
A variety of innate immune responses and functions are dependent on time of day, and many inflammatory conditions are associated with dysfunctional molecular clocks within immune cells. However, the functional importance of these innate immune clocks has yet to be fully characterized. NRF2 plays a critical role in the innate immune system, limiting inflammation via reactive oxygen species (ROS) suppression and direct repression of the proinflammatory cytokines, IL-1β and IL-6. Here we reveal that the core molecular clock protein, BMAL1, controls the mRNA expression of Nrf2 via direct E-box binding to its promoter to regulate its activity. Deletion of Bmal1 decreased the response of NRF2 to LPS challenge, resulting in a blunted antioxidant response and reduced synthesis of glutathione. ROS accumulation was increased in Bmal1-/- macrophages, facilitating accumulation of the hypoxic response protein, HIF-1α. Increased ROS and HIF-1α levels, as well as decreased activity of NRF2 in cells lacking BMAL1, resulted in increased production of the proinflammatory cytokine, IL-1β. The excessive prooxidant and proinflammatory phenotype of Bmal1-/- macrophages was rescued by genetic and pharmacological activation of NRF2, or through addition of antioxidants. Our findings uncover a clear role for the molecular clock in regulating NRF2 in innate immune cells to control the inflammatory response. These findings provide insights into the pathology of inflammatory conditions, in which the molecular clock, oxidative stress, and IL-1β are known to play a role.

Keywords: BMAL1; circadian clock; inflammation; macrophage; oxidative stress.


Conflict of interest statement

The authors declare no conflict of interest.

Figures

Fig. 1.
Fig. 1.
Rhythms in NRF2 levels and activity are disrupted with Bmal1 deletion. Bmal1+/+ and Bmal1−/− BMDMs were analyzed by TF-Seq. Bar charts reveal the relative activity of NRF2 in Bmal1+/+ and Bmal1−/− BMDMs following (A) 1 or (B) 4 h of LPS stimulation (n = 3). (C) Wild-type BMDMs were lysed and the samples were exposed to biotinylated primer sequences for the E-box site located in the Nrf2 promoter (WT E-box) or a mutated control of the E-box. The sequences were then isolated using streptavidin beads before performing an immunoblot for BMAL1. (D) Peritoneal cells were isolated from wild-type mice at 4-h intervals (ZT0, ZT4, ZT8, ZT12, ZT16, and ZT20) and Nrf2 mRNA was measured by qPCR. A cosinor regression model was used to test the null hypothesis that the amplitude of expression = 0. The presence of the red line indicates the presence of a significant rhythm (n= 3–6). (E) Bmal1+/+ and Bmal1−/− BMDMs were synchronized using 50% horse serum. RNA was extracted at 4-h intervals for 36 h and Nrf2 mRNA was measured by qPCR. A cosinor regression model was used to test the null hypothesis that the amplitude of expression = 0. The presence of the red line indicates the presence of a significant rhythm (n = 3). (F) Nrf2 mRNA was measured by qPCR in Bmal1+/+ and Bmal1−/− BMDMs following 24 h of LPS (100 ng/mL) (n = 4). (G) Immunoblot of NRF2 levels following 24 h of LPS (100 ng/mL) in Bmal1+/+ and Bmal1−/− BMDMs. Immunoblots are a representative of at least three independent experiments. Values provided below each lane indicate relative densitometry of each band. Statistical significance in graphs A and B was determined by false discovery rate (FDR); in D and E, by establishing a cosinor regression model; and in graph F, by one-way ANOVA. ***P ≤ 0.001.
Fig. 2.
Fig. 2.
NRF2 antioxidant targets are decreased with Bmal1 deletion. (A) Hmox1, (B) Gsr, and (C) Nqo1 mRNA was measured by qPCR in wild-type BMDMs transfected with scrambled siRNA or siRNA targeting Nrf2 following 24 h of LPS (n = 4–6). (D) Hmox1, (E) Gsr, and (F) Nqo1 mRNA was measured by qPCR in Bmal1+/+ and Bmal1−/− BMDMs following 24 h of LPS (n = 4–6). (G) Bmal1+/+ and Bmal1−/− BMDMs were left untreated or treated with LPS for 24 h before measuring total cell levels of GSH by luminescence (n = 3). All graphs displayed were analyzed by one-way ANOVA. *P ≤ 0.05, **P ≤ 0.01, and ***P ≤ 0.001.
Fig. 3.
Fig. 3.
Diurnal rhythms in ROS regulation. (A) Peritoneal cells were isolated from wild-type mice at ZT8 and ZT20. Cells were stained with a CD11b+ antibody and CellROX stain. ROS levels were then measured by mean fluoresence intensity (MFI) in the myeloid population by flow cytometry (n = 4–6). (B) Peritoneal cells were isolated from wild-type mice at ZT0 and ZT12. RNA was extracted and gene expression panels were used to measure fold change of oxidative stress pathway genes at ZT12 versus ZT0 (n = 3). (C) Bmal1+/+ and Bmal1−/− BMDMs were treated with LPS (100 ng/mL) for 24 h before staining with CellROX. ROS was then measured via flow cytometry (n = 4). (D) Bmal1+/+ and Bmal1−/− BMDMs were untreated or treated with LPS (100 ng/mL) for 24 h before staining with CellROX and MitoTracker green. The cells were imaged using confocal microscopy. Image shown is a representative of at least three independent experiments. Statistical significance of graph A was determined by unpaired Student’s t test. Statistical significance of C was determined by one-way ANOVA. *P ≤ 0.05 and **P ≤ 0.01.
Fig. 4.
Fig. 4.
Increased IL-1β production with Bmal1 deletion. (A) Wild-type C57Bl6 mice were injected with PBS or LPS (5 mg/kg) for 90 min at ZT8 or ZT20. Serum was isolated from whole blood and levels of IL-1β were measured by ELISA (n = 10–11). (B) Bmal1myeloid+/+ and Bmal1myeloid−/− mice were injected with PBS or LPS (5 mg/kg) for 90 min at ZT20. Serum was isolated from whole blood and levels of IL-1β were measured by ELISA (n = 6). (C and D) Wild-type BMDMs were transfected with scrambled siRNA or siRNA targeting Nrf2 and treated with LPS (100 ng/mL) for 24 h (n = 3), (C) Il1b mRNA was measured by qPCR, and (D) pro–IL-1β was measured by immunoblot. (E and F) Bmal1+/+ and Bmal1−/− BMDMs were treated with LPS (100 ng/mL) for 24 h, (E) Il1b mRNA was measured by qPCR (n = 8), and (F) pro–IL-1β was measured by immunoblot. (G and H) Bmal1+/+ and Bmal1−/− BMDMs were treated with LPS (100 ng/mL), (G) HIF-1α levels were measured by immunoblot, and (H) Phd3 mRNA was measured by qPCR (n = 4). Immunoblots presented are a representative of at least three independent experiments. Values provided below each lane indicate relative densitometry of each band. Statistical significance of AC, E, and H was determined by one-way ANOVA. *P ≤ 0.05, **P ≤ 0.01, and ***P ≤ 0.001.
Fig. 5.
Fig. 5.
Boosting NRF2 activity and limiting ROS rescues the IL-1β phenotype of Bmal1-deficient macrophages. Bmal1+/+ and Bmal1−/− BMDMs were transfected with scrambled siRNA or siRNA targeting Keap1 and treated with LPS (100 ng/mL) and (A) NRF2 and HIF-1α were detected by immunoblot following 8 and 24 h of LPS stimulation. (B) Il1b mRNA was measured by qPCR (n = 4). (C) Protein levels of pro–IL-1β were measured by immunoblot. Bmal1+/+ and Bmal1−/− BMDMs were pretreated with either 100 μM DEM or 10 mM NAC before LPS (100 ng/mL) stimulation. (D) Il1b mRNA was measured by qPCR (n = 3) and (E) pro–IL-1β protein levels were measured by immunoblot. Immunoblots presented are a representative of at least three independent experiments. Values provided below each lane indicate relative densitometry of each band. Statistical significance of all graphs was determined by one-way ANOVA. *P ≤ 0.05, **P ≤ 0.01, and ***P ≤ 0.001.
Fig. 6.
Fig. 6.
Schematic of proposed model. We observe that the core molecular clock component, BMAL1, is crucial in promoting Nrf2 transcription in myeloid cells. NRF2 can repress IL-1β through two possible mechanisms: direct repression of Il1b transcription or induction of antioxidant response elements. This second pathway results in ROS suppression, which reduces levels of HIF-1α binding to hypoxia response elements (HRE), preventing induction of Il1b transcription. Thus, the molecular clock directly controls NRF2 transcriptional activity and antioxidant capacity to regulate IL-1β in myeloid cells.

References

    1. Early JO, Curtis AM. Immunometabolism: Is it under the eye of the clock? Semin Immunol. 2016;28:478–490. - PubMed
    1. Hastings M, O’Neill JS, Maywood ES. Circadian clocks: Regulators of endocrine and metabolic rhythms. J Endocrinol. 2007;195:187–198. - PubMed
    1. Oliva-Ramírez J, Moreno-Altamirano MM, Pineda-Olvera B, Cauich-Sánchez P, Sánchez-García FJ. Crosstalk between circadian rhythmicity, mitochondrial dynamics and macrophage bactericidal activity. Immunology. 2014;143:490–497. - PMC - PubMed
    1. Gibbs JE, et al. The nuclear receptor REV-ERBα mediates circadian regulation of innate immunity through selective regulation of inflammatory cytokines. Proc Natl Acad Sci USA. 2012;109:582–587. - PMC - PubMed
    1. Nguyen KD, et al. Circadian gene Bmal1 regulates diurnal oscillations of Ly6C(hi) inflammatory monocytes. Science. 2013;341:1483–1488. - PMC - PubMed

Publication types

MeSH terms

LinkOut - more resources