. 2018 Dec;15(6):066023.
doi: 10.1088/1741-2552/aadbb1. Epub 2018 Aug 21.

Biophysically realistic neuron models for simulation of cortical stimulation

Affiliations

Biophysically realistic neuron models for simulation of cortical stimulation

Aman S Aberra et al. J Neural Eng. 2018 Dec.

Abstract

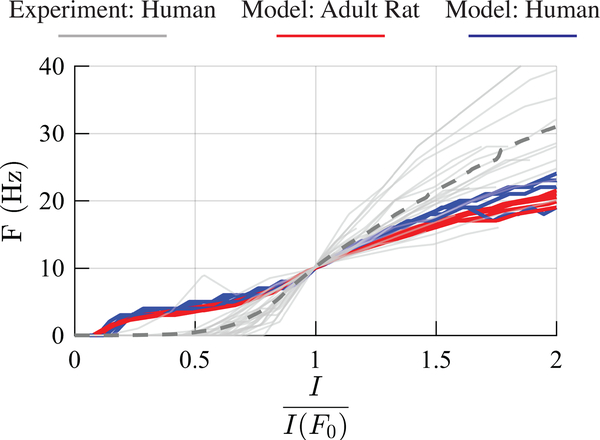
Objective: We implemented computational models of human and rat cortical neurons for simulating the neural response to cortical stimulation with electromagnetic fields.

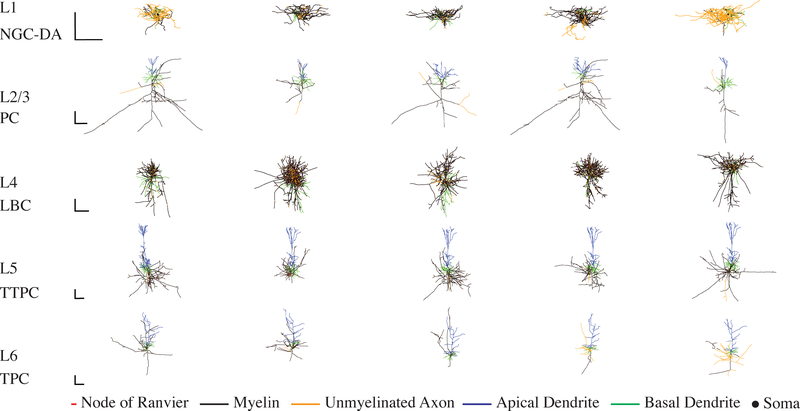
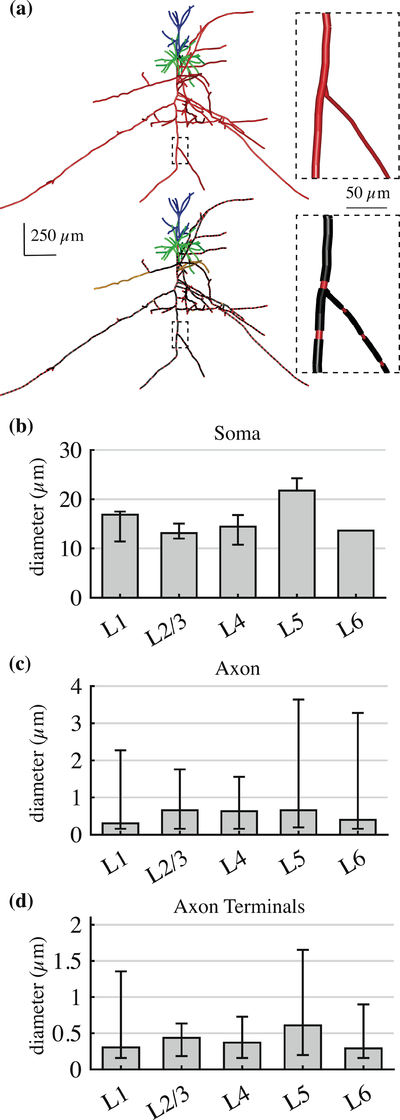
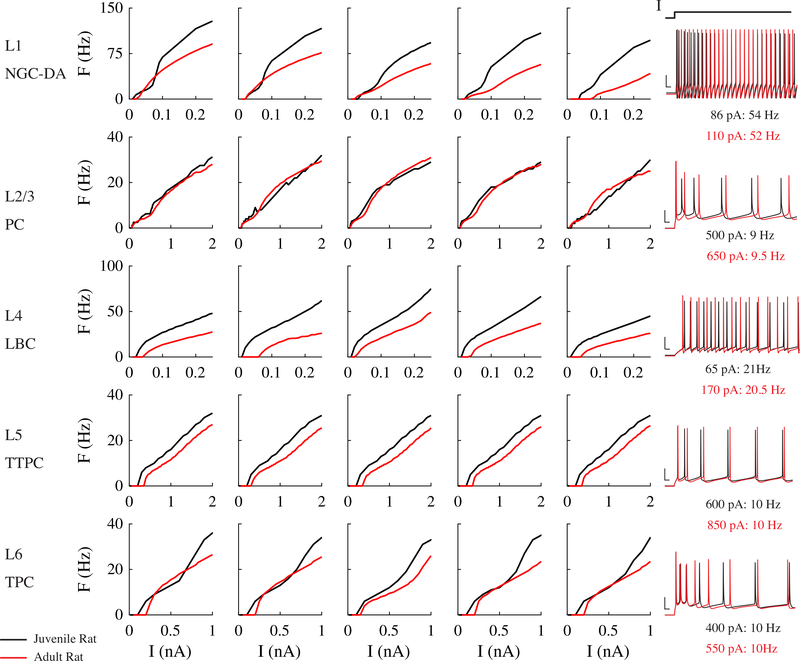
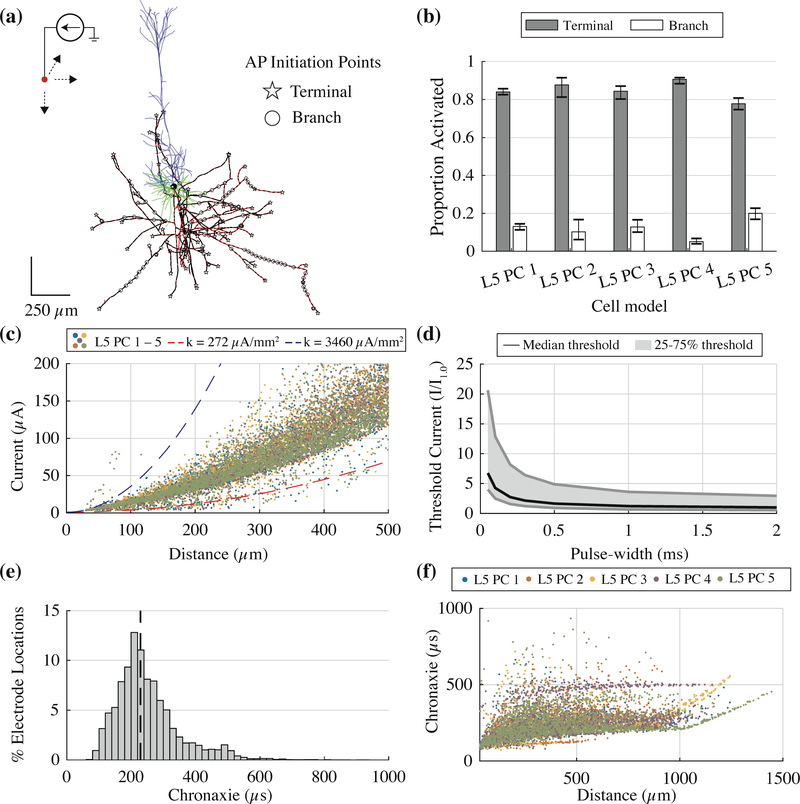
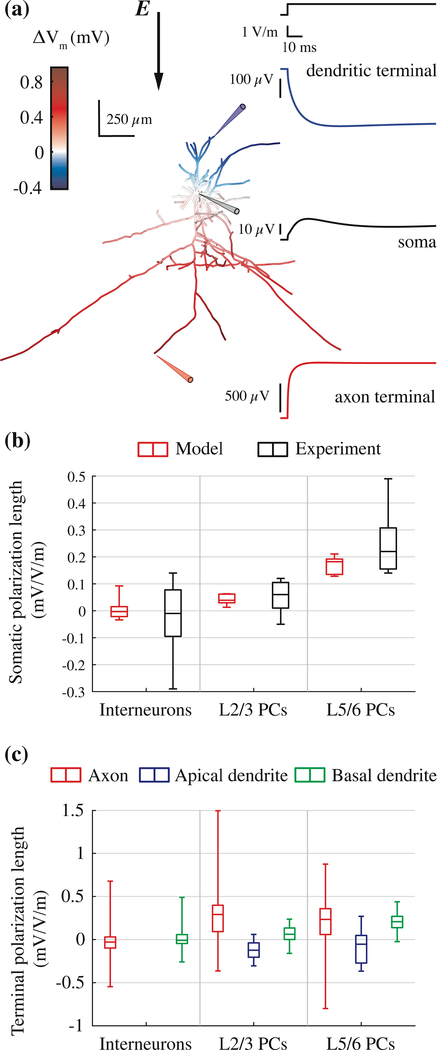
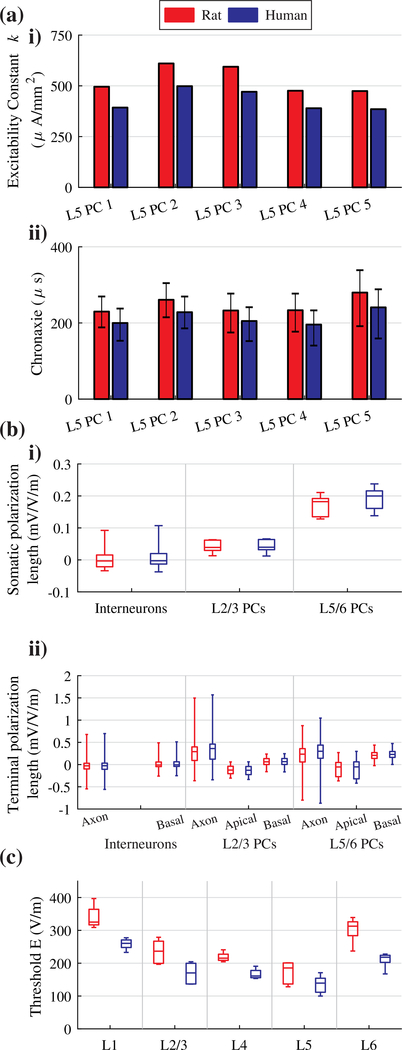
Approach: We adapted model neurons from the library of Blue Brain models to reflect biophysical and geometric properties of both adult rat and human cortical neurons and coupled the model neurons to exogenous electric fields (E-fields). The models included 3D reconstructed axonal and dendritic arbors, experimentally-validated electrophysiological behaviors, and multiple, morphological variants within cell types. Using these models, we characterized the single-cell responses to intracortical microstimulation (ICMS) and uniform E-field with dc as well as pulsed currents.

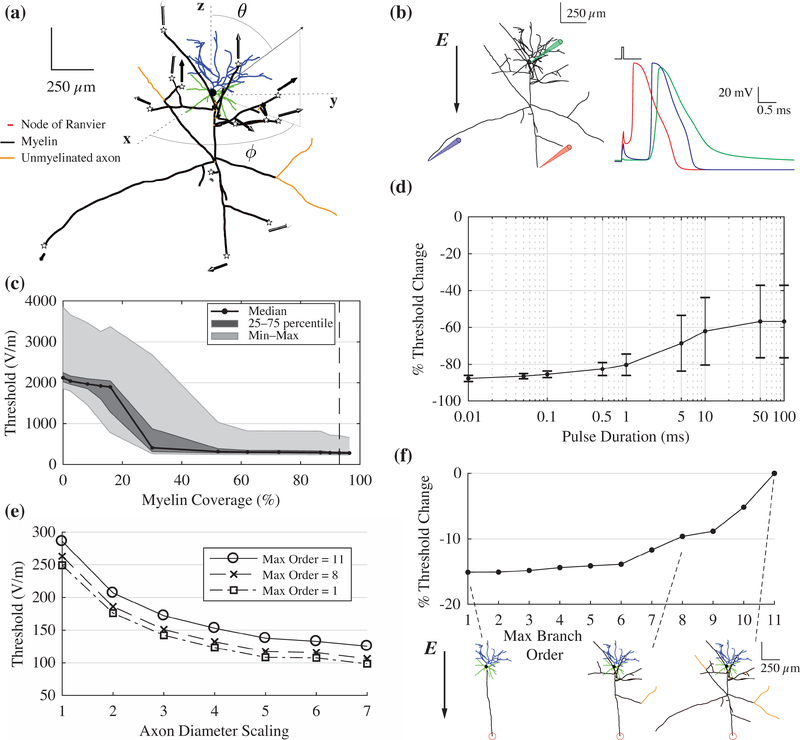
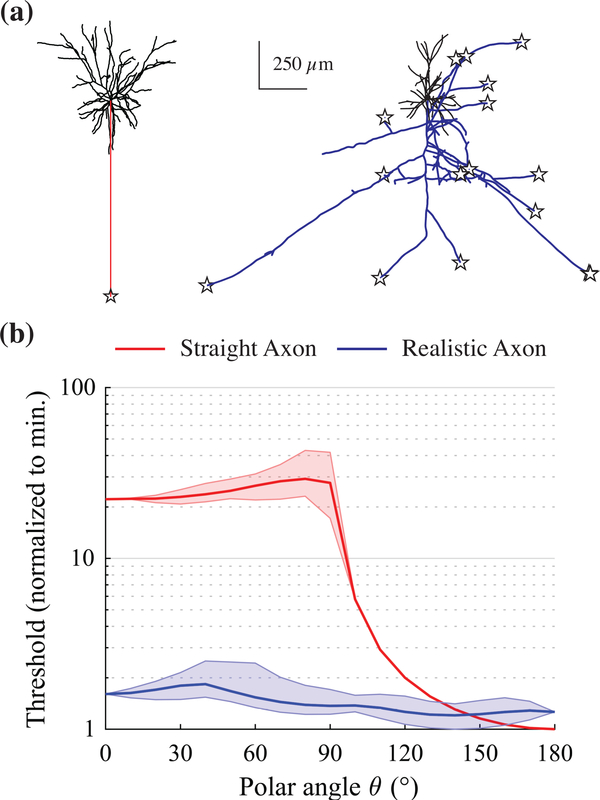
Main results: The strength-duration and current-distance characteristics of the model neurons to ICMS agreed with published experimental results, as did the subthreshold polarization of cell bodies and axon terminals by uniform dc E-fields. For all forms of stimulation, the lowest threshold elements were terminals of the axon collaterals, and the dependence of threshold and polarization on spatial and temporal stimulation parameters was strongly affected by morphological features of the axonal arbor, including myelination, diameter, and branching.

Significance: These results provide key insights into the mechanisms of cortical stimulation. The presented models can be used to study various cortical stimulation modalities while incorporating detailed spatial and temporal features of the applied E-field.


Figures

Figure 1.
Figure 1.. Morphology of model cortical neurons.
3D reconstructions of morphological cell types used in this study. Each row contains the 5 clones of each cell type drawn from the layer indicated on the left. Cell type abbreviations defined in Section 3.1. Adult rat versions shown here, with morphologies colored to indicate nodes of Ranvier (red), myelin (black), and unmyelinated axonal sections (yellow), as well as apical dendrites (blue) and basal dendrites (green). Scale bars = 250 μm.
Figure 2.
Figure 2.. Modifications to approximate adult rat cortical neurons.
(a) Myelinated axonal branches in example L2/3 PC. The myelination algorithm preserved the original geometry, but replaced existing sections with myelinated internodal sections and nodal sections according to the axon diameter. (b) – (d) Median diameter (± minimum/maximum across 5 clones within cell type) of (b) soma major axis, (c) all axonal compartments, and (d) axon terminal compartments.
Figure 3.
Figure 3.. Firing behavior in modified and original cortical model neurons.
Frequency-current (F-I) curves for original, juvenile rat Blue Brain models (black) and modified, adult rat models (red). Original models were unscaled and included only 60 μm axon initial segment (AIS). Modified models were scaled up in size to approximate adult rat cortical neurons and included myelinated axonal arbors, as described in Section 3.2. Temperature set to 34° C for modified models to match [29]. Each row includes the F-I curves for the 5 virtual clones and membrane potential recordings in the original and modified models at current amplitudes producing similar firing rates.
Figure 4.
Figure 4.. Firing behavior of human-scaled L2/3 PC model neurons.
F-I curves for the five adult rat (red) and human (blue) L2/3 PCs models, as well F-I curves for 25 human L2/3 PCs recorded in vitro [63]. Mean F-I curve for experimentally recorded neurons shown in dashed gray line. Current axis normalized to current amplitude producing reference firing rate F0 = 10 Hz.
Figure 5.
Figure 5.. Model L5 pyramidal cells reproduced experimental responses to ICMS.
(a) AP initiation sites for 0.2 ms pulse, all electrode positions, shown for L5 PC 1. (b) Mean proportion of AP initiation points at either axon terminal or branch across pulse durations (50 μs to 1 ms). Error bars are minimum and maximum. (c) Threshold current-distance plot for all five L5 pyramidal cells with 0.2 ms cathodic pulse. Each point represents the threshold for a different electrode location within the 3D grid and the distance from that electrode to the point of action potential initiation. The current-distance curves are plotted for current-distance constants of cat pyramidal tract cells [75]. (d) Strength-duration curves for median (black line) and 25 – 75 percentile thresholds (gray shaded region). Median chronaxie ± standard deviation was 229 ±101 μs. (e) Histogram of chronaxies at all electrode locations for 5 L5 PC models. Black dashed line indicates median chronaxie value (229 μs). (f) Chronaxies plotted against distance from electrode location to AP initiation site for 5 L5 PC models.
Figure 6.
Figure 6.. Model neurons reproduced experimental responses to subthreshold uniform E-field stimulation.
(a) Color plot of membrane polarization in example L2/3 PC at end of 100 ms uniform E-field directed downward (left) and recordings from a dendritic terminal, the soma, and an axonal terminal indicated by the colored probes (right). (b) Box-plots of somatic polarization lengths for downward Efield (θ = 180°) of model (red) and experimental data (black) from [6]. Experimental data from neurons with dendritic arbors cut during brain slice preparation were excluded. (c) Box-plots of terminal polarization lengths for axons, apical dendrites, and basal dendrites.
Figure 7.
Figure 7.. Threshold dependence on morphology with uniform E-field stimulation.
(a) Unique AP initiation sites (stars) overlaid on morphology of example L2/3 PC for full range of uniform E-field directions using 50 μs rectangular pulse. Arrows correspond to E-field direction for lowest-threshold AP initiation, with arrowhead color indicating the vector points out of the page (black) or into the page (white). (b) Membrane potential recordings from example L2/3 PC model neuron at AP threshold for 50 μs rectangular pulse with E-field direction indicated by black arrow. Recordings made from directly activated axon terminal, indirectly activated axon terminal and soma. (c) Threshold of L2/3 PC with 50 μs rectangular pulse across E-field directions as percent myelin coverage is varied (d) Percent change in threshold after adding myelin to axon of L2/3 PC (mean ± SD across E-field directions) for rectangular pulses of increasing duration. (e) Threshold E-field amplitude as diameter of axonal arbor uniformly scaled up for L2/3 PC with the three levels of arborization shown in (f): maximum axon order of 1 (square), 8 (cross), and 13 (open circle). Same E-field direction as in (b). (f) (top) Percent reduction in threshold for terminal activation (indicated by red circle) as axon collaterals were successively removed by decreasing branch order. (bottom) Neuron morphologies for maximum axon branch orders of 1, 8, and 11. Same E-field direction as in (b),
Figure 8.
Figure 8.. Threshold dependence on E-field direction with branched vs simplified axon morphology.
(a) Morphologies of L2/3 PC with branched axon (left) and with simplified, linear axon (right), with unique AP initiation sites overlaid as stars. Model with simplified axon drawn from [60] (b) Normalized threshold as polar angle θ of E-field direction varied. Dark middle line is mean threshold, and shaded region is range, across all azimuthal angles ϕ.
Figure 9.
Figure 9.. Human and rat model response to different stimulation modalities.
(a) ICMS results for rat (red) and human (blue) L5 PC models. i) Current-distance constant K fit for each L5 PC model using linear regression. Electrode locations within 30 μm of closest neural compartment and outside of 1 mm excluded. ii) Median chronaxie for each L5 PC model. Error bars correspond to standard deviation. (b) Box-plots of polarization lengths for downward E-field (θ = 180°), rat (red) and human (blue) model neurons. i) Somatic polarization lengths. ii) Terminal polarization lengths of axons, apical dendrites, and basal dendrites. (c) Box-plots of threshold amplitudes for 50 μs rectangular pulse across all Efield directions for rat (red) and human (blue) model neurons.

References

    1. Histed M H, Bonin V and Reid R C 2009. Direct Activation of Sparse, Distributed Populations of Cortical Neurons by Electrical Microstimulation Neuron 63 508–22 - PMC - PubMed
    1. Tehovnik E J and Slocum W M 2013. Two-photon imaging and the activation of cortical neurons Neuroscience 245 12–25 - PubMed
    1. Di Lazzaro V, Rothwell J C and Capogna M 2017. Noninvasive Stimulation of the Human Brain: Activation of Multiple Cortical Circuits Neurosci. 107385841771766 - PubMed
    1. Chakraborty D, Truong D Q, Bikson M and Kaphzan H 2017. Neuromodulation of Axon Terminals Cereb. Cortex 1–9 - PMC - PubMed
    1. Wongsarnpigoon A and Grill W M 2012. Computer-based model of epidural motor cortex stimulation: Effects of electrode position and geometry on activation of cortical neurons Clin. Neurophysiol. 123160–72 - PubMed

Publication types

LinkOut - more resources