. 2018 Aug 20;9(1):3329.
doi: 10.1038/s41467-018-05743-y.

Predicting soil thickness on soil mantled hillslopes

Affiliations

Predicting soil thickness on soil mantled hillslopes

Nicholas R Patton et al. Nat Commun. .

Abstract

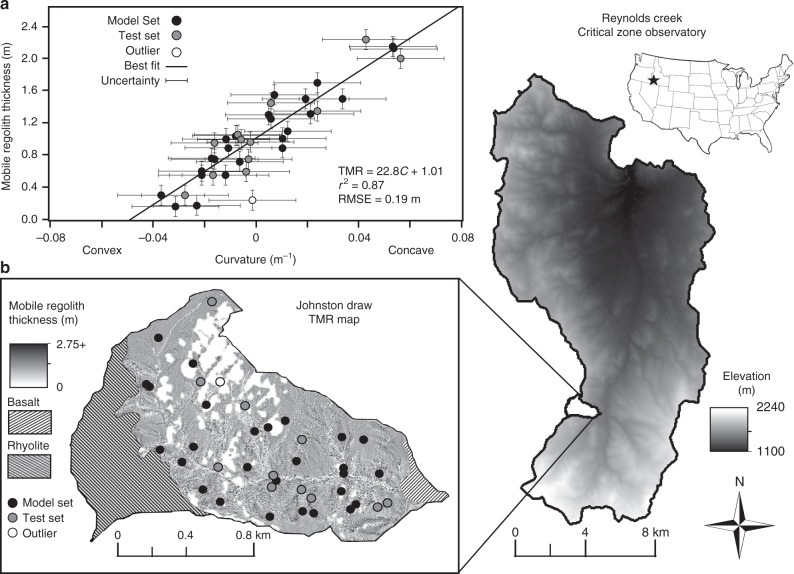
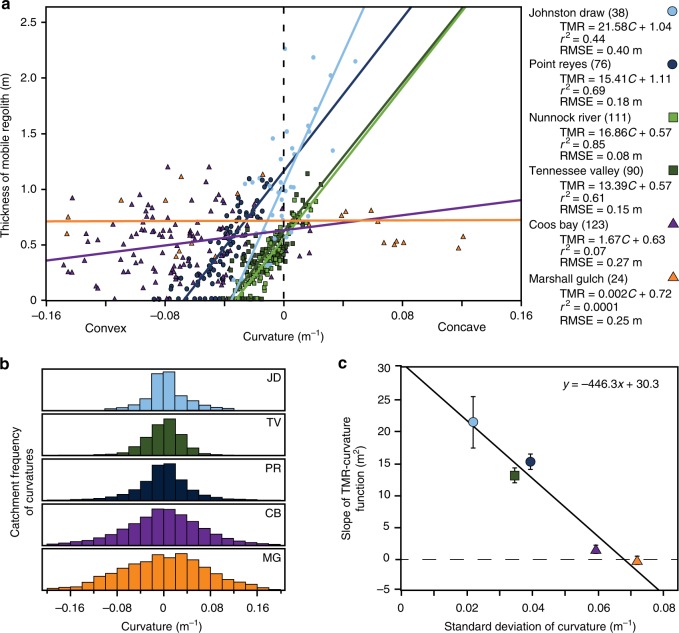
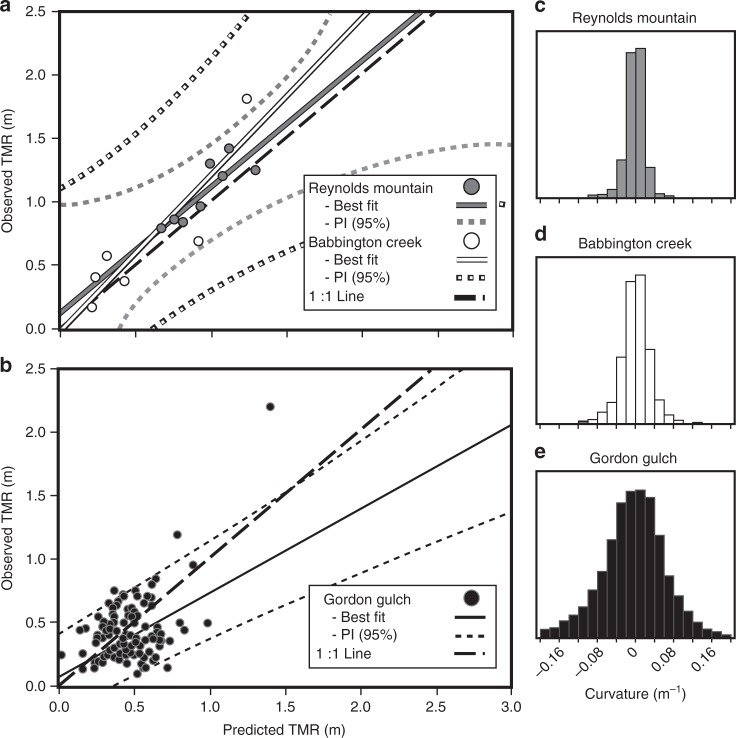
Soil thickness is a fundamental variable in many earth science disciplines due to its critical role in many hydrological and ecological processes, but it is difficult to predict. Here we show a strong linear relationship (r2 = 0.87, RMSE = 0.19 m) between soil thickness and hillslope curvature across both convergent and divergent parts of the landscape at a field site in Idaho. We find similar linear relationships across diverse landscapes (n = 6) with the slopes of these relationships varying as a function of the standard deviation in catchment curvatures. This soil thickness-curvature approach is significantly more efficient and just as accurate as kriging-based methods, but requires only high-resolution elevation data and as few as one soil profile. Efficiently attained, spatially continuous soil thickness datasets enable improved models for soil carbon, hydrology, weathering, and landscape evolution.


Conflict of interest statement

The authors declare no competing interests.

Figures

Fig. 1
Fig. 1
Curvature and thickness of the mobile regolith plot and predictive map. a The thickness of the mobile regolith (TMR) varies as a strong linear function of curvature (C) in Johnston Draw. Black dots represent randomly selected build dataset (70% of sites). Gray dots represent test set to validate the model. The white dot is a location that was excluded owing to proximity to both a rock outcrop and a stream channel. Uncertainty is reported as the standard error by the Method of Moments. b Predicted TMR map for the granitic portion of Johnston Draw derived from the TMR-curvature function using a 3 m Light Detection and Ranging (LiDAR)-derived digital elevation model. Darker shades indicate larger TMR (2.75 + m) and lighter shades indicate smaller TMR (0 m) including those areas excluded as rock outcrops or streams. Hatched areas indicate non-granitic portions of the watershed that were not modeled
Fig. 2
Fig. 2
Cross-site evaluation. a Cross-site evaluation of six catchments in which the thickness of the mobile regolith (TMR)-curvature (C) function is evaluated using a 5-m digital elevation model (DEM). b Depicts catchment curvature distributions based on a 5 m DEM centered on 0 m−1. c Cross-site comparison of the slope of the TMR-curvature function (and associated standard error) with the local standard deviation in catchment curvature (σc). Nunnock River (light green squares) dataset was not included in plots b or c due to the lack of high resolution Light Detection and Ranging (LiDAR) data; curvature estimates for Nunnock River in a were derived from reported local observations. Note, the curvature distributions are derived from all cells within the catchment’s DEM
Fig. 3
Fig. 3
Model validation. Validation of the thickness of the mobile regolith (TMR)-curvature (C) approach at Babbington Creek and Reynolds Mountain, Idaho (a) and Gordon Gulch, Colorado, USA (b). Solid white, gray, and black lines represent best-fit predicted vs. observed TMR values based on curvature calculated from a Light Detection and Ranging (LiDAR)-derived digital elevation model (DEM) and a single soil pit for Reynolds Mountain (c), Babbington Creek (d), and Gordon Gulch (e), respectively. Large dashed black lines represents the 1:1 predicted versus observed line. The best-fit slopes were not significantly different from one for Babbington Creek (|t| = 0.74 < critical t0.05,5 = 2.571) and Reynolds Mountain (|t| = 0.01 < critical t0.05,7 = 2.365), indicating unbiased models, whereas the slope was significantly lower than one for Gordon (p < 0.001, |t| = 3.64 < critical t0.05,162 = 1.974), indicating over-prediction with higher TMR than observed. Small white, gray, and black dotted lines represent the 95% prediction intervals (PI)

References

    1. Dixon JL, Heimsath AM, Amundson R. The critical role of climate and saprolite weathering in landscape evolution. Earth Surf. Process. Landf. 2009;34:1507–1521. doi: 10.1002/esp.1836. - DOI
    1. Heimsath AM, Dietrich WE, Nishiizumi K, Finkel RC. The soil production function and landscape equilibrium. Nature. 1997;388:358–361. doi: 10.1038/41056. - DOI
    1. Heimsath AM, Dietrich WE, Nishiizumi K, Finkel RC. Cosmogenic nuclide, topography, and the spatial variation of soil depth. Geomorphology. 1999;27:151–172. doi: 10.1016/S0169-555X(98)00095-6. - DOI
    1. Dietrich WE, Perron T. The search for a topographic signature of life. Nature. 2006;439:411–418. doi: 10.1038/nature04452. - DOI - PubMed
    1. Dietrich WE, Reiss R, Mei-Ling H, Montgomery DR. A process-based model for colluvial soil depth and shallow landsliding using digital elevation data. Hydrol. Process. 1995;9:383–400. doi: 10.1002/hyp.3360090311. - DOI

Publication types

LinkOut - more resources