. 2018 Sep;25(9):787-796.
doi: 10.1038/s41594-018-0116-7. Epub 2018 Aug 20.

Structural determinants of 5-HT2B receptor activation and biased agonism

Affiliations

Structural determinants of 5-HT2B receptor activation and biased agonism

John D McCorvy et al. Nat Struct Mol Biol. 2018 Sep.

Abstract

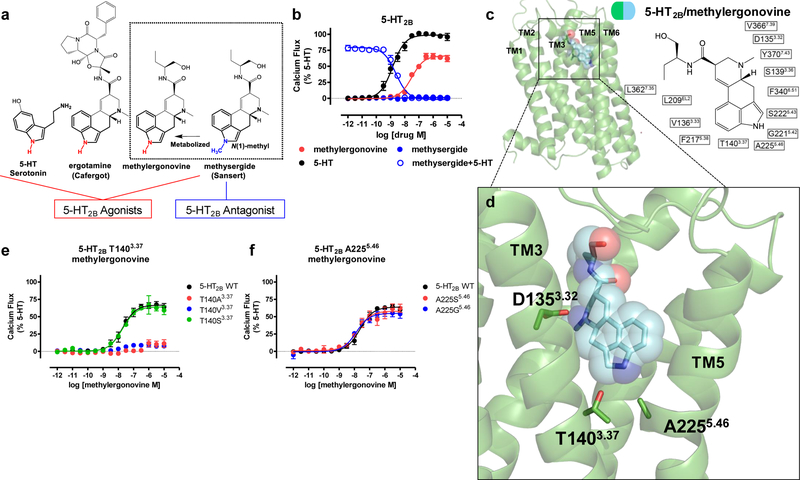
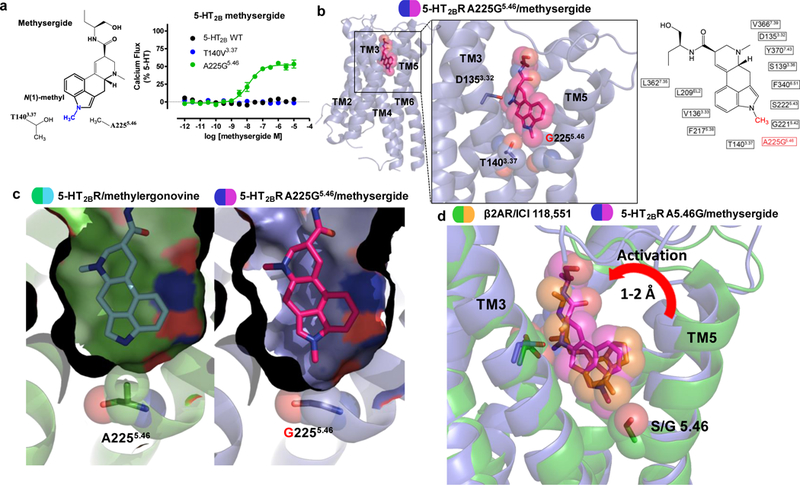
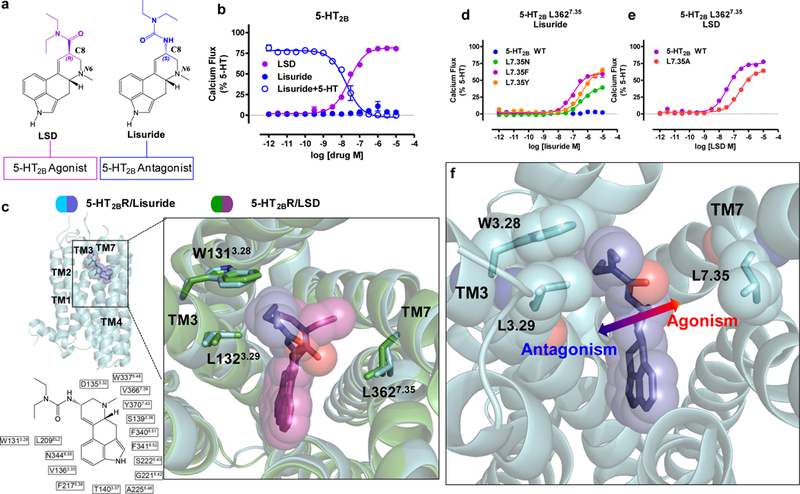
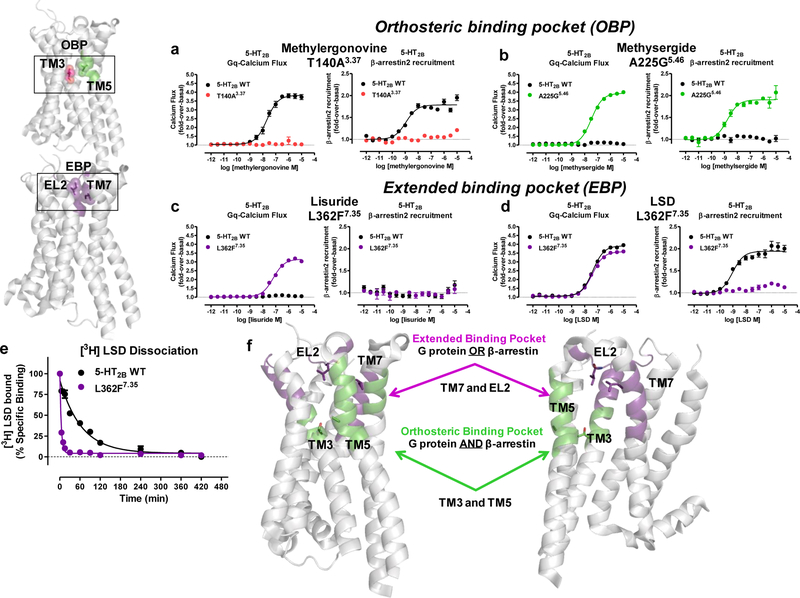
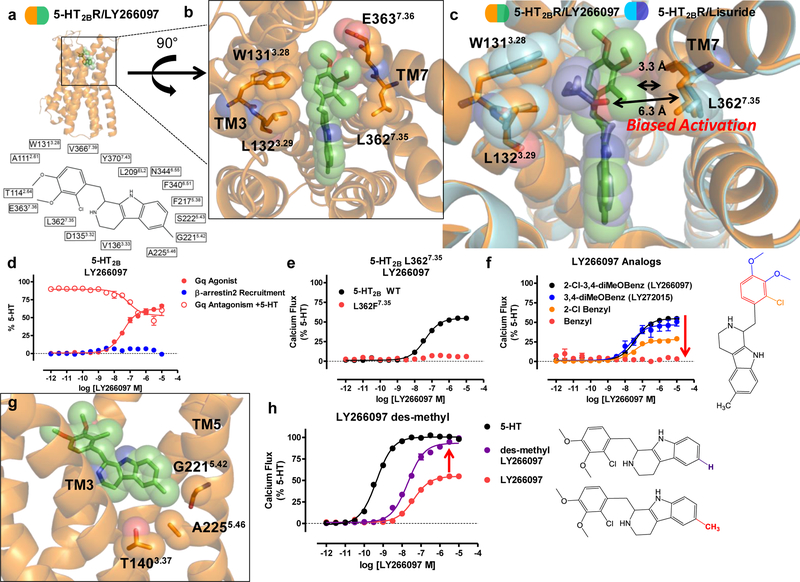
Serotonin (5-hydroxytryptamine; 5-HT) receptors modulate a variety of physiological processes ranging from perception, cognition and emotion to vascular and smooth muscle contraction, platelet aggregation, gastrointestinal function and reproduction. Drugs that interact with 5-HT receptors effectively treat diseases as diverse as migraine headaches, depression and obesity. Here we present four structures of a prototypical serotonin receptor-the human 5-HT2B receptor-in complex with chemically and pharmacologically diverse drugs, including methysergide, methylergonovine, lisuride and LY266097. A detailed analysis of these structures complemented by comprehensive interrogation of signaling illuminated key structural determinants essential for activation. Additional structure-guided mutagenesis experiments revealed binding pocket residues that were essential for agonist-mediated biased signaling and β-arrestin2 translocation. Given the importance of 5-HT receptors for a large number of therapeutic indications, insights derived from these studies should accelerate the design of safer and more effective medications.


Conflict of interest statement

Competing financial interests

The authors declare no competing financial interests

Figures

Figure 1.
Figure 1.. Structural insights into a 5-HT2B activation mechanism
Identification of an 5-HT2BR activation mechanism by the 5-HT2BR-methylergonovine structure a) Structure-activity-relationship of 5-HT2BR ergoline ligands comparing unsubstituted N(1)-H ligands (red) such as 5-HT, ergotamine, and methylergonovine to N(1)-methyl methysergide (blue) b) 5-HT2BR Gq calcium flux activity by 5-HT (black, EC50 = 1.4 nM, Emax = 100%), methylergonovine (red, EC50 = 31 nM, Emax = 66%) and lack of agonist activity by methysergide (blue, closed circles). Methysergide instead acts as a competitive antagonist (blue, open circles, IC50 = 2.4 nM) in response to 5-HT. c) Structure of methylergonovine (blue) at 5-HT2BR (green) with 2D ligand plots of nearby residues (PDB code: 6DRY). d) Close up of methylergonovine binding pose in the binding pocket highlighting D1353.32 interacting with the charged nitrogen of methysergide, and the indole N(1)-H interacting with both T1403.37 and A2255.46 in the orthosteric binding pocket. e) Methylergonovine Gq-mediated calcium flux agonist activity at T140A3.37 (red), T140V3.37 (blue), T140S3.37 (green, EC50 = 18 nM, Emax = 64%) relative to 5-HT2BR wild-type (WT, black, EC50 = 19 nM, Emax = 66%). f) Methylergonovine Gq-mediated calcium flux agonist activity at A225S5.46 (red, EC50 = 15 nM, Emax = 58%), A225G5.46 (blue, EC50 = 12 nM, Emax = 55%) relative to 5-HT2BR wild-type (WT, black, EC50 = 23 nM, Emax = 64%). Data in panels b, e, and f represent mean and S.E.M from three independent experiments (N=3) performed in triplicate.
Figure 2.
Figure 2.. Structure of a 5-HT2BR-A225G5.46 mutant designed to be activated by methysergide
Design and structure of a 5-HT2BR mutant to convert methysergide into an agonist. a) Design of mutation to convert methysergide into an agonist by accommodating the N(1)-methyl (blue) with vdW interaction by T140V3.37 or with space by A225G5.46. 5-HT2BR methysergide Gq-mediated calcium flux activity at 5-HT2BR wild-type (black), T140V3.37 (blue) and A225G5.46 (green, EC50 = 12 nM, Emax = 54%). Data represent mean and S.E.M from three independent experiments (N=3) performed in triplicate. b) Structure of the 5-HT2BR A225G5.46 mutant (blue) in complex with methysergide (purple) indicating that the N(1)-methyl is positioned toward residues T1403.37 and A2255.46 in the orthosteric binding pocket, which is also illustrated in 2D ligand plot of nearby residues (PDB code: 6DRZ). c) Space-filling comparison of the 5-HT2BR-methylergonovine and the 5-HT2BR- A225G5.46-methysergide structures indicating that the A225G5.46 mutant creates space to accommodate methysergide’s N(1)-methyl to achieve a similar pose as seen in the 5-HT2BR-methylergonovine structure. d) Comparison of the binding poses of the 5-HT2BR- A225G5.46-methysergide structure to the β2AR (green) in complex with the inverse agonist ICI 118,551 (orange) indicating a 1–2 Å shift difference in TM5 commonly observed in active versus inactive structures.
Figure 3.
Figure 3.. Structural basis for a 5-HT2B activation mechanism via the extended binding pocket
Identification of an activation mechanism via the extended binding pocket illuminated by the 5-HT2BR-lisuride structure. a) Comparison of the chemical structures of LSD to lisuride indicating LSD’s (R) diethylamide (purple) and lisuride’s (S)-diethylurea (blue) lead to either 5-HT2BR agonism or antagonism, respectively. b) 5-HT2BR Gq-mediated calcium flux activity indicating LSD partial Gq agonist activity (purple, EC50 = 40 nM, Emax = 82%), and lack of lisuride agonist activity (blue, closed circles), and instead demonstrating competitive antagonism by lisuride (blue, open circles, IC50 = 25 nM). c) Structure of lisuride (blue) at the 5-HT2BR (light blue) comparing LSD (purple) bound to 5-HT2BR (green) showing lisuride’s (S)-diethylurea wedged between TM3 residues W1313.28 and L1323.29 and making no contact with TM7 L3627.35 (PDB code: 6DRX). d) Lisuride Gq-mediated calcium flux activity at L362N7.35 (green, EC50 = 395 nM, Emax = 41%), L362Y7.35 (orange, EC50 = 465 nM, Emax = 69%), and L362F7.35 (purple, EC50 = 77 nM, Emax = 60%). e) LSD Gq-mediated calcium flux activity at L362A7.35 (red, EC50 = 340 nM, Emax = 67%) relative to 5-HT2BR wild-type (WT, purple, EC50 = 37 nM, Emax = 79%). Data in panels b, d, and e represent mean and S.E.M from three independent experiments (N=3) performed in triplicate. f) Schematic illustrating ligand contact with residue L3627.35 in TM7 in the extended binding pocket leads to 5-HT2BR activation.
Figure 4.
Figure 4.. Divergent actions on β-arrestin2 recruitment by OBP versus EBP mutations
Examination of β-arrestin2 recruitment activity at OBP T140A3.37 and A225G5.46 mutations versus EBP mutation L362F7.35. a) Methylergonovine Gq-mediated calcium flux (left panel) comparing T140A3.37 (red) to 5-HT2BR WT (black, EC50 = 21 nM). β-arrestin2 recruitment (right panel) comparing T140A3.37 (red) to 5-HT2BR WT (black, EC50 = 1.2 nM). b) Methysergide Gq-mediated calcium flux (left panel) comparing A225G5.46 (green, EC50 = 33 nM) to 5-HT2BR WT (black). β-arrestin2 recruitment (right panel) comparing A225G5.46 (green, EC50 = 1.7 nM) to 5-HT2BR WT (black). c) Lisuride Gq-mediated calcium flux (left panel) comparing L362F7.35 (purple, EC50 = 65 nM) to 5-HT2BR WT (black). β-arrestin2 recruitment (right panel) comparing L362F7.35 (purple) to 5-HT2BR WT (black). d) LSD Gq-mediated calcium flux (left panel) comparing L362F7.35 (purple, EC50 = 40 nM) to 5-HT2BR WT (black, EC50 = 42 nM). β-arrestin2 recruitment (right panel) comparing L362F7.35 (purple) to 5-HT2BR WT (black, EC50 = 0.97 nM). Data in panels a-d are expressed as fold-over-basal and represent mean and S.E.M from three independent experiments (N=3) performed in triplicate. e) LSD dissociation comparing 5-HT2BR wild-type (black, koff = 0.015 min−1) to the L362F7.35 mutant (purple, koff = 0.240 min−1). Data represent percent specific binding indicating mean and S.E.M from three independent experiments (N=3) performed in duplicate. f) Schematic comparing the location of the EBP residues L209EL2 and L3627.35 (purple), which can result in either Gq or β-arrestin2 recruitment preference, to the location of OBP residues T1403.37 and A2255.46 (green), which result in equal contributions to Gq activity and β-arrestin2 recruitment.
Figure 5.
Figure 5.. Structure of 5-HT2BR-LY266097 reveals TM7 as a trigger for biased signaling
Structure of 5-HT2BR in complex with LY266097 reveals determinants of ligand bias via TM7 a) 5-HT2BR (orange) in complex with LY266097 (green) with 2D ligand plot of nearby residues (PDB code: 6DS0). b) View from the top of the receptor showing 2-chloro-3,4-dimethoxybenzyl substitution of LY266097 is oriented in close proximity to residue L3627.35 in TM7. c) Alignment of the 5-HT2BR-LY266097 and 5-HT2BR-lisuride structures showing that LY266097’s 2-chloro-3,4-dimethoxybenzyl substitution is within 3.3 Å from L3627.35, whereas lisuride’s (S)-diethylurea is further away at 6.3 Å from L3627.35. d) Profiling of LY266097 for ligand bias showing partial Gq agonist activity (red closed circles, EC50 = 37 nM, Emax = 62%) and partial antagonist activity (red open circles, IC50 = 78 nM), but no β-arrestin2 recruitment activity (blue). e) LY266097 Gq-mediated calcium flux activity comparing L3627.35 (red) to 5-HT2BR wild-type (WT, black, EC50 = 41 nM, Emax = 54%). f) Gq-mediated calcium flux activity of benzyl substituted LY266097 analogs, 3,4-diMeOBenzyl (blue, EC50 = 24 nM, Emax = 46%), 2-ClBenzyl (orange, EC50 = 35 nM, Emax = 28%), and unsubstituted Benzyl (red). g) 5-HT2BR-LY266097 structure shows methyl substitution on the tetrahydro-beta-carboline scaffold interacts with the 5-HT2-specific residue G2215.42. h) Gq-mediated calcium flux activity of des-methyl LY266097 analog (purple, EC50 = 20 nM, Emax = 93%) results in near full agonist activity compared to 5-HT (black, EC50 = 0.7 nM) and LY266097 (red, EC50 = 41 nM, Emax = 54%). Data in panels d, e, f, and h represent mean and S.E.M from three independent experiments (N=3) performed in triplicate.

References

    1. Berger M, Gray JA & Roth BL The expanded biology of serotonin. Annu Rev Med 60, 355–66 (2009). - PMC - PubMed
    1. McCorvy JD & Roth BL Structure and function of serotonin G protein-coupled receptors. Pharmacol Ther 150, 129–42 (2015). - PMC - PubMed
    1. Allen JA & Roth BL Strategies to discover unexpected targets for drugs active at G protein-coupled receptors. Annu Rev Pharmacol Toxicol 51, 117–44 (2011). - PubMed
    1. Vickers SP, Clifton PG, Dourish CT & Tecott LH Reduced satiating effect of d-fenfluramine in serotonin 5-HT(2C) receptor mutant mice. Psychopharmacology (Berl) 143, 309–14 (1999). - PubMed
    1. Roth BL Drugs and valvular heart disease. N Engl J Med 356, 6–9 (2007). - PubMed

Publication types