. 2018 Aug 20;9(1):3326.
doi: 10.1038/s41467-018-05809-x.

Major upwelling and overturning in the mid-latitude F region ionosphere

Affiliations

Major upwelling and overturning in the mid-latitude F region ionosphere

David Hysell et al. Nat Commun. .

Abstract

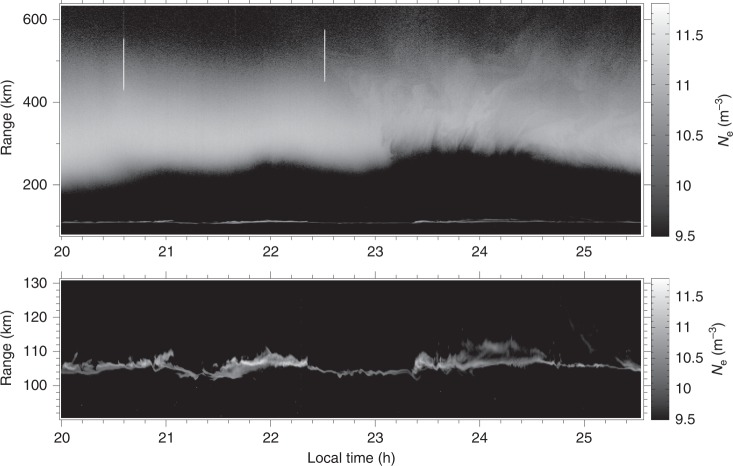
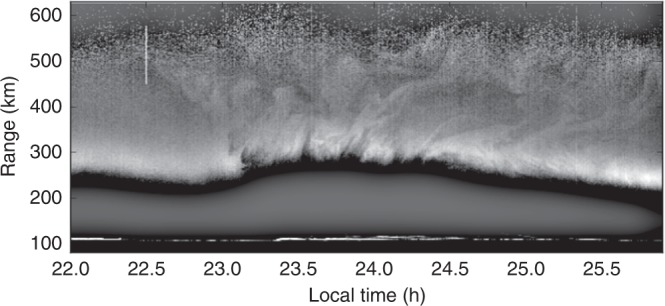
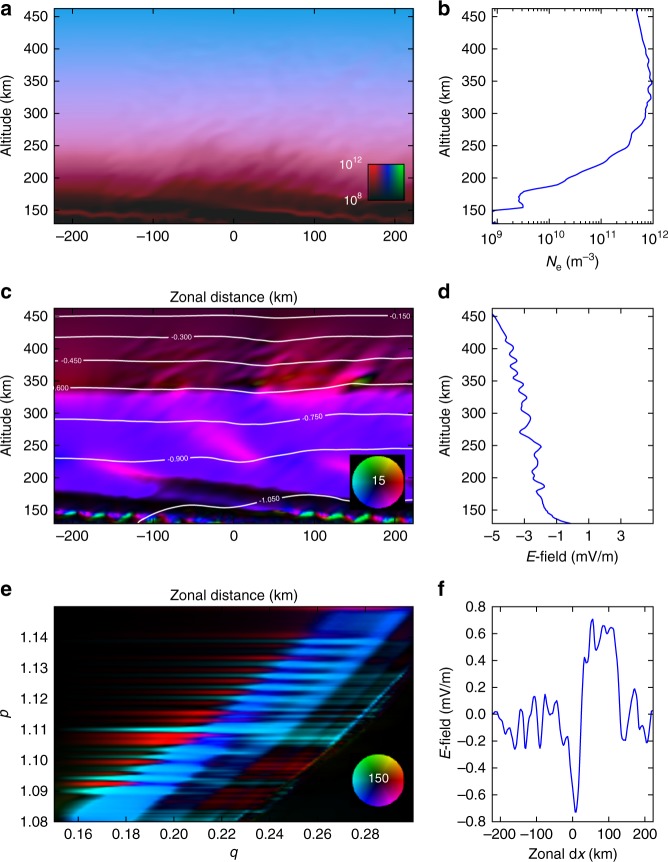
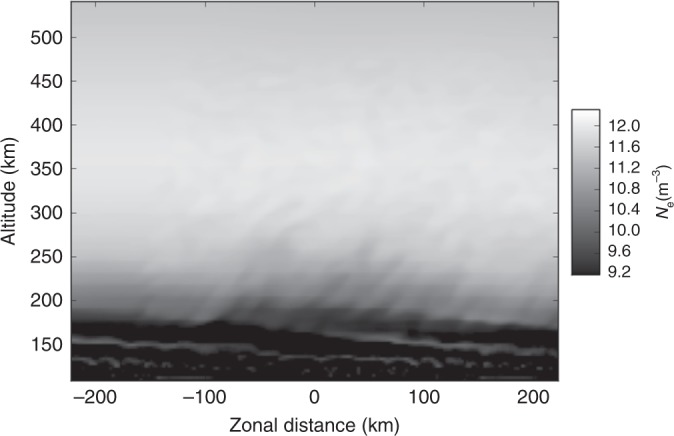
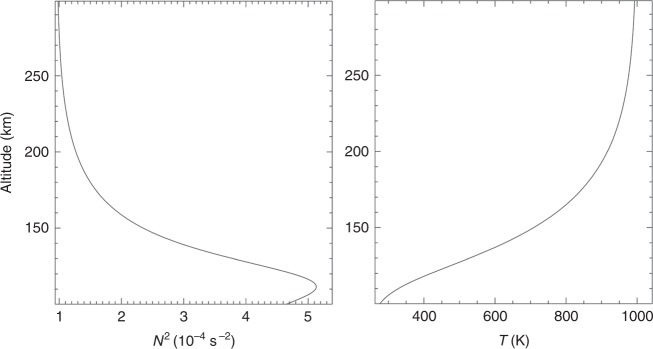
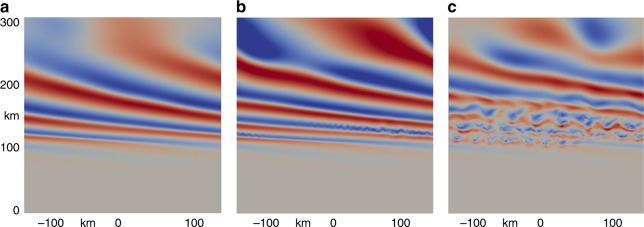
Profiles of the electron number density in the ionosphere are observed at the Arecibo Radio Observatory in Puerto Rico on a regular basis. Here, we report on recent observations showing anomalous irregularities in the density profiles at altitudes >~300 km. The irregularities occurred during a period of "mid-latitude spread F," a space-weather phenomenon relatively common at middle latitudes in summer months characterized by instability and electron density irregularities in the bottomside of the ionospheric F layer. Remarkably, electron density irregularities extended well above the layer, through the ionization peak and into the topside which is regarded as being stable. Neither the neutral atmosphere nor the ionosphere is thought to be able to support turbulence locally at this altitude. A numerical simulation is used to illustrate how a combination of atmospheric and plasma dynamics driven at lower altitudes could explain the phenomenon.


Conflict of interest statement

The authors declare no competing interests.

Figures

Fig. 1
Fig. 1
Electron number density on the evening of 30 July 2016, represented as a function of altitude and local time in grayscale format. The figure shows both the E and F regions on the same scale and the E region in an expanded scale
Fig. 2
Fig. 2
Enhanced version of the topside ionospheric irregularities from the latter portion of the event. A low-pass filter (Gaussian with a standard deviation of 100 pixels) was applied to the original image, and the difference between the filtered and unfiltered images was then plotted. Despite having units of per cubic meter, the quantity being plotted is not strictly electron density, and the grayscale is arbitrary
Fig. 3
Fig. 3
State parameters derived from incoherent scatter measurements using dual radar beams. a Line-of-sight E-region plasma drift profiles measured at zenith. b Average line-of-sight F-region plasma drifts measured at zenith. c Line-of-sight E-region plasma drift profiles measured off zenith. d Average line-of-sight F-region plasma drifts measured off zenith. e E-region temperature profiles. f Average F-region vector plasma drifts. Here the red, green, and blue lines indicate drifts parallel to the geomagnetic field, perpendicular and eastward, and perpendicular and upward/northward, respectively. g E-region zonal wind profiles. h E-region meridional wind profiles. i E-region vertical wind profiles. The bottom three panels reflect conditions within just the third patchy Es layer
Fig. 4
Fig. 4
Representative images of radar echoes due to coherent scatter from plasma density irregularities in Es layers near 110-km altitude at 2324.5 LT. The brightness of the image pixels specifies the echo signal-to-noise ratio on a decibel scale. The hues reflect Doppler velocity, with red (blue) hues denoting drifts away from (toward) the radar located on St. Croix, USVI
Fig. 5
Fig. 5
Results from the ionosphere simulation after 25 min of ionospheric evolution. a Plasma number density, with red, blue, and green hues representing molecular ions, atomic ions, and protons, respectively, in the plane perpendicular to B in a 2D cut through the center of the model volume. b Electron density profile through the center of the top left panel. c Current density in μA m−2 according to the color wheel, also in a perpendicular-to-B cut through the center of the model volume. White contours are equipotential curves which are streamlines of the flow. d Electric field profile through the center of the middle left panel. e Meridional current density in μA m−2 according to the color wheel. f Zonal electric field in the equatorial plane in a cut through the center of the model volume. The color wheels indicate the magnitude and direction of the current density relative to the maximum value of either 15 or 150 nA m−2 full scale
Fig. 6
Fig. 6
Detailed view of a vertical cut through the simulated electron density after 25 min of simulation time in grayscale format
Fig. 7
Fig. 7
Profiles of N2 and T employed for the GW simulation. N2 and T at lower altitudes asymptote to 4 × 10−4 s−2 and 240 K, respectively
Fig. 8
Fig. 8
Cross-sections of GW and KHI u′. At a 138, b 155, and c 172 min after initiation of the GW packet at lower altitudes. Maximum u′ is approximately 150 ms−1. The dominant KHI horizontal scales at the final time are ∼30–40 km

References

    1. Salpeter EE. Phys. Rev. 1960;120:1528. doi: 10.1103/PhysRev.120.1528. - DOI
    1. Fejer JA. Can. J. Phys. 1960;38:1114. doi: 10.1139/p60-119. - DOI
    1. Dougherty JP, Farley DT. Proc. R. Soc. 1960;A259:79. doi: 10.1098/rspa.1960.0212. - DOI
    1. Farley DT, Dougherty JP, Barron DW. Proc. R. Soc. Lond. A. 1961;263:238. doi: 10.1098/rspa.1961.0158. - DOI
    1. Fejer, J. A. Scattering of radio waves by an ionized gas in thermal equilibrium in the presence of a uniform magnetic field. Can. J. Phys. 39, 716–740 (1961).

Publication types

LinkOut - more resources