Clinical Trial
. 2018 Sep;24(9):1351-1359.
doi: 10.1038/s41591-018-0138-z. Epub 2018 Aug 20.

De novo NAD+ biosynthetic impairment in acute kidney injury in humans

Affiliations
Clinical Trial

De novo NAD+ biosynthetic impairment in acute kidney injury in humans

Ali Poyan Mehr et al. Nat Med. 2018 Sep.

Abstract

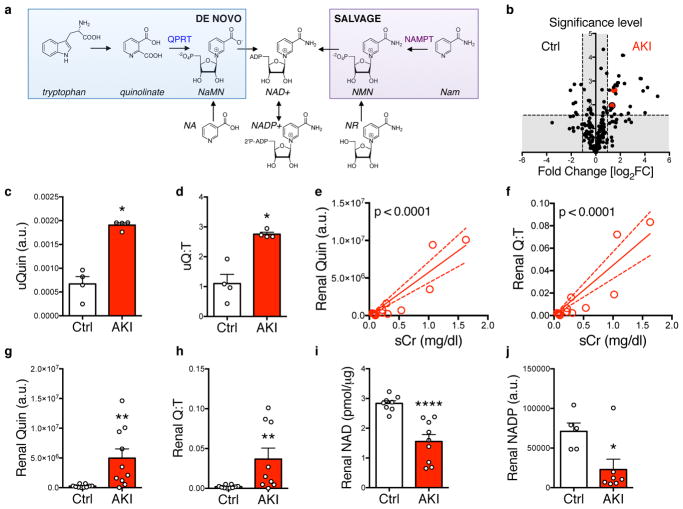
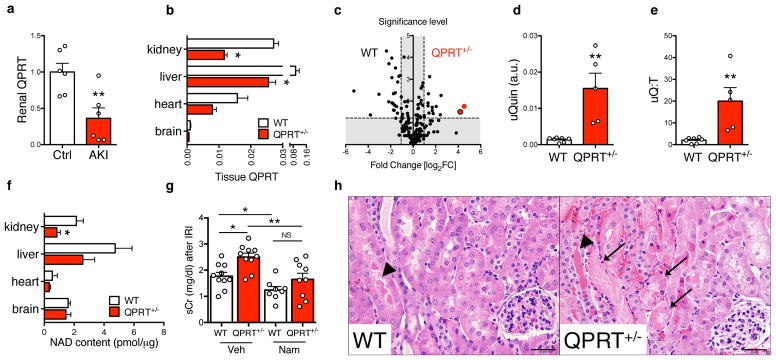
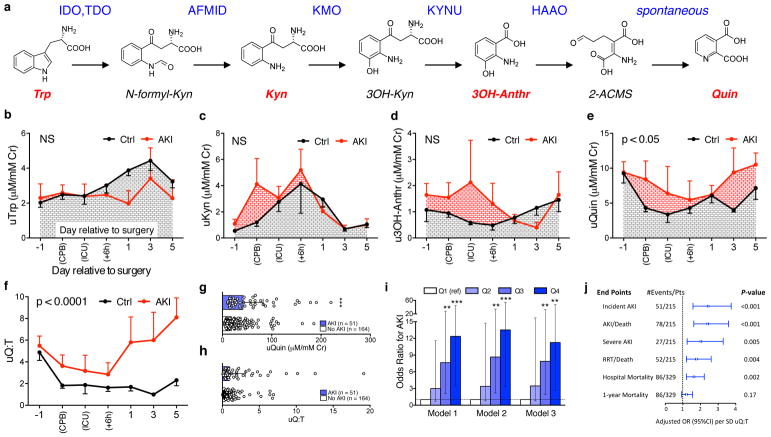
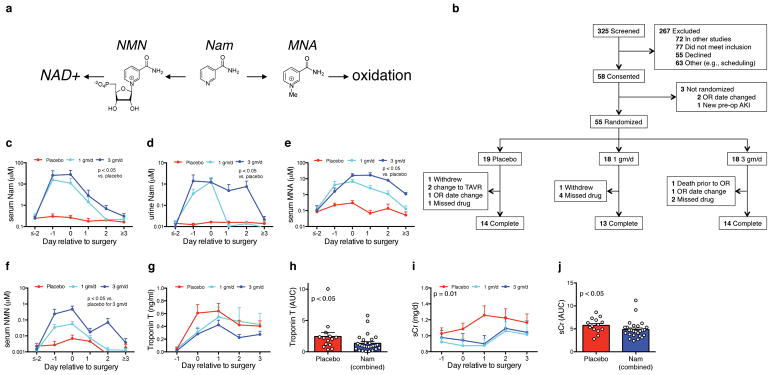
Nicotinamide adenine dinucleotide (NAD+) extends longevity in experimental organisms, raising interest in its impact on human health. De novo NAD+ biosynthesis from tryptophan is evolutionarily conserved yet considered supplanted among higher species by biosynthesis from nicotinamide (NAM). Here we show that a bottleneck enzyme in de novo biosynthesis, quinolinate phosphoribosyltransferase (QPRT), defends renal NAD+ and mediates resistance to acute kidney injury (AKI). Following murine AKI, renal NAD+ fell, quinolinate rose, and QPRT declined. QPRT+/- mice exhibited higher quinolinate, lower NAD+, and higher AKI susceptibility. Metabolomics suggested an elevated urinary quinolinate/tryptophan ratio (uQ/T) as an indicator of reduced QPRT. Elevated uQ/T predicted AKI and other adverse outcomes in critically ill patients. A phase 1 placebo-controlled study of oral NAM demonstrated a dose-related increase in circulating NAD+ metabolites. NAM was well tolerated and was associated with less AKI. Therefore, impaired NAD+ biosynthesis may be a feature of high-risk hospitalizations for which NAD+ augmentation could be beneficial.


Conflict of interest statement

AUTHOR INFORMATION AND COMPETING INTERESTS

  1. S.M.P. is listed as an inventor on disclosures filed by Beth Israel Deaconess Medical Center pertaining to NAD+.

Figures

Figure 1
Figure 1. Renal and urinary quinolinate elevation in ischemic AKI
(a) NAD+ biosynthetic pathways: (1) “de novo” from tryptophan (Trp) through the intermediate quinolinate (Quin); (2) via a “salvage” pathway from nicotinamide (Nam); (3) from nicotinic acid (NA); and (4) from nicotinamide riboside (NR). QPRT = quinolinate phosphoribosyltransferase. NAMPT = Nam phosphoribosyltransferase. NaMN = nicotinate mononucleotide, NMN = nicotinamide mononucleotide. (b) Volcano plot comparing urinary metabolites (n = 204) in mice 24h after sham operation or transient bilateral renal ischemia (AKI) (n = 4 animals/group). Vertical dashed lines indicate threshold for two-fold abundance difference. Horizontal dashed line indicates p = 0.05 threshold. X axis = log2[fold change for right condition/left condition]. Red dot = quinolinate, red dot with black border = quinolinate/tryptophan ratio. Y axis = -log10[p-value]. P-value computed by two-sided unpaired t-test without adjustment for multiple comparisons. (c,d) Urinary quinolinate (uQuin, a.u. = arbitrary unit) and urinary quinolinate/tryptophan (uQ:T) ratio from (b). (e,f) Renal tissue quinolinate and quinolinate/tryptophan (Q:T) ratio as a function of serum creatinine (sCr) determined 24h after no operation, sham operation or varying durations of transient renal ischemia (n = 13 animals). Correlations by Pearson method. (g,h) Renal tissue quinolinate content and renal quinolinate/tryptophan ratio in controls or mice 24h after 25 minutes transient renal ischemia (n = 10/group). (i,j) Renal tissue NAD+ (n = 8,9 respectively) and NADP+ content (n = 5,7 respectively) in controls or mice 24h after transient renal ischemia. Data in c,d,g–j displayed as mean ± SEM; pairwise comparisons by Mann-Whitney with two-sided *p < 0.05, **p < 0.01, ****p < 0.0001.
Figure 2
Figure 2. QPRT mediates resistance to experimental AKI
(a) Mouse renal QPRT mRNA 24h after transient ischemia (n = 6 animals/group). (b) QPRT mRNA in littermate controls (WT) vs. QPRT+/− mice (n =5 animals/group). (c) Volcano plot comparing urinary metabolites (n = 204) in littermate controls (WT = 4 animals) vs. QPRT+/− mice (n = 5 animals). Vertical dashed lines indicate threshold for two-fold abundance difference. Horizontal dashed line indicates p = 0.05 threshold. X axis = log2[fold change for right condition/left condition]. Red dot = quinolinate, red dot with black border = quinolinate/tryptophan ratio. Y axis = -log10[p-value]. P-value computed by two-sided unpaired t-test without adjustment for multiple comparisons. (d,e) Urinary quinolinate (uQuin, a.u. = arbitrary unit) and urinary quinolinate/tryptophan (uQ:T) ratio from (c). (f) Tissue NAD+ content in littermate controls (WT) vs. QPRT+/− mice (n =5 animals/group). (g) Renal function 24h after transient renal ischemia in littermate controls (WT) vs. QPRT+/− mice receiving vehicle or Nam (400 mg/kg ip) −24h, −1h, and +4–6h relative to surgery (n = 10, 10, 8, and 9 animals/group respectively). (h) Representative examples from 3 independent animals per group of intratubular cast (arrowhead) and tubular necrosis (arrows) 24h after transient renal ischemia in littermate controls (WT) vs. QPRT+/− mice. Scale bar = 20 μm. Data in a,b,d–f,g displayed as mean ± SEM; pairwise comparisons by Mann-Whitney with two-sided *p < 0.05, **p < 0.01.
Figure 3
Figure 3. Urinary quinolinate/tryptophan (uQ:T) elevation in human AKI
(a) De novo biosynthesis of NAD+ from tryptophan. IDO=indole dioxygenase; TDO-tryptophan dioxygenase; AFMID = arylformamidase; KMO = kynurenine monoxygenase; KYNU = kynureninase; HAAO = hydroxyanthranilate dioxygenase; Quinolinate is then ribosylated by QPRT = quinolinate phosphoribosyltransferase. (b–f) Urinary metabolites in cardiac surgery patients. Measurements were compared by time relative to cardiopulmonary bypass and whether subjects developed AKI (n=6/group). CPB = during cardiopulmonary bypass. ICU = immediate post-operative period during which patients were still intubated for mechanical ventilation. +6h = 6 hours since surgery completion. Otherwise, times are day relative to surgery. For b–f, significance was assessed by two-way ANOVA with two-sided p-value indicating treatment effect and data displayed as mean ± SEM. (g–i) Urinary metabolites in a prospective cohort study of ICU patients (n = 215 subjects, 51 of whom subsequently developed AKI and 164 without AKI). (g,h) Urinary quinolinate and uQ:T in those who did or did not develop AKI. Data displayed as median ± interquartile range and compared by Wilcoxon Rank Sum test. (i) Odds ratios for incident AKI (n = 215 subjects) according to quartiles of uQ:T determined by multivariate logistic regression. Model 1 is unadjusted. Model 2 is adjusted for the following demographics and comorbidities: age, gender, race, baseline estimated glomerular filtration rate, hypertension, and diabetes mellitus. Model 3 is further adjusted for the following severity of illness covariates: ICU type, need for mechanical ventilation, and APACHE II score. Quartile 1 (Q1) was the reference in all models. Error bars for 95% confidence interval. (j) Forest plot for incident AKI and other outcomes as listed per standard deviation (SD) of log-transformed uQ:T. Error bars for 95% confidence interval. Two-sided **p < 0.01, ***p < 0.001.
Figure 4
Figure 4. Participants and outcomes of oral Nam Phase 1 pilot study in cardiac surgery patients
(a) Nam can be converted to NAD+ through the intermediate nicotinamide mononucleotide (NMN) or methylated and oxidized for excretion through the intermediate N1-methyl nicotinamide (MNA). (b) Flow diagram for participants in oral Nam Phase 1 pilot study (clinicaltrials.gov entry NCT02701127). (c–f) Serum Nam, urine Nam, serum MNA, and serum NMN temporal profiles by treatment arm with data displayed as mean ± SEM. N per group as indicated in (b). P-values for c–f are pairwise Mann-Whitney comparisons of areas under the curve (AUCs, μM * days) for each treatment arm relative to placebo. For f, only the 3 gm/d arm was significantly different vs. placebo. (g,h) Temporal profiles of the cardiac injury marker Troponin T by treatment arm displayed as mean ± SEM and AUCs (ng/ml * days) with treatment groups combined (n = 14 in placebo, n = 27 in Nam treatment groups combined). (i,j) Serum creatinine (sCr) by treatment arm displayed as mean ± SEM and AUCs (mg/dl * days) with treatment groups combined (n = 14 in placebo, n = 27 in Nam treatment groups combined). AUCs for troponin T and sCr were compared to placebo by Mann-Whitney.

Comment in

References

    1. Bonkowski MS, Sinclair DA. Slowing ageing by design: the rise of NAD+ and sirtuin-activating compounds. Nature reviews Molecular cell biology. 2016;17:679–690. - PMC - PubMed
    1. Canto C, Menzies KJ, Auwerx J. NAD(+) Metabolism and the Control of Energy Homeostasis: A Balancing Act between Mitochondria and the Nucleus. Cell metabolism. 2015;22:31–53. - PMC - PubMed
    1. Ternes CM, Schonknecht G. Gene transfers shaped the evolution of de novo NAD+ biosynthesis in eukaryotes. Genome Biol Evol. 2014;6:2335–2349. - PMC - PubMed
    1. Collins PB, Chaykin S. The management of nicotinamide and nicotinic acid in the mouse. The Journal of biological chemistry. 1972;247:778–783. - PubMed
    1. Krehl WA, Teply LJ, Sarma PS, Elvehjem CA. Growth-Retarding Effect of Corn in Nicotinic Acid-Low Rations and Its Counteraction by Tryptophane. Science. 1945;101:489–490. - PubMed

Publication types

MeSH terms