. 2018 Sep;19(9):954-962.
doi: 10.1038/s41590-018-0185-0. Epub 2018 Aug 20.

Endogenous glucocorticoids control host resistance to viral infection through the tissue-specific regulation of PD-1 expression on NK cells

Affiliations

Endogenous glucocorticoids control host resistance to viral infection through the tissue-specific regulation of PD-1 expression on NK cells

Linda Quatrini et al. Nat Immunol. 2018 Sep.

Abstract

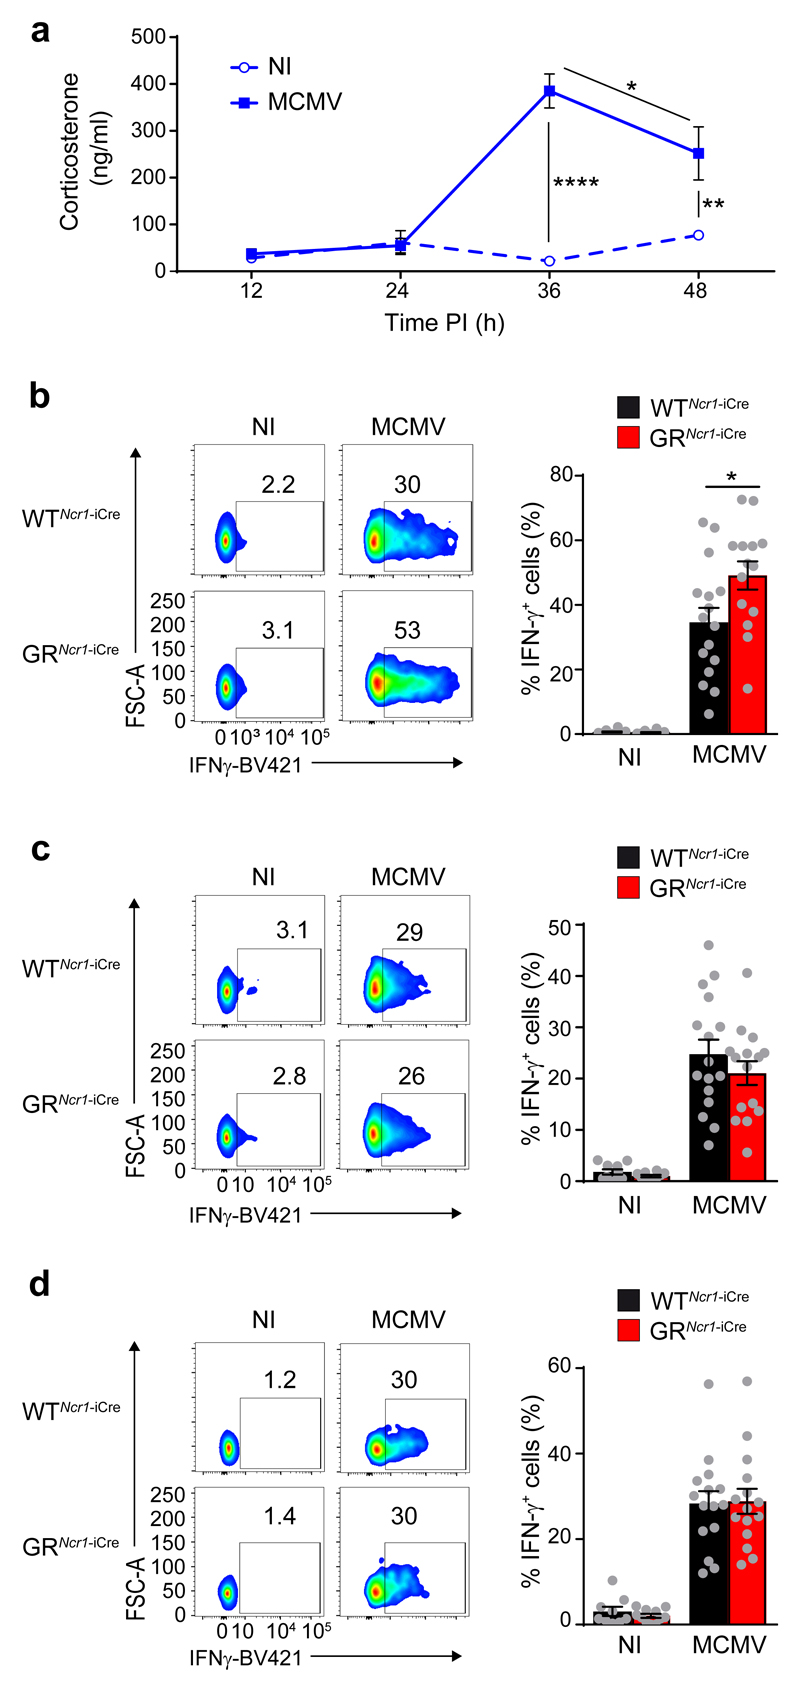
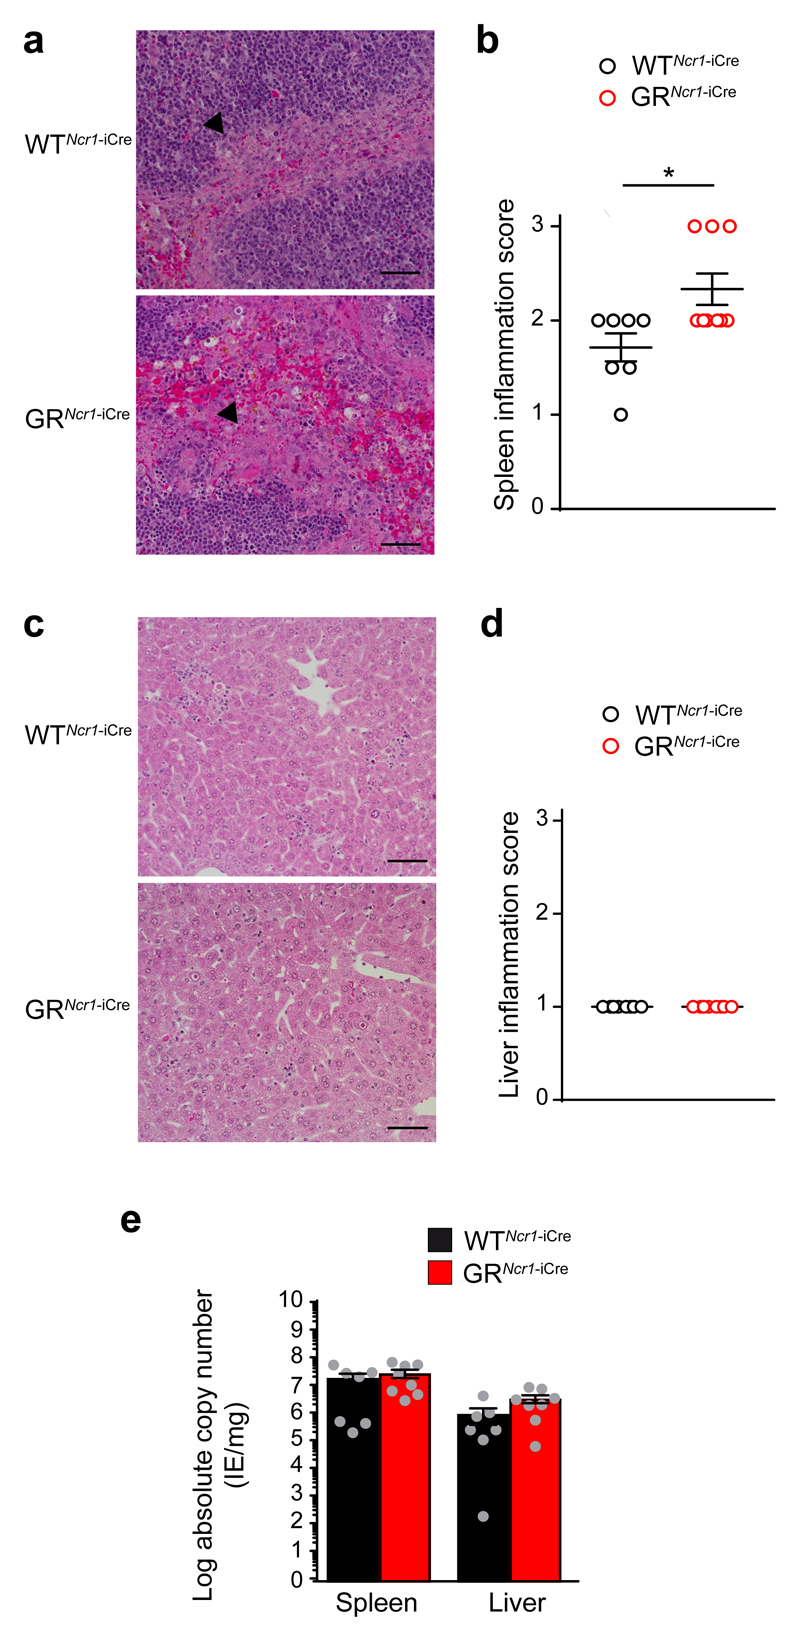
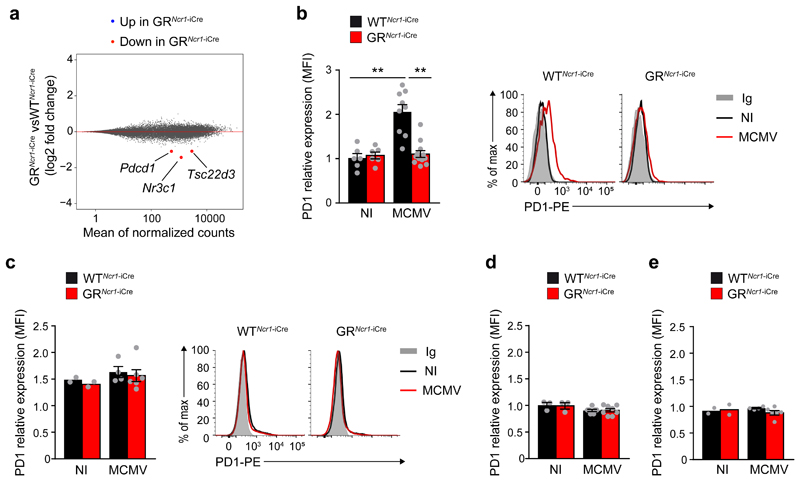
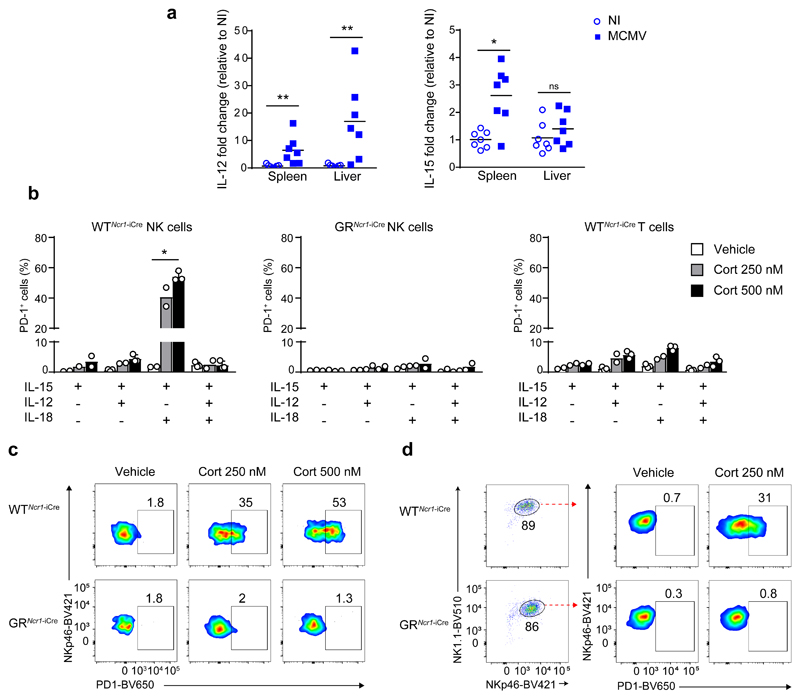
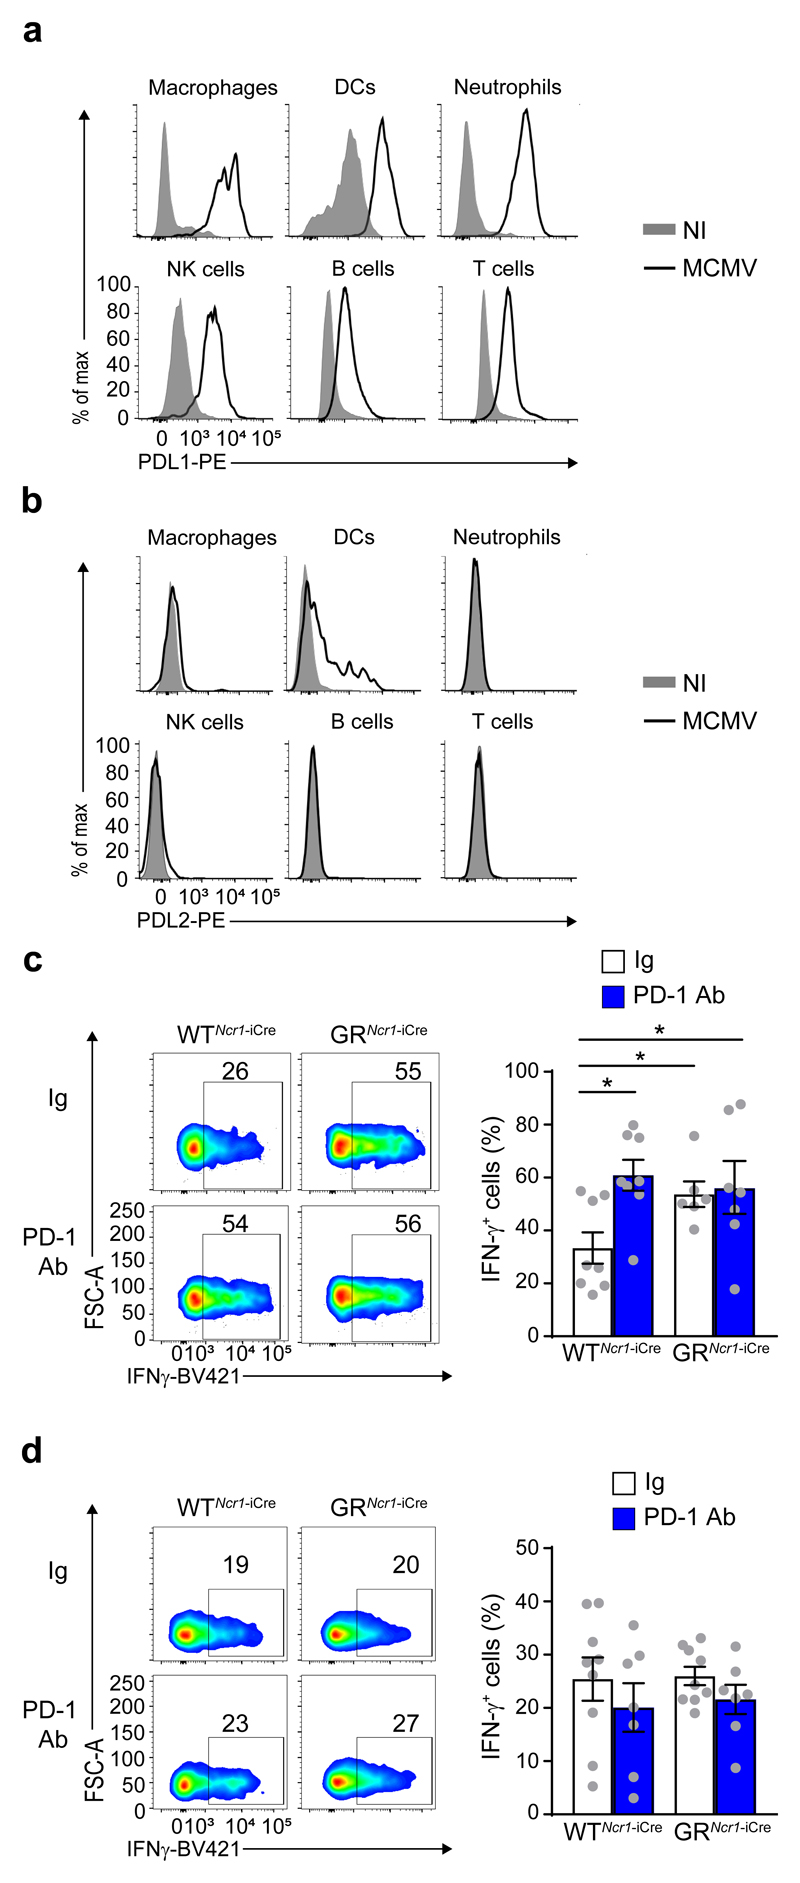
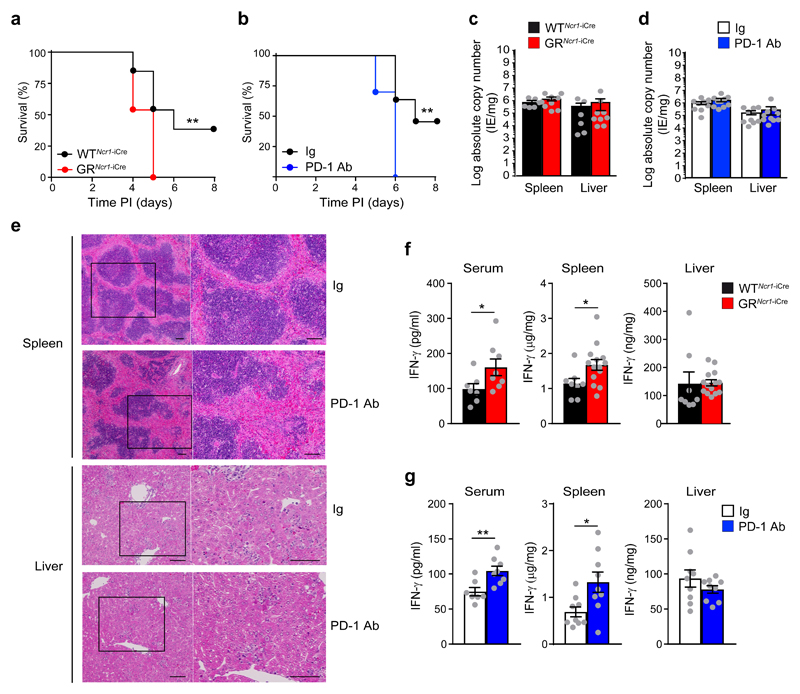
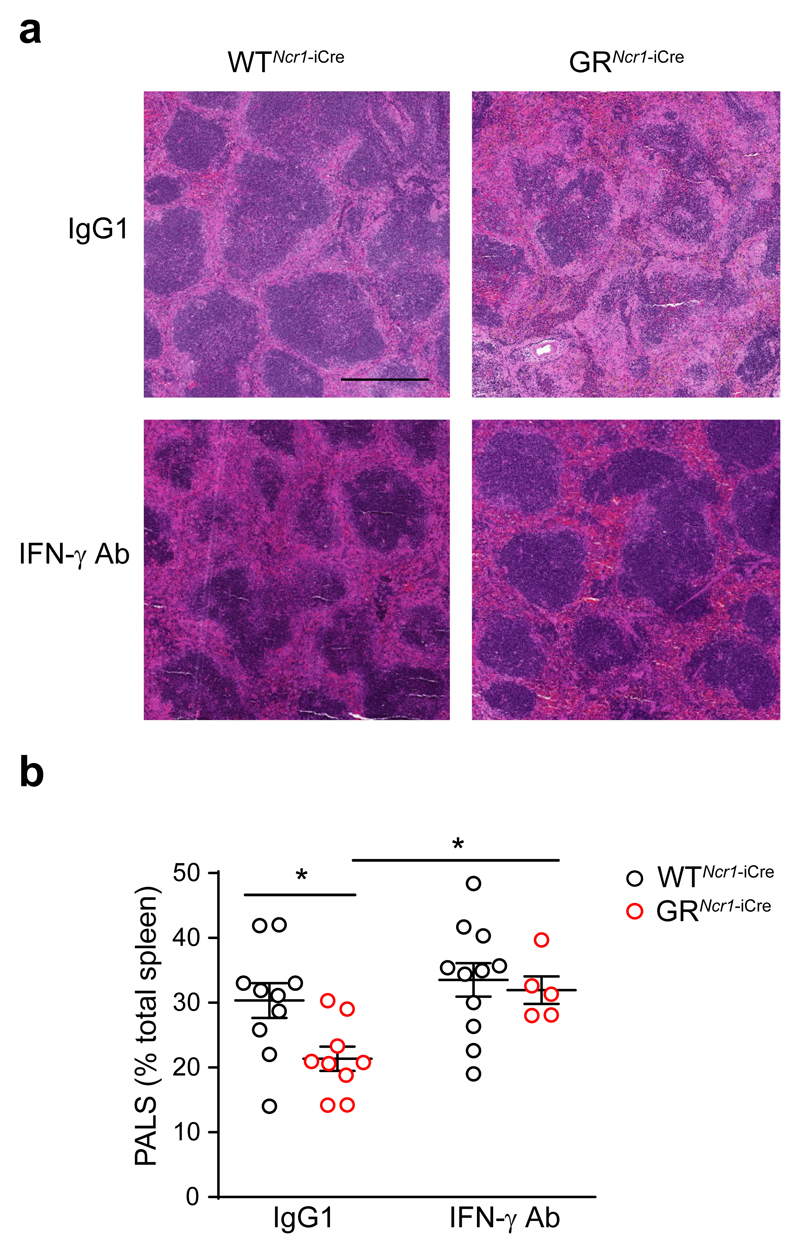
Controlling the balance between immunity and immunopathology is crucial for host resistance to pathogens. After infection, activation of the hypothalamic-pituitary-adrenal (HPA) axis leads to the production of glucocorticoids. However, the pleiotropic effects of these steroid hormones make it difficult to delineate their precise role(s) in vivo. Here we found that the regulation of natural killer (NK) cell function by the glucocorticoid receptor (GR) was required for host survival after infection with mouse cytomegalovirus (MCMV). Mechanistically, endogenous glucocorticoids produced shortly after infection induced selective and tissue-specific expression of the checkpoint receptor PD-1 on NK cells. This glucocorticoid-PD-1 pathway limited production of the cytokine IFN-γ by spleen NK cells, which prevented immunopathology. Notably, this regulation did not compromise viral clearance. Thus, the fine tuning of NK cell functions by the HPA axis preserved tissue integrity without impairing pathogen elimination, which reveals a novel aspect of neuroimmune regulation.


Conflict of interest statement

Competing financial interests

EV is a cofounder and employee of Innate Pharma. The other authors declare no competing financial interests.

Figures

Figure 1
Figure 1. Organ-specific glucocorticoid regulation of NCR1+ ILCs IFN- γ production in spleen and liver upon MCMV infection.
a, ELISA showing corticosterone concentration in the serum of WT mice receiving injections of MCMV (n=5) or DMEM (NI, non-infected) (n=5), pool of 2 experiments. Means ± s.e.m., *P<0.05, **P<0.01, ****P<0.0001, one-way ANOVA. b-d, FACS analysis of intracellular IFN-γ, assessed directly ex vivo without in vitro re-stimulation. Frequencies of IFN-γ-producing spleen NK cells (b, n=10 NI, n=16 WTNcr1-iCre MCMV, or n=15 GRNcr1-iCre MCMV mice; pool of 5 experiments), liver NK cells (c, n=10 NI, n=16 WTNcr1-iCre MCMV, or n=15 GRNcr1-iCre MCMV mice; pool of 5 experiments) and liver ILC1s (d, n=9 WTNcr1-iCre NI, n=11 GRNcr1-iCre NI, n=16 WTNcr1-iCre MCMV, or n=15 GRNcr1-iCre MCMV mice; pool of 5 experiments) 44 h post-infection (PI) are shown as means ± s.e.m. and representative FACS plots. *P<0.05, two-tailed Student’s t-test. Every symbol in b-d represents a single mouse.
Figure 2
Figure 2. GRNcr1-iCre mice display more marked inflammation in the spleen than WTNcr1-iCre mice but their viral titer is unaffected.
Histology (H&E staining) of spleen (a) and liver (c) 44 h PI. Representative images of 8 mice per genotype from 2 experiments are shown. The arrowheads in a indicate the inflammation area in the marginal zone. The bar represents 50 μm. b and d, histopathological quantification of spleen (b) and liver (d) inflammation: 1=mild, 2=moderate and 3=marked. n=7 (WTNcr1-iCre) and n=9 (GRNcr1-iCre) mice, pool of 2 experiments. Means ± s.e.m., *P<0.05, two-tailed Mann-Whitney test. e, qPCR absolute quantification of viral titer at 44 h PI. n =7 (WTNcr1-iCre) and n=8 (GRNcr1-iCre) mice; pool of 2 experiments. Means ± s.e.m.. Every symbol in b, d and e represents a single mouse.
Figure 3
Figure 3. MCMV infection induces glucocorticoid-dependent PD-1 expression in spleen NK cells.
a. RNA Seq analysis. MA plot of genes differentially expressed between spleen NK cells sorted from GRNcr1-iCre and WTNcr1-iCrel mice 44 h PI. Genes with significantly lower (red) levels of expression in GR-deficient NK cells are highlighted (absolute log2 fold-change>1 and P<0.05). n=3 samples GRNcr1-iCre versus 3 WTNcr1-iCresamples. b-e FACS analysis of cell surface PD-1 expression in spleen NK cells (b, n=6 NI, n=9 WTNcr1-iCre MCMV and n=12 GRNcr1-iCre MCMV mice; pool of 3 experiments), spleen T cells (c, n=2 NI, n=4 WTNcr1-iCre MCMV and n=6 GRNcr1-iCre MCMV mice; pool of 2 experiments), liver NK cells (d, n=3 NI, n=7 WTNcr1-iCre MCMV and n=8 GRNcr1-iCre MCMV mice; pool of 2 experiments) and liver ILC1s (e, n=2 NI, n=4 WTNcr1-iCre MCMV and n=6 GRNcr1-iCre MCMV mice; pool of 2 experiments) 44h PI shown as MFI (mean fluorescence intensity) ratio relative to isotype control. Means ± s.e.m., **P<0.01, one-way ANOVA. Similar results were obtained using two different anti-PD-1 antibodies (J43 and RMP1-30). Every symbol in b-e represents a single mouse.
Figure 4
Figure 4. Specific combinations of cytokines and corticosterone cooperate to induce PD-1 expression on NK cells.
a, qRT-PCR for Il12 and Il15 from RNA extracted from WT mice spleen and liver homogenates 44h PI. n=7, pool of 2 experiments. Each symbol represents a single mouse. Mean, *P<0.05, **P<0.01, ns=not significant, two-tailed Mann-Whitney test. b-d, FACS analysis of PD-1 expression after in vitro stimulation for 48h at 37°C with the indicated combinations of cytokines, in the presence of corticosterone or vehicle alone: total splenocytes (b and c) and purified spleen NK cells (d) from WTNcr1-iCre and GRNcr1-iCre mice were used. In d, the frequency of NK cells among live cells was between 86 and 89% as shown in the cytometry plots. b, n=3 independent experiments (vehicle and Cort 500nM treated NK GR+ and T cells stimulated with IL-12+IL15, IL-15+IL-18 and IL-12+IL-15+IL-18 samples) and n=2 independent experiments (all the other samples). *P<0.05, one-way ANOVA. Means ± s.d. and representative FACS plots of IL-15 + IL-18 stimulation (c and d) are shown. Every symbol in b represents a single experiment.
Figure 5
Figure 5. MCMV-induced IFN-γ production by spleen NK cells is regulated by a glucocorticoid-PD-1 axis.
a and b, FACS analysis of cell surface PDL1 (a) and PDL2 (b) expression 44 h PI by macrophages (CD11c-CD11b+F4/80+), DCs (CD11c+MHCIIhi), neutrophils (CD11c-CD11b+Ly6G+), NK cells (NK1.1+NKp46+CD49b+), B cells (CD19+) and T cells (CD3+NK1.1-) in the spleen (n=2 independent experiments). c and d, FACS analysis of intracellular IFN-γ, assessed directly ex vivo without in vitro restimulation. Frequency of IFN-γ–producing NK cells in the spleen (c) and liver (d) 44 h PI, following treatment with an anti-PD-1 antibody or an isotype control antibody (Ig). c, n=8 (WTNcr1-iCre Ig and PD-1 Ab), n=6 (GRNcr1-iCre Ig), and n =7 (GRNcr1-iCre PD-1 Ab) mice; pool of 4 experiments. d, n=9 (Ig) and n=7 (PD-1 Ab) mice; pool of 4 experiments. Means ± s.e.m. and representative FACS plots. *P<0.05, one-way ANOVA. Every symbol represents a single mouse.
Figure 6
Figure 6. The glucocorticoid-PD-1 regulatory pathway is required for protection against MCMV infection.
(a) Survival curve for mice infected with MCMV (n=13, pool of 3 experiments), and (b) receiving injections of anti-PD-1 or an isotype control antibody (Ig). n=11 (Ig) and n=10 (PD-1 Ab), pool of 2 experiments. **P<0.01, two-tailed log-rank Mantel-Cox test. c and d, qPCR absolute quantification of viral titer 3 days PI. c, n=6 (WTNcr1-iCre) and n=9 (GRNcr1-iCre) mice, pool of 2 experiments. d, n=9 (Ig) and n=10 (PD-1 Ab) mice, pool of 2 experiments. e, Histology (H&E staining) of spleen and liver 3 days PI. For each panel, a higher magnification of the corresponding areas in the black boxes is shown. The bar represents 100 μm. Similar results were obtained with two different anti-PD-1 antibody clones (J43 and RMP1-14). n =4 (Ig) and n=5 (PD-1 Ab) mice. f and g, cytometric bead array measurement of IFN-γ concentration 3 days PI. f, n=7 (serum WTNcr1-iCre), n=8 (serum GRNcr1-iCre and WTNcr1-iCre spleen and liver), and n=14 (GRNcr1-iCre spleen and liver) mice; pool of 2 experiments (serum) and pool of 3 experiments (spleen and liver). *P<0.05, two-tailed Mann-Whitney test (serum) and two-tailed Student’s t-test (spleen). g, n=7 (Ig serum), n=8 (PD-1 Ab serum), and n=9 (spleen and liver) mice; pool of 2 experiments. **P<0.01, two-tailed Mann-Whitney test (serum) and *P<0.05, two-tailed Student’s t-test (spleen). Means ± s.e.m. are shown for c, d, f and g. Each symbol represents a single mouse.
Figure 7
Figure 7. IFN-γ neutralization prevents spleen immunopathology in GRNcr1-iCre mice.
Histology (H&E staining) of the spleen 3 days PI. Mice were infected with the LD50 of MCMV and injected on day 1 PI with anti-IFNγ or IgG1 isotype control antibodies. The bar represents 500 μm. b, histopathological quantification of spleen inflammation: the area covered by PALS was measured and expressed as percentage of the total area of the spleen section. n=10 (WTNcr1-iCre IgG1), n=9 (GRNcr1-iCre IgG1), n=11 (WTNcr1-iCre IFN-γ Ab), and n=5 (GRNcr1-iCre IFN-γ Ab) mice; pool of 2 experiments. *P<0.05, one-way ANOVA, ns=not significant. Means ± s.e.m.. Each symbol represents a single mouse.

Comment in

References

    1. Medzhitov R, Schneider DS, Soares MP. Disease tolerance as a defense strategy. Science. 2012;335:936–941. - PMC - PubMed
    1. Webster JI, Tonelli L, Sternberg EM. Neuroendocrine regulation of immunity. Annu Rev Immunol. 2002;20:125–163. - PubMed
    1. Irwin MR, Cole SW. Reciprocal regulation of the neural and innate immune systems. Nat Rev Immunol. 2011;11:625–632. - PMC - PubMed
    1. Cain DW, Cidlowski JA. Immune regulation by glucocorticoids. Nat Rev Immunol. 2017;17:233–247. - PMC - PubMed
    1. Weikum ER, Knuesel MT, Ortlund EA, Yamamoto KR. Glucocorticoid receptor control of transcription: precision and plasticity via allostery. Nat Rev Mol Cell Biol. 2017;18:159–174. - PMC - PubMed

Publication types

MeSH terms