. 2018 Sep;50(9):1240-1246.
doi: 10.1038/s41588-018-0191-z. Epub 2018 Aug 20.

Selective gene dependencies in MYCN-amplified neuroblastoma include the core transcriptional regulatory circuitry

Affiliations

Selective gene dependencies in MYCN-amplified neuroblastoma include the core transcriptional regulatory circuitry

Adam D Durbin et al. Nat Genet. 2018 Sep.

Abstract

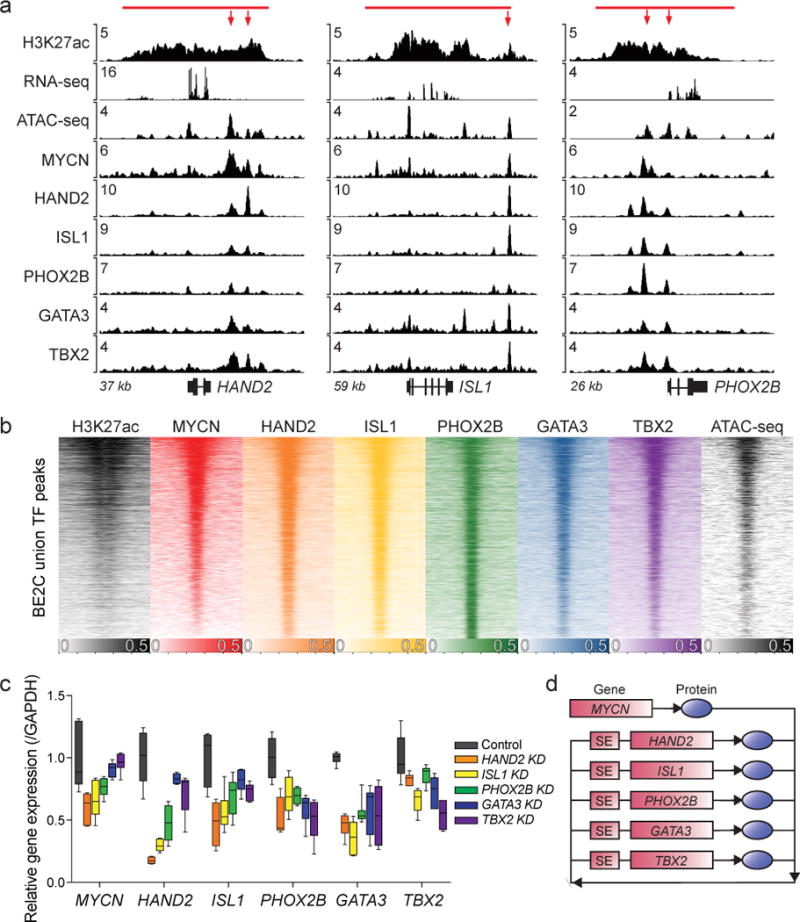
Childhood high-risk neuroblastomas with MYCN gene amplification are difficult to treat effectively1. This has focused attention on tumor-specific gene dependencies that underlie tumorigenesis and thus provide valuable targets for the development of novel therapeutics. Using unbiased genome-scale CRISPR-Cas9 approaches to detect genes involved in tumor cell growth and survival2-6, we identified 147 candidate gene dependencies selective for MYCN-amplified neuroblastoma cell lines, compared to over 300 other human cancer cell lines. We then used genome-wide chromatin-immunoprecipitation coupled to high-throughput sequencing analysis to demonstrate that a small number of essential transcription factors-MYCN, HAND2, ISL1, PHOX2B, GATA3, and TBX2-are members of the transcriptional core regulatory circuitry (CRC) that maintains cell state in MYCN-amplified neuroblastoma. To disable the CRC, we tested a combination of BRD4 and CDK7 inhibitors, which act synergistically, in vitro and in vivo, with rapid downregulation of CRC transcription factor gene expression. This study defines a set of critical dependency genes in MYCN-amplified neuroblastoma that are essential for cell state and survival in this tumor.


Conflict of interest statement

Competing Interests: RAY is a founder and shareholder of Syros Pharmaceuticals, which is discovering and developing therapeutics directed at transcriptional pathways in cancer. KS and WCH consult for Novartis Pharmaceuticals as part of the Dana-Farber Cancer Institute/Novartis Drug Discovery Program. BJA is a shareholder of Syros Pharmaceuticals. No other potential conflicts of interest are declared.

Figures

Figure 1
Figure 1. Genome-scale CRISPR-Cas9 screening identifies selective neuroblastoma gene dependencies enriched for transcription factors
a. Gene ontology classification of terms associated with selective dependencies in neuroblastoma reveals enrichment for transcription factor activity or binding and nucleic acid binding proteins. n=147 genes, 252 GO-slim molecular class assignments. p=8.48×10⁻³ nucleic acid binding, p=6.78×10⁻³ transcription factor activity or binding, by 1-sided Fisher exact test (adjusted using Benjamini-Hochberg correction) comparing the ontologies of dependencies to all assayed genes in the genome. b. STRING database analysis demonstrates 25 of 30 transcription factor dependencies have putative protein-protein interactions. Edge widths correspond to the level of confidence in interactions (medium confidence STRING score 0.4; high confidence STRING score 0.7; highest confidence STRING score 0.9). Red nodes indicate transcription factors previously co-reported with neuroblastoma in a literature search. c and d. Representative scatter plots showing neuroblastoma relative dependency on HAND2 (c) and ISL1 (d) with p<1×10⁻⁹ by permutation testing with n=9 MYCN-amplified neuroblastoma cell lines compared to n=330 non-neuroblastoma cancer cell lines. Y-axis shows the gene’s dependency rank in an individual cell line. X-axis shows the gene’s dependency score in each cell line. e and f. Colony formation assay at 10 days in BE2C (e) and Kelly (f) cells treated with two independent small-interfering RNAs targeting ISL1, PHOX2B, HAND2, GATA3 and TBX2. BE2C/Kelly siRNA#1 n=7 (control), 3 (HAND2, ISL1, PHOX2B), 4 (GATA3), 6 (TBX2); BE2C/Kelly siRNA#2 n=3 (control, HAND2, ISL1, PHOX2B), 6 (GATA3, TBX2) biologically independent samples; BE2C p<0.05 for all transcription factors relative to control siRNAs by 2-sided t-test. Center values represent mean and error bars represent SD.
Figure 2
Figure 2. Several transcription factor dependency genes are marked by extensive H3K27ac and are enriched for dependency in human MYCN-amplified neuroblastoma
a. Normalized ChIP-seq tracks for H3K27ac demonstrate a SE at the GATA3 locus compared to a typical enhancer at the RAD23B locus in BE2C; tracks represent a combination of 2 independent experiments. ChIP-seq read densities (y-axis) were normalized to reads per million reads sequenced in each sample. b. Gene ontology classification of terms associated with 77 shared SE-associated genes across five MYCN-amplified neuroblastoma cell lines reveals enrichment for transcription factor activity or binding (p=1.48×10⁻⁶), and nucleic acid binding proteins (p=1.40×10⁻²); n=77 genes, 130 GO-slim molecular class assignments, using 1-sided Fisher exact test (adjusted using Benjamini-Hochberg correction) comparing ontologies in SE-associated genes to all genes in the genome. c. Identification of enhancers by ranked H3K27ac signal across all genes in the MYCN-amplified cell lines Kelly and BE2C. Highlighted are transcription factor dependencies with shared SEs across all five MYCN-amplified cell lines. d. The rank of CRISPR-Cas9 dependencies genome-wide demonstrates selective dependency of shared SE-associated genes. Eleven of 69 SE-associated genes were enriched for selective dependency in neuroblastoma (p=1.11×10−10 by 2-sided Fisher exact test compared to all genes assayed). Highlighted are 10 of 11 SE-associated dependency genes annotated with transcription factor activity/binding or nucleic acid binding ontologies. Closed circles reflect transcription factors evaluable by ChIP-seq; open circles represent those not evaluated. X-axis shows gene rank in enrichment analysis (modified Kolmogorov-Smirnov test with permutation testing) for MYCN-amplified neuroblastoma versus other cancer cell lines. Y-axis shows the -log10(p-value) from enrichment analysis. Enrichment p-value for MYCN, HAND2, ISL1 and LDB1 was <1×10⁻⁹.
Figure 3
Figure 3. Dependency transcription factors form the core regulatory circuitry in MYCN-amplified neuroblastoma
a. Normalized ChIP-seq tracks for H3K27ac, MYCN, and five transcription factors at the HAND2, ISL1 and PHOX2B loci in BE2C cells; H3K27ac track represents a combination of 2 independent experiments in BE2C and other tracks are representative of an independent experiment performed in BE2C and Kelly cells. ChIP-seq read densities (y-axis) were normalized to reads per million reads sequenced in each sample. SEs are noted as red bars and arrows indicate epicentres. b. Genome-wide co-occupancy for CRC transcription factors as determined by ChIP-seq. Regions (rows) were defined as those enriched in ChIP-seq reads for at least one transcription factor and are ranked by the MYCN signal therein. Color keys for reads-per-million-normalized signal are displayed below each heatmap. c. Quantitative RT-PCR of BE2C cells treated with transient siRNA to each CRC gene - HAND2, ISL1, PHOX2B, GATA3 and TBX2 - results in decreased expression of mRNA transcripts for all of the CRC members, which was not observed for non-targeting control siRNA transfection (n=3 independent biological experiments, all siRNA-treated transcription factor gene expression are significantly different from both control siRNAs with p<0.05 by 2-sided t-test. Horizontal lines demonstrate the median with upper and lower box boundaries demonstrating the 25-75th centiles. Upper and lower bounds represent the 10th-90th centiles. d. HAND2, ISL1, PHOX2B, GATA3, and TBX2 form a positive feedback, interconnected co-regulatory loop. MYCN regulates each of these genes as a part of the CRC. SEs and gene loci are represented by rectangles, and proteins are represented by oval symbols.
Figure 4
Figure 4. Pharmacological disruption of SE-mediated transcription selectively suppresses the core regulatory circuitry and neuroblastoma cell growth
a. BE2C and Kelly cells demonstrate decreased growth with JQ1 and/or THZ1 treatment (JQ1 3 μM (all); THZ1 125 nM (BE2C) and 78 nM (Kelly); alone or in combination or DMSO control). n=4 biologically independent experiments. p<0.001 for combination treatment at all timepoints relative to control, JQ1 or THZ1 alone; p<0.001 for JQ1 or THZ1 alone relative to DMSO at 72h by 2-way ANOVA with Tukey post hoc correction. Mean relative growth is plotted, error bars represent SD. b. Chou-Talalay normalized isobolograms depicting combination index (CI) scores over a range of THZ1 and JQ1 concentrations in BE2C and Kelly (CI scores <1=synergy, >1=antagonism; r ed line represents additivity, CI=1). c. BE2C xenografts demonstrate reduced growth with combinations of JQ1 and THZ1 compared to JQ1, THZ1 or DMSO vehicle controls. n=8 mice per treatment group. Mean tumor volume is plotted with error bars representing SEM. N.S.=not significant, *** vehicle vs combination p=0.0001, JQ1 vs combination p=0.021, THZ1 vs combination p=0.0002 by 2-way ANOVA with Tukey post hoc correction. d. Gene expression analysis in BE2C cells treated with JQ1 and THZ1 for 1, 4 and 12h. Data is normalized to untreated cells at 0h and levels of ERCC spike-in RNAs. e. Log2-fold change of CRC gene transcripts normalized to the top 1% highest expressed genes at 0h in BE2C cells; n=3 independent experiments. CRC genes display reductions in expression relative to the top 1% highest expressed genes in the genome at all timepoints (1h p=0.0059, 4h p=0.0021, 12h p=0.0032 by 2-sided t-test).

References

    1. Matthay KK, et al. Neuroblastoma. Nat Rev Dis Primers. 2016 Nov 10;2:16078. 2(2016) - PubMed
    1. Shalem O, et al. Genome-scale CRISPR-Cas9 knockout screening in human cells. Science. 2014;343:84–7. - PMC - PubMed
    1. Wang T, Wei JJ, Sabatini DM, Lander ES. Genetic screens in human cells using the CRISPR-Cas9 system. Science. 2014;343:80–4. - PMC - PubMed
    1. Evers B, et al. CRISPR knockout screening outperforms shRNA and CRISPRi in identifying essential genes. Nat Biotechnol. 2016;34:631–3. - PubMed
    1. Morgens DW, Deans RM, Li A, Bassik MC. Systematic comparison of CRISPR/Cas9 and RNAi screens for essential genes. Nat Biotechnol. 2016;34:634–6. - PMC - PubMed

Publication types

Substances