

Classification and Prediction of Brain Disorders Using Functional Connectivity: Promising but Challenging
- PMID: 30127711
- PMCID: PMC6088208
- DOI: 10.3389/fnins.2018.00525
Classification and Prediction of Brain Disorders Using Functional Connectivity: Promising but Challenging
Abstract
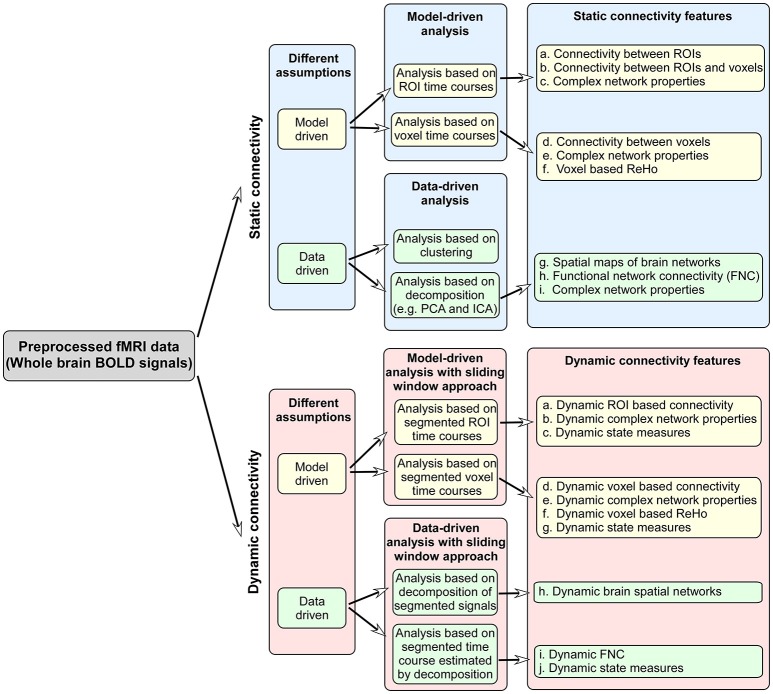
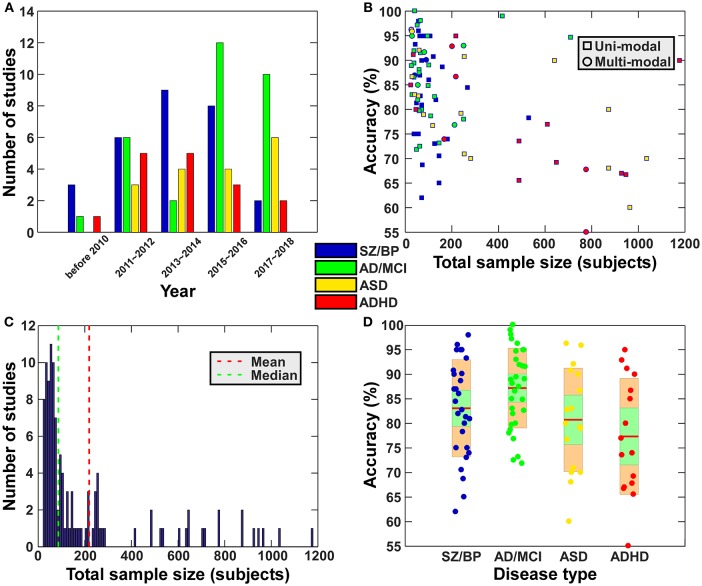
Brain functional imaging data, especially functional magnetic resonance imaging (fMRI) data, have been employed to reflect functional integration of the brain. Alteration in brain functional connectivity (FC) is expected to provide potential biomarkers for classifying or predicting brain disorders. In this paper, we present a comprehensive review in order to provide guidance about the available brain FC measures and typical classification strategies. We survey the state-of-the-art FC analysis methods including widely used static functional connectivity (SFC) and more recently proposed dynamic functional connectivity (DFC). Temporal correlations among regions of interest (ROIs), data-driven spatial network and functional network connectivity (FNC) are often computed to reflect SFC from different angles. SFC can be extended to DFC using a sliding-window framework, and intrinsic connectivity states along the time-varying connectivity patterns are typically extracted using clustering or decomposition approaches. We also briefly summarize window-less DFC approaches. Subsequently, we highlight various strategies for feature selection including the filter, wrapper and embedded methods. In terms of model building, we include traditional classifiers as well as more recently applied deep learning methods. Moreover, we review representative applications with remarkable classification accuracy for psychosis and mood disorders, neurodevelopmental disorder, and neurological disorders using fMRI data. Schizophrenia, bipolar disorder, autism spectrum disorder (ASD), attention deficit hyperactivity disorder (ADHD), Alzheimer's disease and mild cognitive impairment (MCI) are discussed. Finally, challenges in the field are pointed out with respect to the inaccurate diagnosis labeling, the abundant number of possible features and the difficulty in validation. Some suggestions for future work are also provided.
Keywords: biomarker; brain disorders; classification; fMRI; functional connectivity.
Figures
Similar articles
-
Characterizing dynamic amplitude of low-frequency fluctuation and its relationship with dynamic functional connectivity: An application to schizophrenia.Neuroimage. 2018 Oct 15;180(Pt B):619-631. doi: 10.1016/j.neuroimage.2017.09.035. Epub 2017 Sep 20. Neuroimage. 2018. PMID: 28939432 Free PMC article.
-
Transient states of network connectivity are atypical in autism: A dynamic functional connectivity study.Hum Brain Mapp. 2019 Jun 1;40(8):2377-2389. doi: 10.1002/hbm.24529. Epub 2019 Jan 25. Hum Brain Mapp. 2019. PMID: 30681228 Free PMC article.
-
Resting state dynamic functional connectivity in children with attention deficit/hyperactivity disorder.J Neural Eng. 2021 Aug 16;18(4). doi: 10.1088/1741-2552/ac16b3. J Neural Eng. 2021. PMID: 34289458
-
The dynamic functional connectome: State-of-the-art and perspectives.Neuroimage. 2017 Oct 15;160:41-54. doi: 10.1016/j.neuroimage.2016.12.061. Epub 2016 Dec 26. Neuroimage. 2017. PMID: 28034766 Review.
-
Interpreting temporal fluctuations in resting-state functional connectivity MRI.Neuroimage. 2017 Dec;163:437-455. doi: 10.1016/j.neuroimage.2017.09.012. Epub 2017 Sep 12. Neuroimage. 2017. PMID: 28916180 Review.
Cited by
-
Artificial intelligence-based classification of schizophrenia: A high density electroencephalographic and support vector machine study.Indian J Psychiatry. 2020 May-Jun;62(3):273-282. doi: 10.4103/psychiatry.IndianJPsychiatry_91_20. Epub 2020 May 15. Indian J Psychiatry. 2020. PMID: 32773870 Free PMC article.
-
Introduction to Large Language Models (LLMs) for dementia care and research.Front Dement. 2024 May 14;3:1385303. doi: 10.3389/frdem.2024.1385303. eCollection 2024. Front Dement. 2024. PMID: 39081594 Free PMC article.
-
Multiclass classification of Autism Spectrum Disorder, attention deficit hyperactivity disorder, and typically developed individuals using fMRI functional connectivity analysis.PLoS One. 2024 Oct 17;19(10):e0305630. doi: 10.1371/journal.pone.0305630. eCollection 2024. PLoS One. 2024. PMID: 39418298 Free PMC article.
-
Graph-to-signal transformation based classification of functional connectivity brain networks.PLoS One. 2019 Aug 22;14(8):e0212470. doi: 10.1371/journal.pone.0212470. eCollection 2019. PLoS One. 2019. PMID: 31437168 Free PMC article.
-
Riemannian Geometry of Functional Connectivity Matrices for Multi-Site Attention-Deficit/Hyperactivity Disorder Data Harmonization.Front Neuroinform. 2022 May 23;16:769274. doi: 10.3389/fninf.2022.769274. eCollection 2022. Front Neuroinform. 2022. PMID: 35685944 Free PMC article.
References
-
- Adali T., Anderson M., Fu G. S. (2014). Diversity in independent component and vector analyses: identifiability, algorithms, and applications in medical imaging. IEEE Signal Process. Mag. 31, 18–33. 10.1109/MSP.2014.2300511 - DOI
-
- Albert M. S., Dekosky S. T., Dickson D., Dubois B., Feldman H. H., Fox N. C., et al. . (2011). The diagnosis of mild cognitive impairment due to Alzheimer's disease: Recommendations from the National Institute on Aging-Alzheimer's Association workgroups on diagnostic guidelines for Alzheimer's disease. Alzheimers Dement. 7, 270–279. 10.1016/j.jalz.2011.03.008 - DOI - PMC - PubMed
Publication types
Grants and funding
LinkOut - more resources
Full Text Sources
Other Literature Sources