. 2018 Aug 6:12:530.
doi: 10.3389/fnins.2018.00530. eCollection 2018.

A Reproducible MEG/EEG Group Study With the MNE Software: Recommendations, Quality Assessments, and Good Practices

Affiliations

A Reproducible MEG/EEG Group Study With the MNE Software: Recommendations, Quality Assessments, and Good Practices

Mainak Jas et al. Front Neurosci. .

Abstract

Cognitive neuroscience questions are commonly tested with experiments that involve a cohort of subjects. The cohort can consist of a handful of subjects for small studies to hundreds or thousands of subjects in open datasets. While there exist various online resources to get started with the analysis of magnetoencephalography (MEG) or electroencephalography (EEG) data, such educational materials are usually restricted to the analysis of a single subject. This is in part because data from larger group studies are harder to share, but also analyses of such data often require subject-specific decisions which are hard to document. This work presents the results obtained by the reanalysis of an open dataset from Wakeman and Henson (2015) using the MNE software package. The analysis covers preprocessing steps, quality assurance steps, sensor space analysis of evoked responses, source localization, and statistics in both sensor and source space. Results with possible alternative strategies are presented and discussed at different stages such as the use of high-pass filtering versus baseline correction, tSSS vs. SSS, the use of a minimum norm inverse vs. LCMV beamformer, and the use of univariate or multivariate statistics. This aims to provide a comparative study of different stages of M/EEG analysis pipeline on the same dataset, with open access to all of the scripts necessary to reproduce this analysis.

Keywords: Python; electroencephalography (EEG); magnetoencephalography (MEG); neuroimaging; open-source; software.


Figures

Figure 1
Figure 1
Evoked responses (filtered between 1 and 40 Hz) in the magnetometer channels from (A) unprocessed data, (B) data processed with maxwell_filter in MNE, and (C) the difference between data processed using maxwell_filter and Elekta MaxFilter (TM). The colors show the sensor position, with (x, y, z) sensor coordinates converted to (R, G, B) values, respectively.
Figure 2
Figure 2
Power spectral density per channel for subject 10, run 02. (A) Log scale for the x axis accentuates low frequency drifts in the data. The red lines show the PSD for the bad channels marked manually and provided to us by Wakeman and Henson (2015). (B) The same data with a linear x-axis scale. Five peaks corresponding to HPI coils around 300 Hz are visible and marked in gray dotted lines alongside the power line frequency (50 Hz).
Figure 3
Figure 3
Comparison of filters between new (0.16) and old (0.12) MNE versions: (A) The frequency response of the highpass filter; (B) The frequency response of the lowpass filter; (C) The impulse response of the highpass filter; (D) The impulse response of the lowpass filter. The filters in MNE are now adaptive with trade-offs between frequency attenuation and time domain artifacts that by default adapt based on the chosen low-pass and high-pass frequencies.
Figure 4
Figure 4
(A) Evoked response in magnetometers for subject 3 with baseline correction. Note how signals tend toward the baseline late in the epochs (where the rightmost time point, 2.9 s, is the earliest possible start time for the next stimulus). (B) The highpass filtered version of the signal and (C) the signal processed with temporal SSS (tSSS). Both reduce the magnitude of the slow and late sustained responses shown in (A).
Figure 5
Figure 5
Grand averaged evoked response across 16 subjects for channel EEG065. (A) No highpass filter. (B) Highpass filtered at 1.0 Hz. Note that, similar to (A), the results reported by Wakeman and Henson (2015) (dashed line at 800 ms indicates where their plot stopped) show large drifts, but these return to near-baseline levels toward the end of a sufficiently long interval (here, 2.9 s) even without applying a highpass filter.
Figure 6
Figure 6
Sensor space statistics. (A) A single sensor (EEG065) with temporal clustering statistics. The clustering is based on selecting consecutive time samples that have exceeded the initial paired t-test threshold (0.001), and finding clusters that exceed the mass expected by chance according to exchangability under the null hypothesis (p < 0.01, shaded areas). (B) Cross-validation score of time-by-time decoding. As opposed to a cluster statistic, time decoding is a multivariate method which pools together the signal from different sensors to find discriminative time points between two conditions.
Figure 7
Figure 7
Spatiotemporal cluster statistics on the EEG sensors. (A) Topographic map of the t-statistic. (B) Average over the sensors that were part of the significant cluster.
Figure 8
Figure 8
BEM surfaces on flash MRI images. The inner skull, outer skull, and outer skin are outlined in color.
Figure 9
Figure 9
The result of head-to-MRI (and MEG-to-head) transformations with inner skull and outer skin surfaces for one subject. Note that the MEG helmet is well-aligned with the digitization points. The digitized fiducial points are shown with large dots, EEG electrodes with small pink dots, and extra head digitization points with small gray dots. Note that the anonymization of the MRI produces a mismatch between digitized points and outer skin surface at the front of the head.
Figure 10
Figure 10
Whitened MEG data for subject 4 and the global field power (GFP) which follows a χ2 distribution if the data is assumed Gaussian. The dotted horizontal red lines represent the expected GFP during the baseline for Gaussian data. Here the data slowly return to baseline at the end of the epoch.
Figure 11
Figure 11
Group average on source reconstruction with dSPM (Left) and LCMV (Right). Here, we have the ventral view of an inflated surface with the anterior-posterior line going from the bottom to top of the image. Right hemisphere is on the right side.
Figure 12
Figure 12
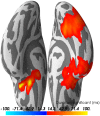
Spatio-temporal source space clusters obtained by nonparametric permutation test that allowed rejection of the null hypothesis that the distribution of data for the "faces" condition was the same as that of “scrambled.” The clusters here are collapsed across time such that vertex colors indicate the duration that each vertex was included in its cluster (each cluster here occurring with FWER corrected p < 0.05). Hot colors indicate durations for vertices in clusters where response for faces > scrambled (cool colors would be used for scrambled > faces, but no such clusters were found).

References

    1. Acunzo D. J., MacKenzie G., van Rossum M. C. (2012). Systematic biases in early ERP and ERF components as a result of high-pass filtering. J. Neurosci. Methods 209, 212–218. 10.1016/j.jneumeth.2012.06.011 - DOI - PubMed
    1. Baayen R. H., Davidson D. J., Bates D. M. (2008). Mixed-effects modeling with crossed random effects for subjects and items. J. Mem. Lang. 59, 390–412. 10.1016/j.jml.2007.12.005 - DOI
    1. Baillet S. (2017). Magnetoencephalography for brain electrophysiology and imaging. Nat. Neurosci. 20, 327–339. 10.1038/nn.4504 - DOI - PubMed
    1. Bigdely-Shamlo N., Kreutz-Delgado K., Robbins K., Miyakoshi M., Westerfield M., Bel-Bahar T., et al. (2013). Hierarchical event descriptor (HED) tags for analysis of event-related EEG studies, in Global Conference on Signal and Information Processing (GlobalSIP) (IEEE; ) (Austin, TX: ), 1–4.
    1. Brunet D., Murray M. M., Michel C. M. (2011). Spatiotemporal analysis of multichannel EEG: Cartool. Comput. Intell. Neurosci. 2011:813870. 10.1155/2011/813870 - DOI - PMC - PubMed

LinkOut - more resources