. 2018 Jul 30;8(15):4155-4169.
doi: 10.7150/thno.26055. eCollection 2018.

Plasma levels of heart failure biomarkers are primarily a reflection of extracardiac production

Affiliations

Plasma levels of heart failure biomarkers are primarily a reflection of extracardiac production

Weijie Du et al. Theranostics. .

Abstract

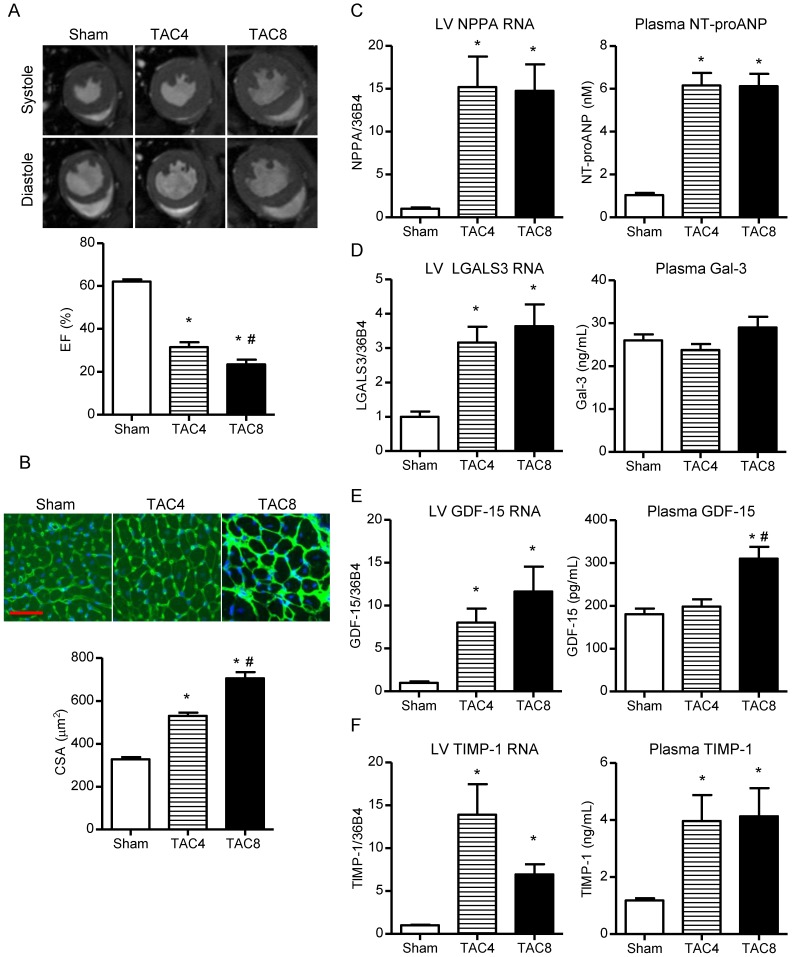
Plasma heart failure (HF) biomarkers, like natriuretic peptides, are important in diagnosis, prognosis and HF treatment. Several novel HF biomarkers have been identified, including Gal-3, GDF-15 and TIMP-1, but their clinical potential remains vague. Here we investigated plasma biomarker levels in relation to tissue expression and structural and functional cardiac changes. Methods: Cardiac remodeling, cardiac function, and plasma and tissue biomarker levels were investigated in mice after myocardial infarction induced by temporal and permanent LAD ligation (tLAD and pLAD). In addition, a pressure overload model induced by transverse aortic constriction (TAC) and an obese/hypertensive HFpEF-like mouse model were investigated. Results: Plasma levels of ANP and its cardiac expression were strictly associated with cardiac remodeling and function. Gal-3, GDF-15 and TIMP-1 cardiac expressions were also related to cardiac remodeling and function, but not their plasma levels. Only directly after myocardial infarction could elevated plasma levels of Gal-3 and TIMP-1 be detected. Eight weeks after infarction, plasma levels were not elevated despite enhanced cardiac expression and low EF (18.3±3.3%, pLAD). Plasma levels of TIMP-1 and GDF-15 were elevated after TAC, but this also correlated with increased lung expression and congestion. In obese-hypertensive mice, elevated plasma levels of Gal-3, GDF-15 and TIMP1 were associated with increased adipose tissue expression and not with cardiac function. Conclusions: The Gal-3, GDF-15 and TIMP-1 plasma pool levels are hardly influenced by dynamic changes in cardiac expression. These biomarkers are not specific for indices of cardiac remodeling, but predominantly reflect stress in other affected tissues and hence provide health information beyond the heart.

Keywords: GDF-15; Galectin-3; TIMP-1; biomarker; cardiac remodeling; heart failure.


Conflict of interest statement

Competing Interests: The UMCG, which employs a number of the authors, received research grants and consultancy fees from AstraZeneca, Roche, Bristol Myers Squibb, Pfizer, Trevena, Thermofisher GmbH, and Sphingotec GmbH, for work done by UMCG employers. Dr. Voors received funding from Roche Diagnostics and Sphingotec. Dr. de Boer received speaker fees from Novartis. Dr. H. Silljé received research grants from AstraZeneca.

Figures

Figure 1
Figure 1
Cardiac function, remodeling and biomarker expression after tLAD. (A) Percent ejection fraction (EF) after tLAD, as determined by MRI (N=8-10). (B) Quantification of percent LV fibrosis as determined by Masson's trichrome staining (left panel) (N=8-10). Representative images of stained mid-left ventricular slices of mice of the 8 weeks group are shown on the left with higher magnifications of the indicated areas at the bottom. (C) NPPA gene expression (left panel), ANP protein levels in LV (middle panel) and NT-proANP biomarker plasma levels (right panel). (D-F) The same as (C), but for, respectively (D) Gal-3, (E) GDF-15 and (F) TIMP-1. Gene expression changes were corrected for 36B4 and are shown as fold changes relative to the 3 days sham group (N=6-10). ANP protein levels in the LV were determined by Western blot and corrected for GAPDH levels. All other proteins were determined by ELISA. Plasma protein levels N=6-9. LV protein levels N=4-9. Bars represent means. Error bars represent SEM. *P<0.05 versus respective control group. Black bar in (B) represents 2 mm.
Figure 2
Figure 2
Cardiac function, remodeling and biomarker expression 8 weeks after tLAD and pLAD. (A) Representative MRI images of short axis in systole and diastole (upper panel). EF (%) 8 weeks after tLAD and pLAD, as determined by MRI (N=8-9). (B) Representative images of Masson's trichrome-stained transverse mid slices of LVs after 8 weeks follow up are shown (upper panel). (C) Quantification of percent LV fibrosis (lower panel, N=8-9), NPPA gene expression (left panel), and NT-proANP biomarker plasma levels (right panel). (D-F) The same as (C), but for, respectively (D) LGALS3/Gal-3, (E) GDF-15 and (F) TIMP-1 (N=6-10). Gene expression corrected for 36B4 and shown as fold changes relative to the 8 weeks sham group (N=6-9). Plasma levels N=8-9. Bars represent means. Error bars represent SEM. *P<0.05 versus control group. #P<0.05 versus tLAD. Black bar in (B) represents 2 mm.
Figure 3
Figure 3
Cardiac function, remodeling and biomarker expression 4 and 8 weeks after TAC. (A) Representative MRI images of short axis in systole and diastole (upper panel). EF (%) 8 weeks after tLAD and pLAD, as determined by MRI. (B) Representative images of mid-ventricular slices stained with FITC-WGA to determine cell size (upper panels). Quantification of cell size based on FITC-WGA staining (lower panel). (C) NPPA gene expression (left panel), and NT-proANP biomarker plasma levels (right panel). (D-F) The same as (C), but for, respectively (D) LGALS3/Gal-3, (E) GDF-15 and (F) TIMP-1. All analysis N=15-20 for sham, N=8-10 per TAC group. Bars represent means. Error bars represent SEM. *P<0.05 versus control group. #P<0.05 versus TAC 4 wks. Red bar in (B) represents 50 µm.
Figure 4
Figure 4
Biomarker gene expression in different organs post-TAC and lung-associated protein levels. (A-D) Gene expression levels in LV, liver, kidney and lung at 4 and 8 weeks post-TAC. (A) NPPA, (B) LGALS3, (C) GDF-15, (D) TIMP-1. N=15-20 for sham group of TAC experiment. For other groups, N=7-10. Bars represent means. Error bars represent SEM. *P<0.05 versus control group. #P<0.05 versus TAC 4wks. (E) Quantification of lung protein levels of Gal-3 (left), GDF-15 (middle) and TIMP-1 (right). (F) Association between GDF-15 and TIMP-1 plasma levels and their respective lung protein levels. (G) Association between GDF-15 and TIMP-1 lung protein levels and lung weight. Points in graph represent individual measurements of combined groups (N=17-25). Spearman's correlation test was performed.
Figure 5
Figure 5
Cardiac function, remodeling and biomarker expression in hypertensive/obese mice. (A) Representative cardiac magnetic resonance imaging (MRI) images of the short axis of the LFD, HFD and HFD+AngII groups at 16wks. EF (%) as determined by MRI (lower panel). (B) Representative images of Masson's trichrome-stained mid-ventricular sections of the LFD, HFD and HFD+AngII groups. Quantification of percent LV fibrosis (lower panel). (C) NPPA gene expression (left panel), and NT-proANP biomarker plasma levels (right panel). (D-F) The same as (C), but for, respectively (D) Gal-3, (E) GDF-15 and (F) TIMP-1. N=7-13. Bars represent means. Error bars represent SEM. *P<0.05 versus LFD. #P<0.05 versus HFD. Black bar in (B) represents 2 mm.
Figure 6
Figure 6
HF biomarkers in visceral adipose tissue of hypertensive/obese mice. Gene expression changes are presented as fold change relative to LV levels in the LFD group (dashed lines). (A) NPPA gene expression (left) and ANP protein levels (right) in VAT. (B-D) The same for, respectively, (B) Gal-3, (C) GDF-15 and (D) TIMP-1. The dashed line shows the levels observed in the LV of the LFD group. N=4-10. Bars represent means. Error bars represent SEM. *P<0.05 versus LFD. #P<0.05 versus HFD.
Figure 7
Figure 7
Model of organ/tissue involvement in plasma biomarker levels. Model with simplified schematic depiction of organ/tissue contribution to plasma biomarkers levels. Included organs/tissues: heart, lungs, kidney, liver and visceral adipose tissue (VAT). Larger arrow represents stronger relative contribution.

Similar articles

Cited by

References

    1. Chow SL, Maisel AS, Anand I. et al. Role of biomarkers for the prevention, assessment, and management of heart failure: A Scientific Statement From the American Heart Association. Circulation. 2017;135:e1054–e1091. - PubMed
    1. Ponikowski P, Voors AA, Anker SD. et al. 2016 ESC Guidelines for the diagnosis and treatment of acute and chronic heart failure: the task force for the diagnosis and treatment of acute and chronic heart failure of the European Society of Cardiology (ESC). Developed with the special contribution of the Heart Failure Association (HFA) of the ESC. Eur J Heart Fail. 2016;18:891–975. - PubMed
    1. Yancy CW, Jessup M, Bozkurt B. et al. 2017 ACC/AHA/HFSA Focused Update of the 2013 ACCF/AHA Guideline for the management of heart failure: a report of the American College of Cardiology/American Heart Association task force on clinical practice guidelines and the Heart Failure Society of America. J Card Fail. 2017;23:628–651. - PubMed
    1. de Boer RA, Daniels LB, Maisel AS. et al. State of the art: newer biomarkers in heart failure. Eur J Heart Fail. 2015;17(6):559–569. - PubMed
    1. Piek A, Du W, de Boer RA. et al. Novel heart failure biomarkers: why do we fail to exploit their potential? Crit Rev Clin Lab Sci. 2018;55(4):246–263. - PubMed

MeSH terms