Review
. 2018 May 23;5(8):1800064.
doi: 10.1002/advs.201800064. eCollection 2018 Aug.

Recent Progress on Layered Double Hydroxides and Their Derivatives for Electrocatalytic Water Splitting

Affiliations
Review

Recent Progress on Layered Double Hydroxides and Their Derivatives for Electrocatalytic Water Splitting

Yanyong Wang et al. Adv Sci (Weinh). .

Abstract

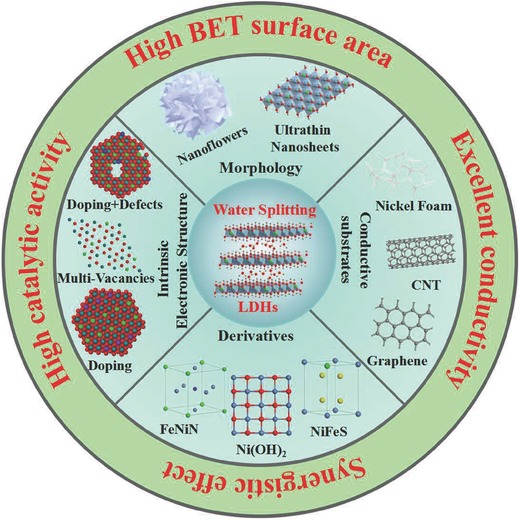
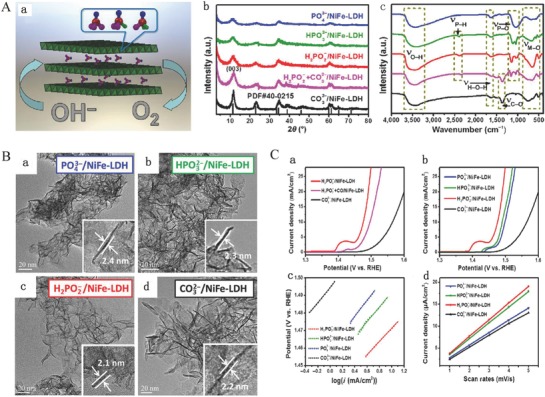
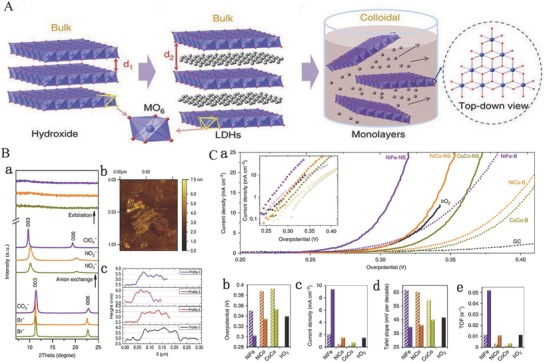
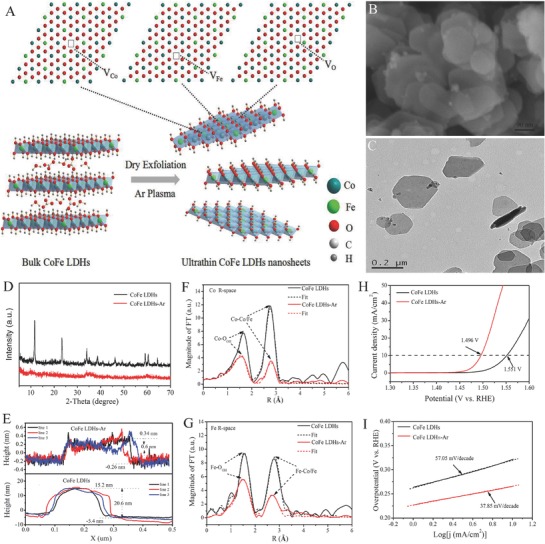
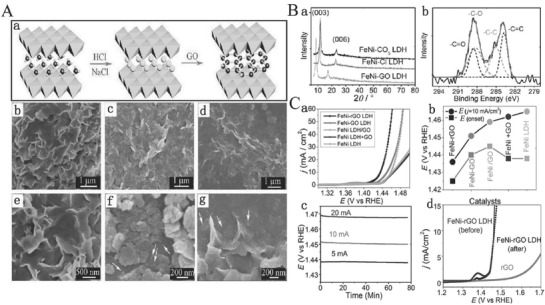
Layered double hydroxide (LDH)-based materials have attracted widespread attention in various applications due to their unique layered structure with high specific surface area and unique electron distribution, resulting in a good electrocatalytic performance. Moreover, the existence of multiple metal cations invests a flexible tunability in the host layers; the unique intercalation characteristics lead to flexible ion exchange and exfoliation. Thus, their electrocatalytic performance can be tuned by regulating the morphology, composition, intercalation ion, and exfoliation. However, the poor conductivity limits their electrocatalytic performance, which therefore has motivated researchers to combine them with conductive materials to improve their electrocatalytic performance. Another factor hampering their electrocatalytic activity is their large lateral size and the bulk thickness of LDHs. Introducing defects and tuning electronic structure in LDH-based materials are considered to be effective strategies to increase the number of active sites and enhance their intrinsic activity. Given the unique advantages of LDH-based materials, their derivatives have been also used as advanced electrocatalysts for water splitting. Here, recent progress on LDHs and their derivatives as advanced electrocatalysts for water splitting is summarized, current strategies for their designing are proposed, and significant challenges and perspectives of LDHs are discussed.

Keywords: electrocatalysts; hydrogen evolution reaction; layered double hydroxides; oxygen evolution reaction; water splitting.


Figures

Scheme 1
Scheme 1
LDHs and their derivatives as electrocatalysts for water splitting.
Figure 1
Figure 1
A) TEM and AFM. a,b) TEM images of Ni0.75V0.25‐LDH (inset of (b): selected area electron diffraction pattern); c) AFM image and d) height profile of Ni0.75V0.25‐LDH nanosheets. B) LSV curves and Tafel plots. a) LSV curves and b) Tafel plots of Ni0.75Fe0.25‐LDH and Ni0.75V0.25‐LDH. C) Adsorption geometries of the intermediates H2O, *OH, *O, and *OOH in (a)–(d), respectively. The red, blue, white, and gray atoms represent the O, Ni, H, and V atoms, respectively. The adsorption structures are similar to these when one Ni is substituted by Fe instead of V; e) the free‐energy landscape. Reproduced with permission.63 Copyright 2016, Nature Publishing Group.
Figure 2
Figure 2
A) Schematic illustration of the fabrication procedures of the self‐standing 3D core–shell Cu@NiFe LDH electrocatalysts. B) Electrocatalytic performance and stability of 3D core–shell Cu@NiFe LDH electrocatalysts conducted in 1 m KOH. a) Polarization curves for OER; b) polarization curves for HER; c) polarization curves for overall water splitting; d) chronopotentiometry curves for OER at constant current densities of 10 and 100 mA cm−2; e) time dependence of the current density for HER under a constant overpotential of 162 mV to afford a current density of 50 mA cm−2; f) chronopotentiometry curves for overall water splitting at constant current densities of 10 and 100 mA cm−2. Reproduced with permission.81 Copyright 2017, The Royal Society of Chemistry.
Figure 3
Figure 3
A) Total DOS and partial DOS () curves of NiFeMn‐LDH and NiFe‐LDH. B) Structural image of NiFeMn‐LDH; C) TEM image of NiFeMn‐LDH; D) LSV curves of NiFeMn‐LDH, NiFe‐LDH, NiMn‐LDH, and the commercial Ir/C catalyst; E) the corresponding Tafel plots; F) the corresponding overpotential at a current density of 20 mA cm−2; G) the required overpotential of the different Mn content in the ternary LDHs at 10 and 20 mA cm−2, respectively. Reproduced with permission.131 Copyright 2016, The Royal Society of Chemistry.
Figure 4
Figure 4
A) Structural scheme of phosphate, phosphite, and hypophosphite‐intercalated NiFe‐LDH a); b) the XRD patterns for standard NiFe‐LDH and as‐synthesized CO3 2−/NiFe‐LDH, H2PO2 +CO3 2−/NiFe‐LDH, H2PO2 /NiFe‐LDH, HPO3 2−/ NiFe‐LDH, and PO4 3−/NiFe‐LDH; c) FTIR spectra of the all as‐synthesized NiFe‐LDH nanosheets. B) TEM images of a) PO4 3−/NiFe‐LDH, b) HPO3 2−/ NiFe‐LDH, c) H2PO2 /NiFe‐LDH, and d) CO3 2−/NiFe‐LDH; insets show the representative thickness of the corresponding LDH. C) Electrocatalytic performance of as‐synthesized samples: a) polarization curves of H2PO2 /NiFe‐LDH, H2PO2 +CO3 2−/NiFe‐LDH, and CO3 2−/NiFe‐LDH; b) polarization curves of PO4 3−/NiFe‐LDH, HPO3 2−/NiFe‐ LDH, H2PO2/NiFe‐LDH, and CO3 2−/NiFe‐LDH; c) corresponding Tafel plots; d) C dl calculations for the four catalysts. Reproduced with permission.69 Copyright 2017, Springer Link.
Figure 5
Figure 5
A) Schematic diagram of exfoliating LDH. a) LDHs; b) LDHs with interlayer anions and water molecules; d 2 > d 1 (interlayer distance); c) exfoliated LDHs into monolayers nanosheets. B) XRD patterns and AFM images. a) XRD patterns including NiFe LDH, NiCo LDH, and CoCo LDH; b) AFM image of monolayer nanosheets of NiCo LDH; c) the corresponding height profile of monolayer nanosheets of NiCo LDH. C) Electrochemical properties. a) LSV polarization curves of synthesized LDHs and IrO2 at 5 mV s−1 in 1 m KOH electrolyte; b) overpotential of synthesized LDHs and IrO2 at 10 mA cm−2; c) current densities of synthesized LDHs and IrO2 at an overpotential of 300 mV; d) corresponding Tafel slopes; e) TOF calculated at an overpotential of 300 mV. Reproduced with permission.71 Copyright 2014, Nature Publishing Group.
Figure 6
Figure 6
A) Illustration of Ar plasma exfoliated CoFe LDH nanosheets; B) SEM and C) TEM image of the ultrathin CoFe LDHs‐Ar nanosheets; D) XRD patterns of the bulk CoFe LDH nanosheets and ultrathin CoFe LDHs‐Ar nanosheets; E) the corresponding height curves; F) magnitude of k 3‐weighted Fourier transforms of the Co edge XANES spectra for bulk‐CoFe LDHs and ultrathin CoFe LDHs‐Ar with the corresponding curve‐fitting results; G) magnitude of k 3‐weighted Fourier transforms of the Fe edge XANES spectra for bulk CoFe LDHs and ultrathin CoFe LDHs‐Ar with the corresponding curve‐fitting results; H) the OER performance of bulk CoFe LDHs and the ultrathin CoFe LDH‐Ar nanosheets; I) the corresponding Tafel plots. Reproduced with permission.73 Copyright 2017, Wiley‐VCH.
Figure 7
Figure 7
A) Synthesis process of FeNi LDH‐GO by the anion exchange a) and SEM images of as‐synthesized FeNi‐CO3 LDHs b,e), FeNi‐Cl LDHs c,f), and FeNi‐GO LDHs d,g); B) XRD pattern and XPS spectra of FeNi LDHs. a) XRD patterns of as‐synthesized FeNi‐CO3 LDHs, FeNi‐Cl LDHs, and FeNi‐GO LDHs. b) XPS spectrum of C 1s for as‐synthesized FeNi‐GO LDH hybrid. C) Electrochemical properties of all synthesized catalysts for OER. a) The LSV curves of FeNi LDH, FeNi LDH+GO, FeNi LDH/GO, FeNi‐GO LDH, and FeNi‐rGO LDH on nickel foam electrodes in 1 m KOH electrolyte; b) the corresponding onset potential and potential at a current density of 10 mA cm−2; c) chronopotentiometry curves of the FeNi‐rGO LDH on nickel foam at 5, 10, and 20 mA cm−2, respectively; d) the LSV curves of FeNi‐rGO LDH and rGO before and after chronopotentiometry measurement at constant a current density of 10 mA cm−2 for about 8 h. Reproduced with permission.76 Copyright 2014, Wiley‐VCH.
Figure 8
Figure 8
A) Schematic of the spatially confined nNiFe LDH/NGF hybrids. B) Cross‐sectional TEM image of nNiFe LDH/NGF electrocatalyst. C) LSV curves of all samples for OER in 0.1 m KOH electrolyte. D) The corresponding Tafel plots. E) The corresponding kinetics (Tafel slope) and activity (the overpotential required to achieve 10 mA cm−2) of all samples in contrast to other references. Reproduced with permission.78 Copyright 2015, Wiley‐VCH.
Figure 9
Figure 9
A) Schematic illustration of the fabrication of NiFe LDH‐NS@DG nanocomposite a). B) Electrochemical performance of all synthesized electrocatalysts for OER and HER. a) The LSV curves of all synthesized electrocatalysts for OER in 1 m KOH electrolyte. Inset: The overpotential required at 10 mA cm−2. b) The corresponding Tafel slopes for OER. c) Chronopotentiometry curves of the NiFe LDH‐NS@DG10 at constant current densities of 5 and 10 mA cm−2, respectively. d) The LSV curves of all synthesized electrocatalysts for HER in 1 m KOH electrolyte. e) The corresponding Tafel slopes for HER. d) The LSV curves for the NiFe LDH‐NS@DG10 before and after 8000 CV cycles. C) The curve of overall water splitting for NiFe LDH‐NS@DG10 on nickel foam with a loading of 2 mg cm−2 as bifunctional catalyst in 1 m KOH a). b) To achieve 20 mA cm−2, the required voltage for the NiFe LDH‐NS@DG catalyst and other non‐noble metal bifunctional catalysts. c) Demonstration of a solar power–assisted water‐splitting device with a voltage of 1.5 V. Reproduced with permission.158 Copyright 2017, Wiley‐VCH.
Figure 10
Figure 10
A) The synthesis model of single‐crystalline β‐Ni(OH)2 ultrathin nanomeshes. a) The structure of a Ni–Al LDH monolayer. b) The porous β‐Ni(OH)2 nanosheets with various pore sizes after etching by strong alkaline solution. c) The formation of single‐crystalline β‐Ni(OH)2 ultrathin nanomeshes with abundant and uniform nanopores by the interlayered Ostwald ripening process. B) The structural benefits of the β‐Ni(OH)2 ultrathin nanomeshes as OER electrocatalyst. C) Characterization. a) XRD patterns of the single‐crystalline β‐Ni(OH)2 ultrathin nanomeshes and as‐exfoliated Ni–Al LDH nanosheets; TEM b), AFM c), and HERTEM d) images of the single‐crystalline β‐Ni(OH)2 ultrathin nanomeshes. D) Electrochemical performances of synthesized catalysts in 1 m KOH electrolyte. a) LSV curves of the single‐crystalline β‐Ni(OH)2 ultrathin nanomeshes, β‐Ni(OH)2 nanosheets, and as‐exfoliated Ni–Al LDH nanosheets. b) The corresponding mass activity. c) The estimation of Cdl for β‐Ni(OH)2 ultrathin nanomeshes and β‐Ni(OH)2 nanosheets. d) TOF plots of β‐Ni(OH)2 ultrathin nanomeshes and β‐Ni(OH)2 nanosheets at applied potentials. Reproduced with permission.93 Copyright 2017, Wiley‐VCH.
Figure 11
Figure 11
A) Schematic fabrication process for the nanometer‐sized Fe‐CoOOH nanoparticles assembled on graphene by treating the CoFeAl‐LDH/G hybrids in concentrated alkaline solution. B) TEM images of nanometer‐sized Fe‐CoOOH/G nanohybrids a,b). C) N2 adsorption/desorption isotherms of the Fe‐CoOOH/G nanohybrids and the pore size distribution calculated from the DFT method. D) Electrochemical performance of all as‐synthesized samples for OER. a) LSV curves; b) the corresponding Tafel plots; c) the corresponding kinetics (Tafel slope) and activity (the overpotential required to achieve 10 mA cm−2) of all samples in contrast to other references; d) electrochemical impedance spectroscopy of the as‐synthesized CoOOH/G, Fe‐CoOOH, and Fe‐CoOOH/G electrocatalysts at the potential of 1.60 V; e) the estimation of Cdl for CoOOH/G, Fe‐CoOOH, and Fe‐CoOOH/G; f) chronopotentiometry curves of the Fe‐CoOOH/G, CoOOH/G, and RuO2 at a constant current density of 10 mA cm−2. Reproduced with permission.92 Copyright 2017, Wiley‐VCH.
Figure 12
Figure 12
A) Synthetic route and structural characterization of the NiCoP nanostructure. a) Schematic illustration of the synthetic route for NiCoP nanostructure on Ni foam. b) XRD patterns of NiCo‐OH and the converted NiCoP. The asterisks mark the diffraction peaks from Ni foam. c) SEM image of NiCo‐OH. d) SEM images and e) the corresponding EDS elemental maps of the NiCoP. f,g) TEM images, h) SAED pattern, and i) high‐resolution TEM image and EDS spectrum (inset) of the NiCoP. The dashed white line highlights the crystalline–amorphous boundary. B) HER electrocatalysis in 1 m KOH. a) IR‐corrected polarization curves per geometric area of the NiCoP/NF recorded at a scan rate of 3 mV s−1, along with Ni2P/NF, NiCo−OH/NF, and NF for comparison. b) Polarization curve–derived Tafel slopes for the corresponding electrocatalysts. C) OER electrocatalysis in 1 m KOH. a) IR‐corrected polarization curves per geometric area of the NiCo‐P/NF recorded at a low scan rate of 0.5 mV s−1, along with Ni−P/NF, NiCo−OH/NF, and NF for comparison. b) Polarization curve–derived Tafel slopes for the corresponding electrocatalysts. D) NiCoP/NF electrocatalyst for overall water splitting in 1 m KOH. a) Schematic illustration of two‐electrode cell using NiCoP/ NF for both anode and cathode for water splitting. b) Polarization curve recorded at 0.5 mV s−1. Inset: Digital photograph of the two electrode configuration. c) Long‐term stability test carried out at constant current densities of 10, 20, and 50 mA cm−2. Reproduced with permission.94 Copyright 2016, American Chemistry Society.
Figure 13
Figure 13
A) SEM images of a) FeNi LDH precursor, b) β‐INS nanosheets, and c) metallic α‐INS nanosheets. TEM images d,g), HRTEM images f,i) and the corresponding Fourier transformed patterns e, h) of the β‐INS d–f) and the α‐INS g–i) nanosheets. B) Schematic reaction pathway of HER on α‐INS ultrathin nanosheets in acid environment a). b) Kinetic energy barrier profiles of HER on α‐INS and α‐NiS nanosheets. The yellow, blue, and red spheres in A1−A3 represent S, Ni, and Fe atoms, respectively. C) ECSA tests of catalysts toward HER in the acidic electrolytes of 0.5 m H2SO4. a) LSV curves of β‐NiS‐, β‐INS‐, and α‐INS‐catalyzed HER, and b) CV curves of β‐INS and c) β‐NiS nanosheets with various scan rates. d) Charging current density differences plotted against scan rates. The linear slope, equivalent to twice the double‐layer capacitance, C dl, was used to represent the ECSA. Reproduced with permission.95 Copyright 2015, American Chemistry Society.

References

    1. Turner J. A., Science 2004, 305, 972. - PubMed
    1. Seh Z. W., Kibsgaard J., Dickens C. F., Chorkendorff I., Nørskov J. K., Jaramillo T. F., Science 2017, 345, 1593. - PubMed
    1. Chu S., Majumdar A., Nature 2012, 488, 294. - PubMed
    1. Jiao Y., Zheng Y., Jaroniec M., Qiao S. Z., Chem. Soc. Rev 2015, 44, 2060. - PubMed
    1. Lewis N. S., Nocera D. G., P. Natl. Acad. Sci. USA 2006, 103, 15729. - PMC - PubMed