. 2018 Jul 5;5(8):935-951.
doi: 10.1002/acn3.592. eCollection 2018 Aug.

Monoclonal antibodies from a patient with anti-NMDA receptor encephalitis

Affiliations

Monoclonal antibodies from a patient with anti-NMDA receptor encephalitis

Rashmi Sharma et al. Ann Clin Transl Neurol. .

Abstract

Objective: Anti-NMDA receptor encephalitis (ANRE) is a potentially lethal encephalitis attributed to autoantibodies against the N-methyl-D-aspartate receptor (NMDAR). We sought to clone and characterize monoclonal antibodies (mAbs) from an ANRE patient.

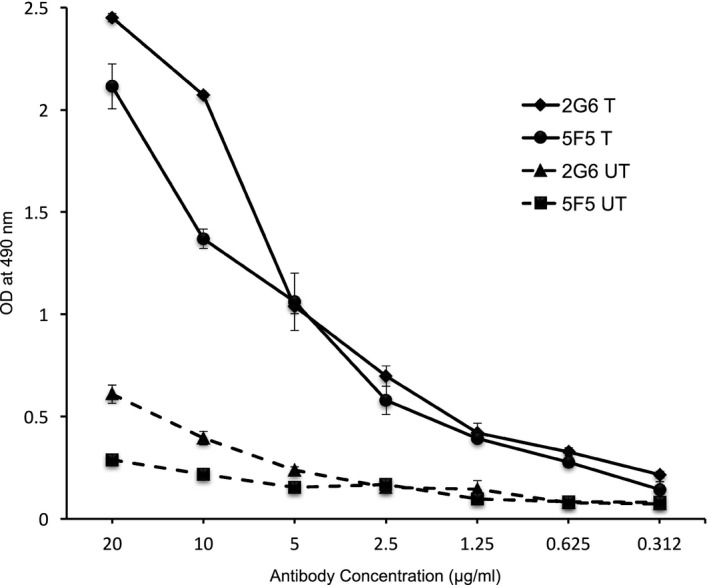
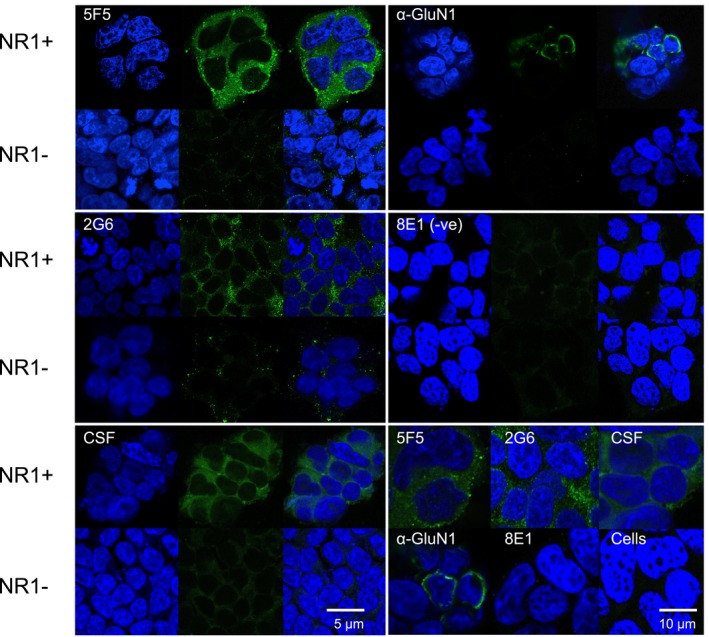
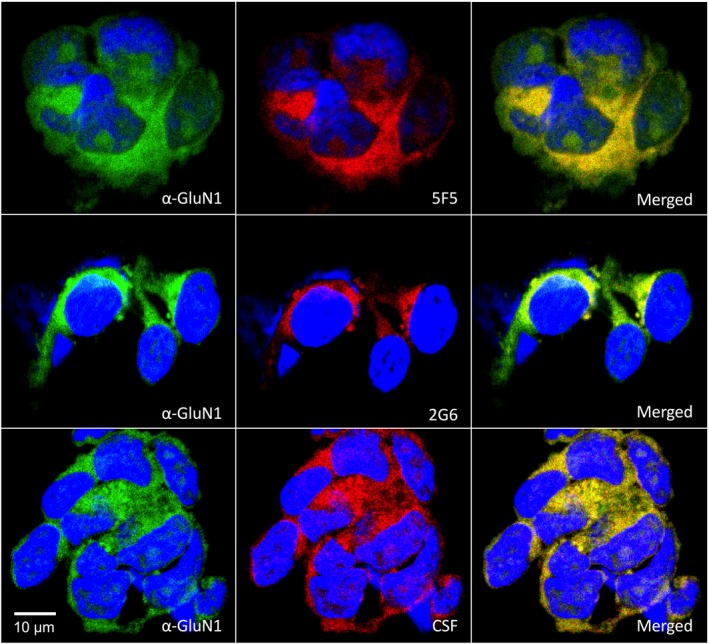
Methods: We used a hybridoma method to clone two IgG mAbs from a female patient with ANRE without teratoma, and characterized their binding activities on NMDAR-transfected cell lines, cultured primary rat neurons, and mouse hippocampus. We also assessed their effects on voluntary locomotor activity in mice and binding to NMDAR in vivo.

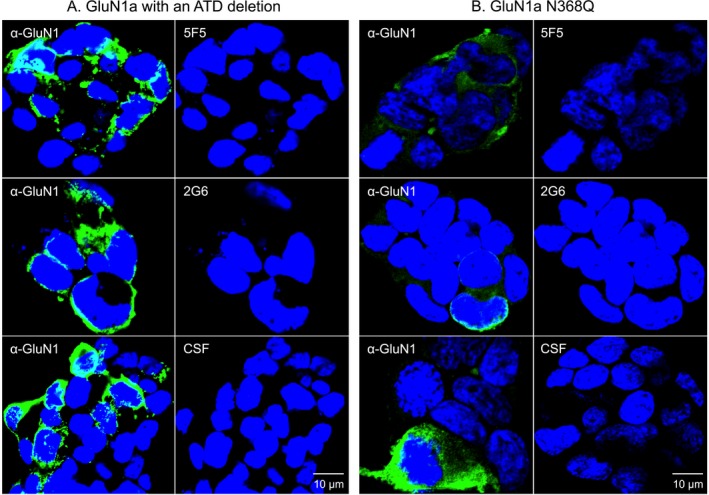
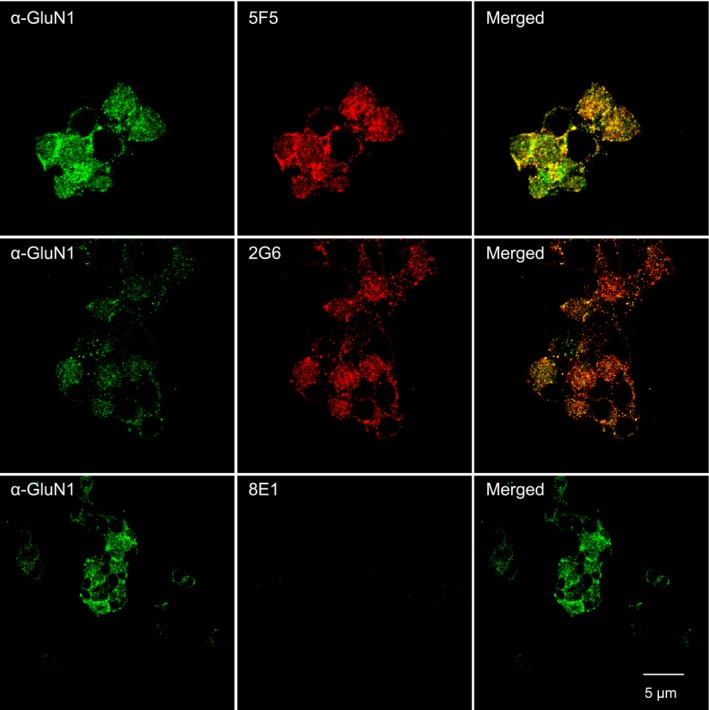
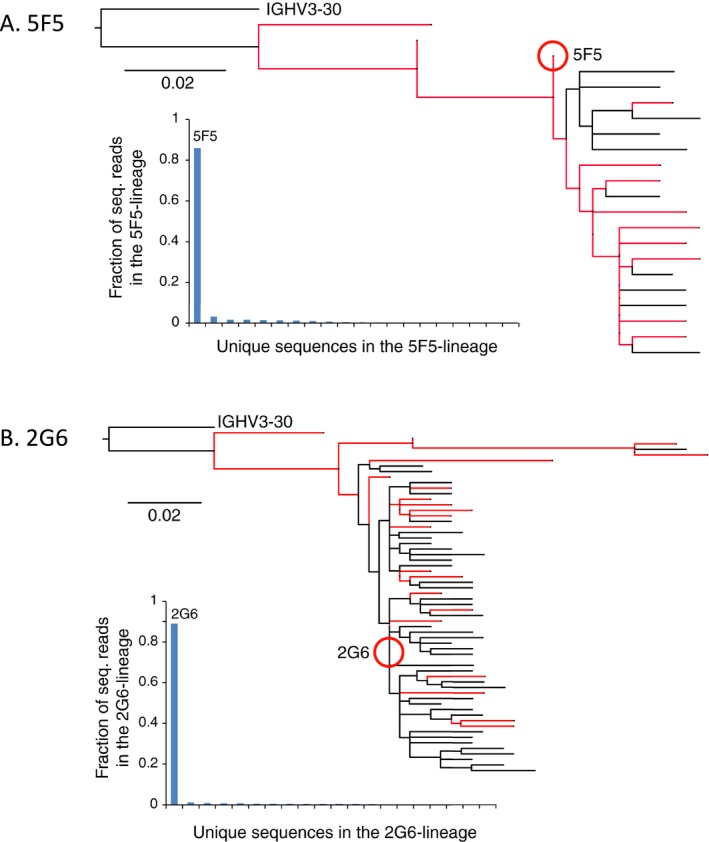
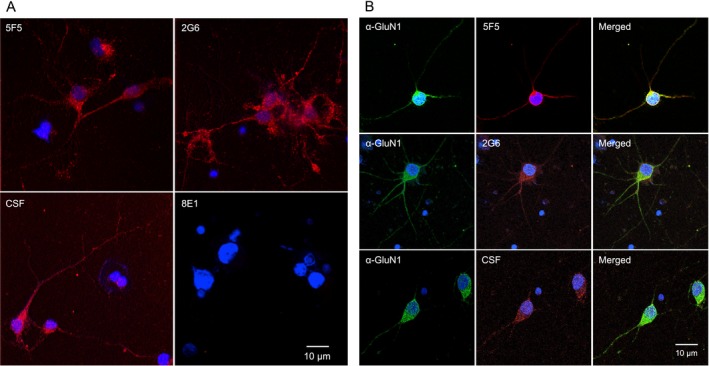
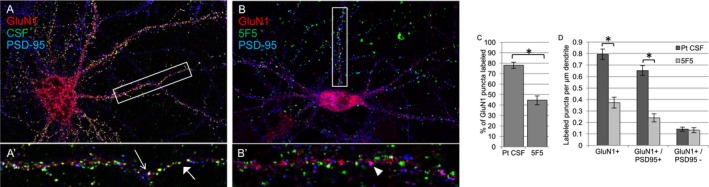
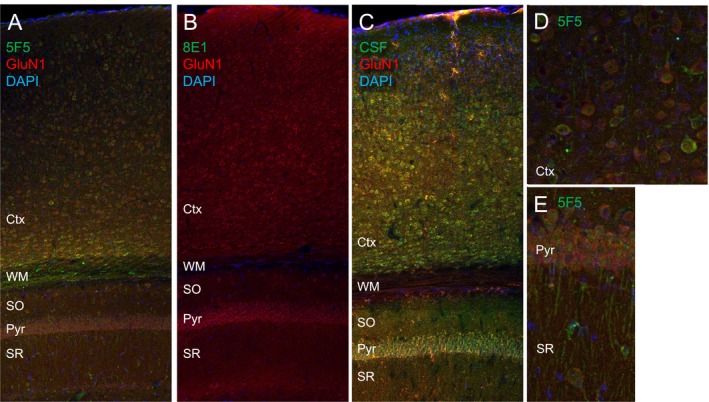
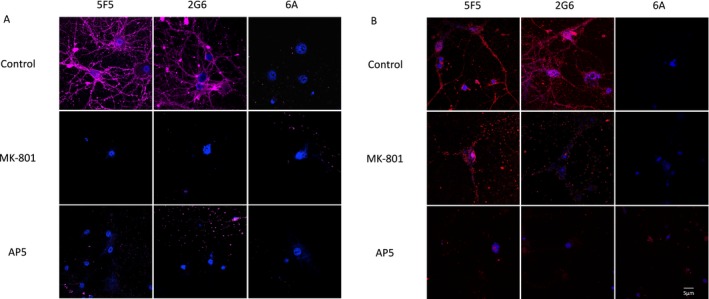
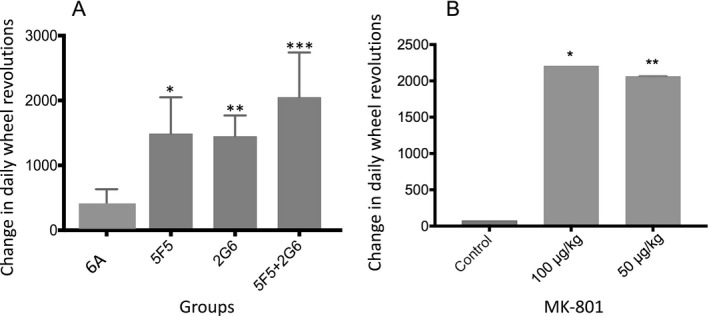
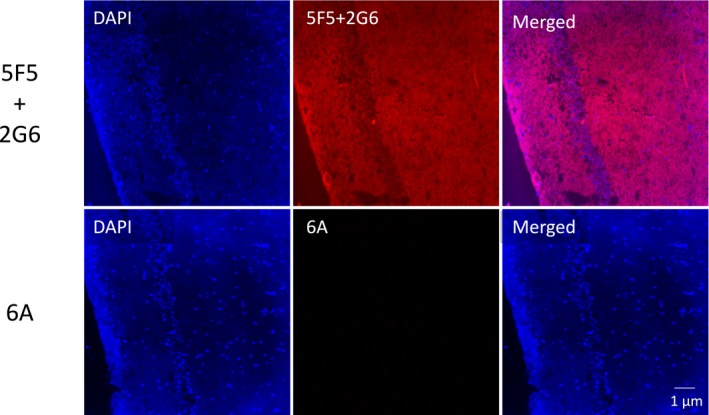
Results: The mAbs are structurally distinct and arose from distinct B-cell lineages. They recognize different epitopes on the GluN1 amino terminal domain (ATD), yet both require amino acids important for post-translational modification. Both mAbs bind subsets of GluN1 on cultured rat hippocampal neurons. The 5F5 mAb binds mouse brain hippocampal tissues, and the GluN1 recognized on cultured rat neurons was substantially extra-synaptic. Antibody binding to primary hippocampal neurons induced receptor internalization. The NMDAR inhibitor MK-801 inhibited internalization without preventing mAb binding; AP5 inhibited both mAb binding and internalization. Exposure of mice to the mAbs following permeabilization of the blood brain barrier increased voluntary wheel running activity, similar to low doses of the NMDAR inhibitor, MK-801.

Interpretation: These mAbs recapitulate features demonstrated in previous studies of ANRE patient CSF, and exert effects on NMDAR in vitro and in vivo consistent with modulation of NMDAR activity.


Figures

Figure 1
Figure 1
Monoclonal IgG antibodies from ANRE patients bind HEK 293T cells expressing GluN1/2a. Triplicate serial dilutions of the 5F5 and 2G6 mAbs were assessed for binding to HEK293T cells transfected with GluN1a and GluN2a expression plasmids (T) or untransfected (UT) in a whole cell lysate ELISA. Both 5F5 and 2G6 bind preferentially to GluN1/GluN2a expressing cells. OD, optical density.
Figure 2
Figure 2
Fluorescent immunostaining by the 5F5 and 2G6 mAbs of HEK293T cells expressing GluN1/2a. HEK293T cells with (NR1 + ) or without (NR1‐) transient expression of GluN1 and GluN2a were immunostained with 5F5 (top left panel), 2G6 (middle left panel), ANRE patient CSF (bottom left panel), murine anti‐GluN1 (top right panel), or 8E1 non‐specific control IgG (middle right panel), followed by the corresponding anti‐human or anti‐mouse Alexa 488 secondary antibody (green) and nuclear DAPI stain (blue), and visualized by confocal microscopy. For each antibody are shown, from left to right: DAPI, mAb‐only, and merged images. Scale bar = 5 μm. The bottom right panel shows higher magnification merged images of 5F5, 2G6, ANRE CSF, anti‐GluN1, 8E1, as well as a control sample not exposed to human antibody (Cells). 5F5, 2G6, and patient CSF bind preferentially to GluN1/GluN2a expressing cells. Scale bar = 10 μm.
Figure 3
Figure 3
Colocalization of the 5F5 and 2G6 human mAbs with a murine anti‐GluN1 mAb on HEK293T cells expressing GluN1/GluN2a. HEK 293T cells expressing GluN1 and GluN2a were co‐immunostained with either 5F5, 2G6 or CSF (red) and the murine anti‐GluN1 antibody (green). In each row, from left to right are shown cells stained with the anti‐GluN1 mAb, human mAb or CSF, and merged images. Nuclei were visualized by DAPI staining. Colocalization of the GluN1 antigens recognized by the mAbs is demonstrated by the yellow fluorescence in the merged images. Scale bar = 10 μm.
Figure 4
Figure 4
GluN1 structural changes known to impair antigen binding by ANRE patient CSF IgGs also inhibit 5F5 and 2G6 binding. HEK293T cells expressing mutant GluN1 proteins were stained with a commercial anti‐GluN1 antibody (green), followed by 5F5, 2G6, or CSF (red). Nuclei were stained with DAPI. (A) The GluN1 amino terminal deletion mutant protein (ATD). (B) GluN1 with the N368Q mutation. Neither mutant GluN1 protein was recognized by 5F5, 2C6, or CSF. Scale bars = 10 μm.
Figure 5
Figure 5
Binding of the 5F5 and 2G6 mAbs to the GluN1 Amino Terminal Domain (ATD). The GluN1‐ATD, fused to the PDGF receptor transmembrane domain, was stably expressed on the surface of HEK 293T cells. Cells were immunostained with a commercial anti‐GluN1 antibody (green), followed by 5F5, 2G6, or the 8E1 negative control mAb (red). Both 5F5, 2C6 mAbs bind to the GluN1 ATD, whereas the 8E1 does not. Scale bar = 5 μm.
Figure 6
Figure 6
Assessment of potential antigen binding competition between 5F5 and 2G6 on the HEK293T‐ATD cell line. 5F5 and 2G6 mAbs were each biotinylated and tested for binding to the HEK293T‐ATD cell line in the presence of increasing concentrations of the other mAb, and relative luminescence values were measured (RLV). In each experiment, potential competition was measured with a value of 100% competition defined as reduction in binding seen with the homologous mAb. (A) 5F5‐biotin binding vs. increasing 2G6. (B) 5F5 biotin vs. increasing 5F5. (C) 2G6‐biotin vs. increasing 5F5. (D) 2G6‐biotin vs. increasing 2G6.
Figure 7
Figure 7
Phylogenetic analyses of the 5F5 and 2G6 mAb lineages. The patient's peripheral blood B‐cell population was sampled, after in vitro proliferation and prior to cell fusion, and analyzed by Ig heavy chain sequencing. Lineages were defined to include sequences with >80% nucleotide sequence homology in CDRH3 domain, and were analyzed by Clustal sequence analysis. Sequences with identical CDRH3 domains are shown in red. Below each dendrogram is plotted the fraction of total sequencing reads for each lineage member. (A) 5F5. (B) 2G6.
Figure 8
Figure 8
The 5F5 and 2G6 mAbs bind GluN1 on rat hippocampal neurons. (A) Neurons were cultured for 14 days and stained with ANRE CSF or mAbs (red). Top left, 5F5. Top right, 2G6. Bottom left, CSF. Bottom right, 8E1. Nuclei were stained with DAPI. Scale bar = 10 μm. (B) Neurons were stained with ANRE CSF or mAbs (red), and costained with murine anti‐GluN1 antibody (green). Rows: Top, 5F5. Middle, 2G6. Bottom, CSF. Columns: Left, GluN1. Middle, CSF or mAbs. Right, Merged images. Nuclei were stained with DAPI. Scale bar = 10 μm.
Figure 9
Figure 9
mAb 5F5 recognizes a subset of GluN1+ puncta on neurons. Live rat hippocampal neurons at 14 population doublings were stained with either (A, A’) ANRE CSF or (B, B’) 5F5 (green), and then with the commercial anti‐GluN1 mAb (red) and an anti‐PSD‐95 antibody (blue), to label synapses. ANRE CSF labels almost 80% of GluN1 puncta (A, A’, C). Most puncta are colocalized with PSD‐95 (blue); white in overlay (open arrow). Some ANRE CSF+/GluN1+ puncta are not colocalized with PSD‐95; yellow in overlay (closed arrow). (B, B’, C) 5F5 labels less than half of the GluN1 puncta. (D) Mean labeled puncta per μm dendrite, ±SEM *P < 0.0001, Student's t‐test with Bonferroni correction. N = 4 neurons, 10 dendrites, per condition. Less frequent 5F5 binding to neurons, relative to ANRE CSF, reflects different staining frequencies at synaptic sites (GluN1+/PSD‐95+), rather than extrasynaptic sites (PSD‐95‐/GluN1+). (A, B) 200X. (A’, B’) 400X.
Figure 10
Figure 10
Staining of murine brain with the 5F5 mAb. Murine hippocampal sections were immunostained with the 5F5 or 8E1 mAbs, or ANRE CSF (green), in combination with the commercial anti‐GluN1 mAb (red), and DAPI. (A) 5F5, 200X. (B) 8E1, 200X. (C) ANRE patient CSF, 200X. (D) 5F5 on cortex, 400X. (E) 5F5 on the pyramidal cell layer, 400X. Ctx, cortex; WM, white matter; SO, stratum oriens; Pyr, pyramidal cell layer; SR, stratum radiatum.
Figure 11
Figure 11
Internalization of the 5F5 and 2G6 mAbs by hippocampal neurons and the effects of MK‐801 and AP5. (A) Rat hippocampal neurons were incubated with 5F5, 2G6, or 6A mAbs conjugated to the pH‐sensitive fluorescent dye, CypHer5E, which is activated by the low pH in endosomes, alone and in the presence of MK‐801 or AP5. (B) Neurons treated with MK‐801 or AP5 were assessed for binding of the 5F5, 2G6, or 6A mAbs. Scale bar = 5 μm.
Figure 12
Figure 12
Alterations in voluntary running activity induced by 5F5 and 2G6 mAbs. (A) Voluntary running activity was measured in mice before and after receiving 5F5, 2G6, or both mAbs. Prior to mAb administration, the mice received a dose of LPS to open the blood brain barrier. Baseline levels were recorded for 4 days prior to LPS/mAb administration, and compared to the 4 day steady state period following recovery from LPS toxicity. The differences in the average number of daily wheel revolutions are shown. One‐way ANOVA *P = 0.026, **P = 0.033, ***P = 0.0005. (B) Voluntary running activity was measured in mice before and after receiving MK‐801 (100 μg/kg or 50 μg/kg). Baseline levels were recorded for 4 days prior to MK‐801 injection, and compared to the 4 days following the injection. The differences in the average numbers of daily wheel revolutions are shown. One‐way ANOVA *P = 0.0001, **P = 0.0001. Error bars indicate S.E.M.
Figure 13
Figure 13
Interaction of the 5F5 and 2G6 mAbs with murine hippocampus following intravenous injection. Mice received a dose of LPS, followed 15 min later by either the 6A mAb or a combination of 5F5 and 2G6. One hour later, hippocampal frozen sections were prepared and stained for human IgG (red). Top row, 5F5 and 2G6. Bottom row, 6A. Scale bar = 1 μm.

References

    1. Dalmau J, Tuzun E, Wu HY, et al. Paraneoplastic anti‐N‐methyl‐D‐aspartate receptor encephalitis associated with ovarian teratoma. Ann Neurol 2007;61:25–36. - PMC - PubMed
    1. Armangue T, Titulaer MJ, Malaga I, et al. Pediatric anti‐N‐methyl‐D‐aspartate receptor encephalitis‐clinical analysis and novel findings in a series of 20 patients. J Pediatr 2013;162:850–6e2. - PMC - PubMed
    1. Dalmau J, Gleichman AJ, Hughes EG, et al. Anti‐NMDA‐receptor encephalitis: case series and analysis of the effects of antibodies. Lancet Neurol 2008;7:1091. - PMC - PubMed
    1. Hughes EG, Peng X, Gleichman AJ, et al. Cellular and synaptic mechanisms of anti‐NMDA receptor encephalitis. J Neurosci 2010;30:5866–5875. - PMC - PubMed
    1. Zhang Q, Tanaka K, Sun P, et al. Suppression of synaptic plasticity by cerebrospinal fluid from anti‐NMDA receptor encephalitis patients. Neurobiol Dis 2012;45:610–615. - PubMed