. 2018 Dec;19(6):717-727.
doi: 10.1007/s10162-018-00688-x. Epub 2018 Aug 20.

Effects of Masker Envelope Fluctuations on the Temporal Effect

Affiliations

Effects of Masker Envelope Fluctuations on the Temporal Effect

Skyler G Jennings et al. J Assoc Res Otolaryngol. 2018 Dec.

Abstract

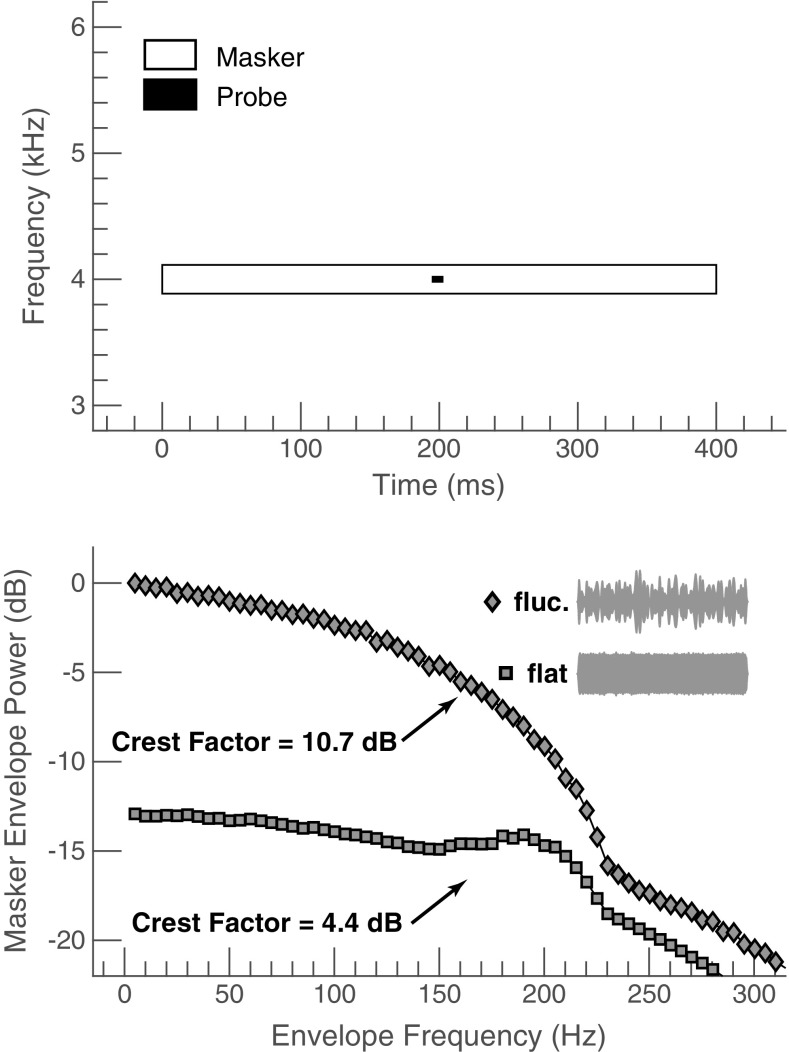
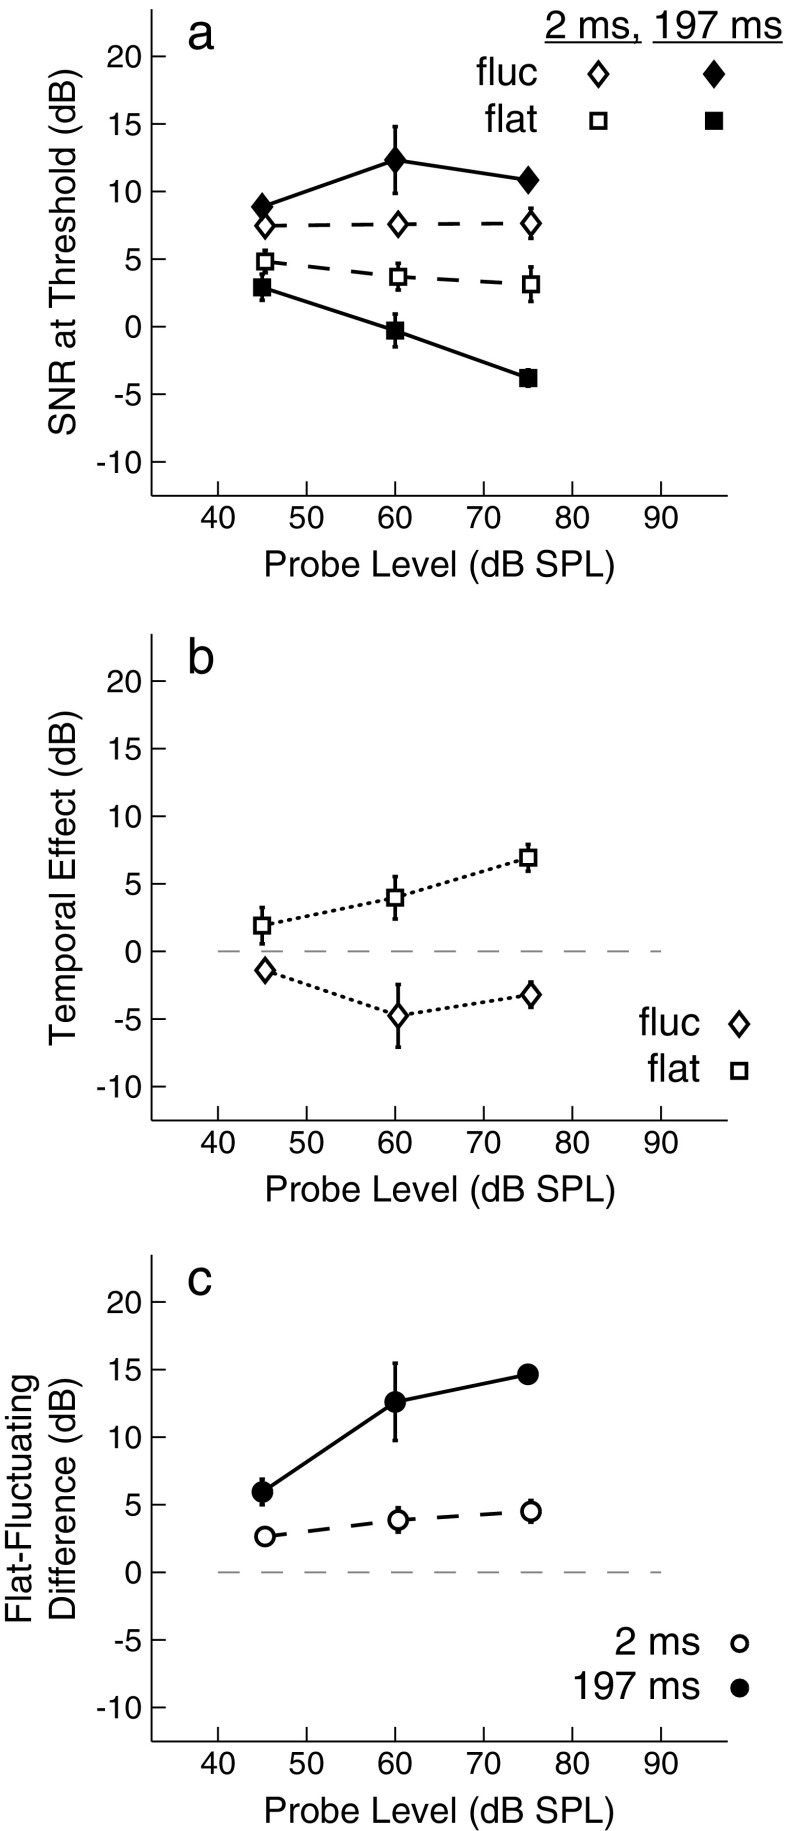
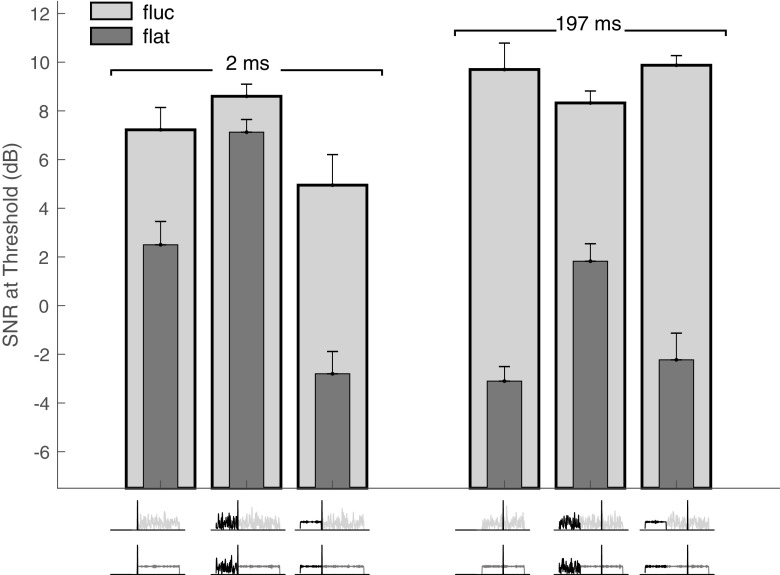
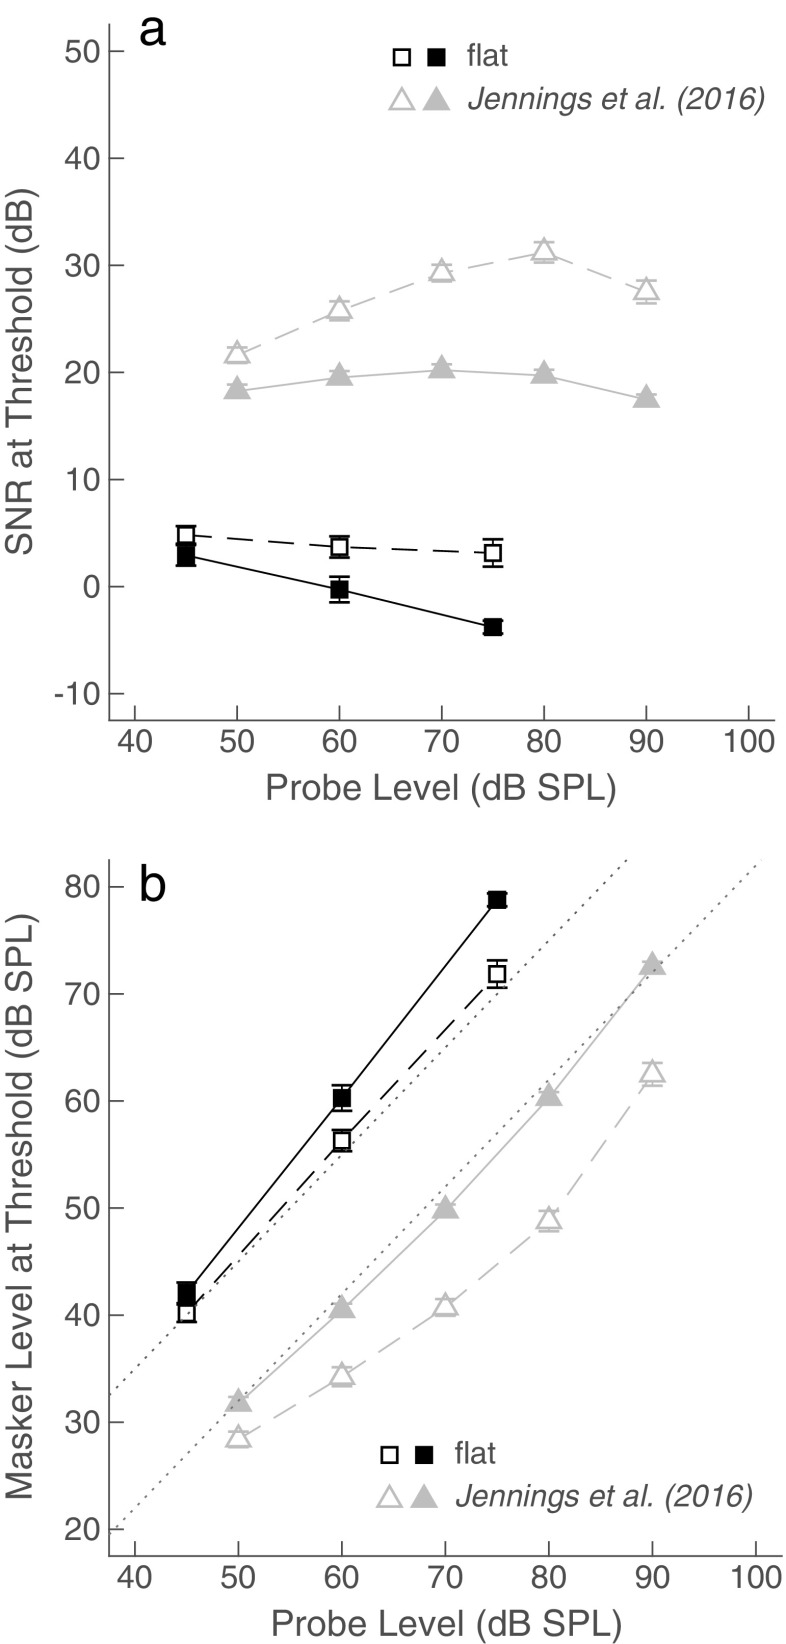
Under certain conditions, detection thresholds in simultaneous masking improve when the onset of a short sinusoidal probe is delayed from the onset of a long masker. This improvement, known as the temporal effect, is largest for broadband maskers and is smaller or absent for narrowband maskers centered on the probe frequency. This study tests the hypothesis that small or absent temporal effects for narrowband maskers are due to the inherent temporal envelope fluctuations of Gaussian noise. Temporal effects were measured for narrowband noise maskers with fluctuating ("fluctuating maskers") and flattened ("flattened maskers") temporal envelopes as a function of masker level (Exp. I) and in the presence of fluctuating and flattened precursors (Exp. II). The temporal effect was absent for fluctuating narrowband maskers and as large as ~ 7 dB for flattened narrowband maskers. The AC-coupled power of the temporal envelopes of precursors and maskers accounted for 94 % of the variance in probe detection thresholds measured with fluctuating and flattened precursors and maskers. These results suggest that masker temporal envelope fluctuations contribute to the temporal effect and should be considered in future modeling efforts.

Keywords: masking; temporal effects; temporal envelope.


Conflict of interest statement

The authors declare that they have no conflict of interest.

Figures

Fig. 1
Fig. 1
Schematic representation of the stimuli (upper panel) and masker temporal envelope power spectra (lower panel), along with corresponding waveform insets. The 4000-Hz, 6-ms probe was presented either near the onset or temporal center of the 400-ms masker (only the temporal center condition is shown). The masker bandwidth was 0.5 equivalent rectangular bandwidths (228 Hz) and was centered linearly on the probe frequency. Crest factors were calculated at the output of an auditory filter centered on the probe frequency in order to quantify the degree of masker fluctuation for fluctuating (fluc., diamonds) and flattened (flat, squares) maskers
Fig. 2
Fig. 2
Results from Exp. 1. a Average signal-to-noise ratio (SNR; probe level–masker level) at threshold as a function of probe level and probe delay for fluctuating (“fluc,” diamonds) and flattened (“flat,” squares) maskers. SNRs at threshold for probes presented at the masker’s onset (2 ms) and the masker’s temporal center (197 ms) are plotted as open and filled symbols, respectively. b The temporal effect, as calculated by subtracting masker levels at threshold for probes presented at the masker’s onset from those obtained for probes presented at the masker’s temporal center. c The flat-fluctuating difference (see text) for probes presented at the masker’s onset (open circles, dashed lines) or at the masker’s temporal center (closed circles, solid lines). In b and c, the horizontal dashed gray lines are plotted at 0 dB for reference. Error bars are one standard error of the mean
Fig. 3
Fig. 3
Results from Exp. 2. SNR at threshold is plotted for either fluctuating (light gray bars) or flattened (dark gray bars) maskers preceded by silence, or by fluctuating or flattened precursors (see temporal envelope waveforms below the x-axis). The group of bars to the left is for probes presented near the onset of the masker. The group of bars to the right is for probes presented near the temporal center of the masker
Fig. 4
Fig. 4
The results of a correlation analysis between SNRs at threshold and the average AC-coupled temporal envelope power in a 400-ms, rectangular window temporally centered on the probe. Open and filled symbols represent probes presented near the onset and temporal center of the masker, respectively. Temporal envelope waveforms in the legend indicate conditions with fluctuating or flattened maskers preceded by silence, or preceded by fluctuating or flattened precursors
Fig. 5
Fig. 5
Comparison of temporal effects measured with broadband Gaussian noise maskers (triangles, Jennings et al. 2016), and narrowband low-fluctuating maskers (squares, current study) in terms of a SNR at threshold and b growth of masking. SNR and masker level at threshold for probes presented near the masker’s onset and the masker’s temporal center are displayed as open and closed symbols, respectively. Dotted lines provide a reference for linear (1 dB/dB) growth of masking

Similar articles

Cited by

References

    1. Almishaal A, Bidelman GM, Jennings SG. Notched-noise precursors improve detection of low-frequency amplitude modulation. J Acoust Soc Am. 2017;141:324–333. doi: 10.1121/1.4973912. - DOI - PMC - PubMed
    1. Bacon SP. Effect of masker level on overshoot. J Acoust Soc Am. 1990;88:698–702. doi: 10.1121/1.399773. - DOI - PubMed
    1. Bacon SP, Viemeister NF. The temporal course of simultaneous tone-on-tone masking. J Acoust Soc Am. 1985;78:1231–1235. doi: 10.1121/1.392891. - DOI - PubMed
    1. Bacon SP, Smith MA. Spectral, intensive, and temporal factors influencing overshoot. Q J Exp Psychol A. 1991;43:373–399. doi: 10.1080/14640749108400978. - DOI - PubMed
    1. Bacon SP, Takahashi GA. Overshoot in normal-hearing and hearing-impaired subjects. J Acoust Soc Am. 1992;91:2865–2871. doi: 10.1121/1.402967. - DOI - PubMed

Publication types

LinkOut - more resources