Inter-reader agreement of magnetic resonance imaging proton density fat fraction and its longitudinal change in a clinical trial of adults with nonalcoholic steatohepatitis
- PMID: 30128694
- PMCID: PMC6382605
- DOI: 10.1007/s00261-018-1745-3
Inter-reader agreement of magnetic resonance imaging proton density fat fraction and its longitudinal change in a clinical trial of adults with nonalcoholic steatohepatitis
Abstract
Purpose: To determine the inter-reader agreement of magnetic resonance imaging proton density fat fraction (PDFF) and its longitudinal change in a clinical trial of adults with nonalcoholic steatohepatitis (NASH).
Study type: We performed a secondary analysis of a placebo-controlled randomized clinical trial of a bile acid sequestrant in 45 adults with NASH. A six-echo spoiled gradient-recalled-echo magnitude-based fat quantification technique was performed at 3 T. Three independent readers measured MRI-PDFF by placing one primary and two additional regions of interest (ROIs) in each segment at both time points. Cross-sectional agreement between the three readers was evaluated using intra-class correlation coefficients (ICCs) and coefficients of variation (CV). Additionally, we used Bland-Altman analyses to examine pairwise agreement between the three readers at baseline, end of treatment (EOT), and for longitudinal change.
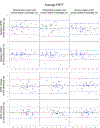
Results: Using all ROIs by all readers, mean PDFF at baseline, at EOT, and mean change in PDFF was 16.1%, 16.0%, and 0.07%, respectively. The 27-ROI PDFF measurements had 0.998 ICC and 1.8% CV at baseline, 0.998 ICC and 1.8% CV at EOT, and 0.997 ICC for longitudinal change. The 9-ROI PDFF measurements had corresponding values of 0.997 and 2.6%, 0.996 and 2.4%, and 0.994. Using 27 ROIs, the magnitude of the bias between readers for whole-liver PDFF measurement ranged from 0.03% to 0.06% points at baseline, 0.01% to 0.07% points at EOT, and 0.01% to 0.02% points for longitudinal change.
Conclusion: Inter-reader agreement for measuring whole-liver PDFF and its longitudinal change is high. 9-ROI measurements have only slightly lower agreement than 27-ROI measurements.
Keywords: Inter-reader agreement; Liver; Proton density fat fraction (PDFF); Quantitative imaging biomarker; Region of interest; Reproducibility.
Conflict of interest statement
Conflict of Interest:
Jonathan C. Hooker declares that he has no conflict of interest.
Dr. Gavin Hamilton declares that he has no conflict of interest.
Charlie C. Park declares that he has no conflict of interest.
Dr. Steven Liao declares that he has no conflict of interest.
Tanya Wolfson declares that she has no conflict of interest.
Dr. Soudabeh Fazeli Dehkordy declares that she has no conflict of interest.
Dr. Cheng William Hong declares that he has no conflict of interest.
Dr. Adrija Mamidipalli declares that she has no conflict of interest.
Dr. Anthony Gamst declares that he has no conflict of interest.
Figures


References
-
- Idilman IS, Aniktar H, Idilman R, et al. Hepatic steatosis: quantification by proton density fat fraction with MR imaging versus liver biopsy. Radiology 2013;267(3):767–775. - PubMed
Publication types
MeSH terms
Substances
Grants and funding
LinkOut - more resources
Full Text Sources
Other Literature Sources
Medical

