Review
. 2018 Sep;285(1):55-71.
doi: 10.1111/imr.12689.

Interferon at the cellular, individual, and population level in hepatitis C virus infection: Its role in the interferon-free treatment era

Affiliations
Review

Interferon at the cellular, individual, and population level in hepatitis C virus infection: Its role in the interferon-free treatment era

Rubesh Raja et al. Immunol Rev. 2018 Sep.

Abstract

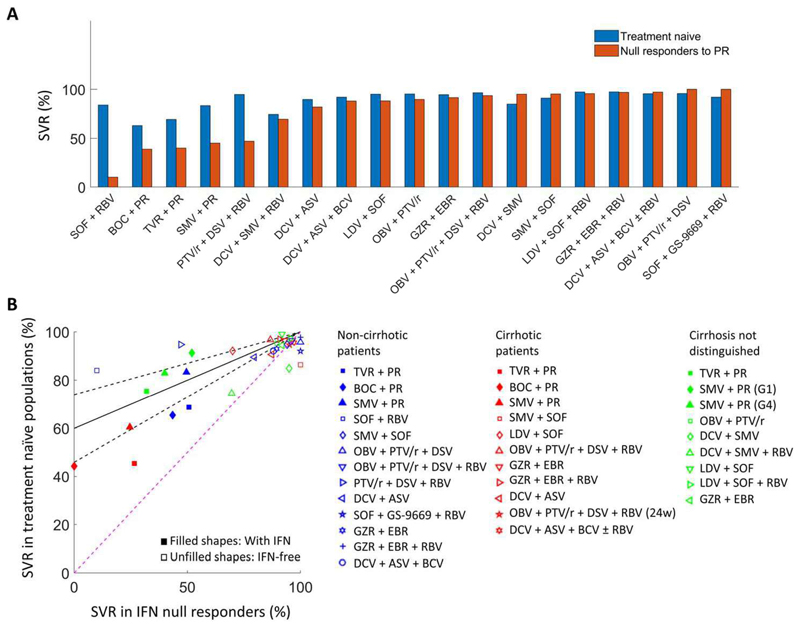
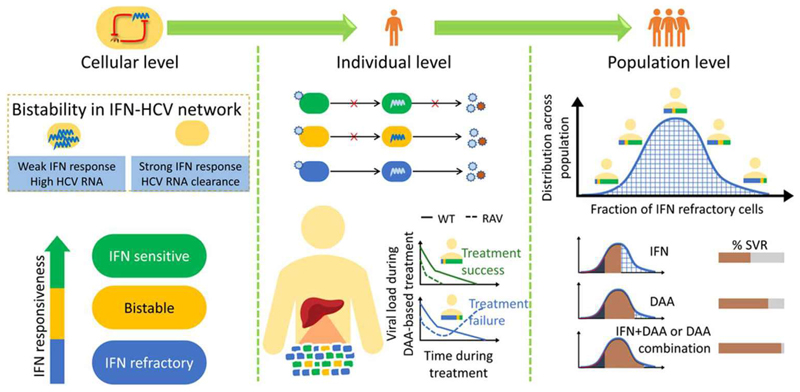
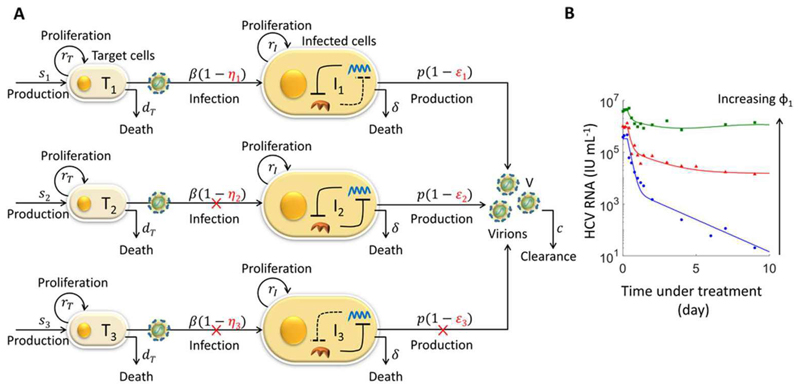
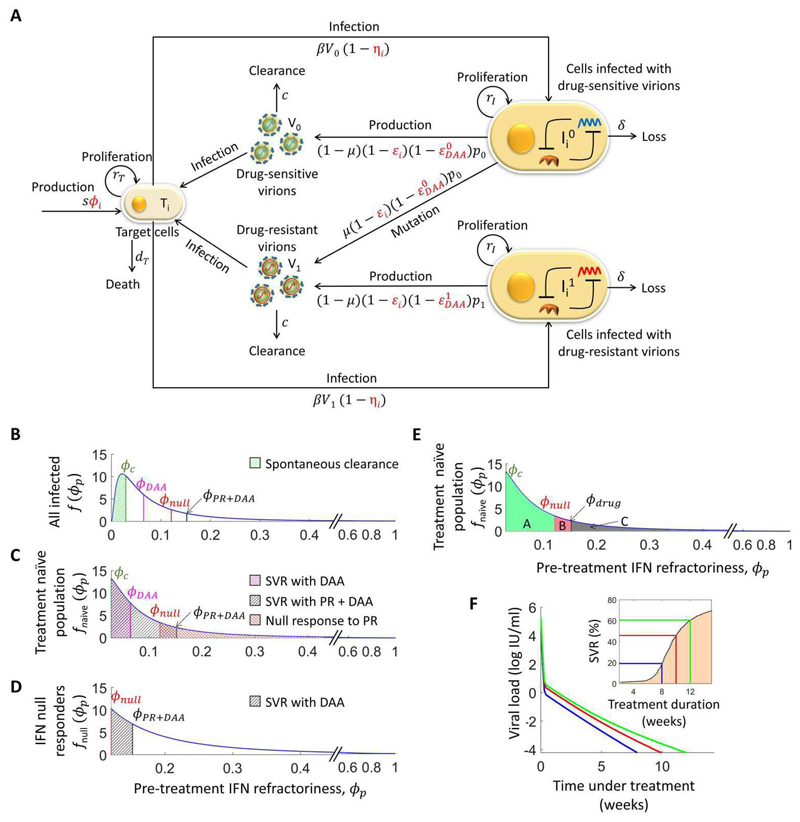
The advent of powerful direct-acting antiviral agents (DAAs) has revolutionized the treatment of hepatitis C. DAAs cure nearly all patients with short duration, oral treatments. Significant efforts are now underway to optimize DAA-based treatments. We discuss the potential role of interferon in this optimization. Clinical studies present compelling evidence that DAAs perform better in treatment-naive individuals than in individuals who previously failed treatment with interferon, a surprising correlation because interferon and DAAs are thought to act independently. Recent mathematical models explore a mechanistic hypothesis underlying this correlation. The hypothesis invokes the action of interferon at the cellular, individual, and population levels. Strong interferon responses prevent the productive infection of cells, reduce viral replication, and impede the development of resistance to DAAs in infected individuals and improve cure rates elicited by DAAs in treated populations. The models develop descriptions of these processes, integrate them into a comprehensive framework, and capture clinical data quantitatively, providing a successful test of the hypothesis. Individuals with strong endogenous interferon responses thus present a promising subpopulation for reducing DAA treatment durations. This review discusses the conceptual advances made by the models, highlights the new insights they unravel, and examines their applicability to optimize DAA-based treatments.

Keywords: bistability; direct-acting antiviral agents; interferon signaling; multiscale modeling; sustained virological response; viral kinetics.


Figures

Figure 1
Figure 1. Interferon improves DAA treatment outcomes.
(A) Sustained virological response rates (SVR) elicited by different drug combinations in treatment naïve individuals (blue) and previous null responders to combination therapy with interferon and ribavirin (red). Data for a given drug combination from all relevant clinical trials (see text) have been combined. SVR rates in treatment naïve individuals are significantly higher than in previous null responders except for the combinations where the SVR rates are nearly 100%, where the differences are not significant. (B) The data in (A) presented as a correlation between SVR rates in treatment naïve and null responders. The datasets are further classified based on whether the populations were cirrhotic and non-cirrhotic, the treatments were with or without interferon, and where available based on the HCV genotype and treatment duration. The black lines indicate model predictions (solid) and their 95% confidence intervals (dashed). The pink dashed line marks the y=x boundary. The acronyms for the drugs are as follows: SOF – sofosbuvir; RBV – ribavirin; BOC – boceprevir; PR – pegylated interferon and ribavirin; TVR – telaprevir; SMV – simeprevir; PTV/r – paritaprevir/ritonavir; DSV – dasabuvir; DCV – daclatasvir; ASV – asunaprevir; BCV – beclbuvir; LDV – ledipasvir; OBV – ombitasvir; GZR – grazoprevir; EBR – elbasvir; GS-9669 – radalbuvir
Figure 2
Figure 2. Schematic of the overall modeling framework.
At the cellular level, the interferon signaling network in the presence of HCV is characterized by a double negative feedback motif, which yields bistability. HCV thrives in one steady state and is cleared in the other. Depending on the strength of the interferon response relative to the strength of its subversion by HCV, cells could admit the first steady state alone, both the steady states or the second steady state alone. They are accordingly termed interferon refractory (blue), bistable (yellow) and interferon responsive (green). At the level of the infected individual, the relative prevalence of these cellular phenotypes defines the outcomes of therapy. Interferon refractory cells continue to get infected and produce virions during therapy with PR. Uninfected bistable cells are protected from infection, but infected ones continue viral production. Interferon responsive cells are cured and protected. When the fraction of interferon refractory cells is low, treatment with DAAs succeeds as both the wild-type and resistance associated variants (RAVs) are controlled, whereas when the fraction is high, RAVs rise and induce treatment failure. At the population level, a distribution of the latter fraction exists. Individuals with the fraction smaller than a critical fraction (brown region) succeed. The critical fraction increases as more drugs are used in combination, improving SVR rates.
Figure 3
Figure 3. Interferon signaling in infected cells.
(A) A schematic of the interferon signaling network in the presence of HCV demonstrating ISG production and HCV-induced translational block via PKR (left), which together yield a double negative feedback motif (right). The network includes ISG expression following stimulation of the JAK-STAT pathway with interferon and the resulting control of HCV replication by key ISGs. At the same time, it considers the suppression of ISG translation by HCV via PKR dimerization and autophosphorylation, and the resulting depletion of eIF2α-GTP due to the phosphorylation of eIF2α-GDP and the sequestration of eIF2B. These competing interactions between HCV and interferon give rise to the double negative feedback loop. (B) Model predictions of the steady state expression of HCV RNA levels for fixed ISG levels (blue) and ISG levels for fixed HCV RNA levels (red). The intersections of the curves yield the steady states of the network. The filled circles are stable and the empty circle is unstable. (C) HCV RNA levels measured 20 h post interferon exposure as a function of the time of interferon addition post infection (green) and the corresponding model predictions (purple) without (top) and with PKR silencing (bottom). Note that the switch in the HCV RNA levels is not sharp because the data are averaged across cells and also because the steady states may not be achieved within 20 h. (D) The steady state HCV RNA levels admitted by the system as ISG induced control of HCV is repressed by the factor ω. Regions I, II, and III define cells that are interferon refractory, bistable, and interferon responsive, respectively.
Figure 4
Figure 4. Viral kinetics during PR therapy.
(A) A schematic illustrating the extension of the basic model to account for the three cellular interferon response phenotypes. Subscripts 1, 2, and 3 represent the interferon refractory, bistable, and interferon responsive phenotypes, respectively. The phenotypes arise due to the different relative strengths of interferon-mediated control of HCV replication and the subversion of the interferon response by HCV. These are shown inside infected cells symbolically as strong (solid line) and weak (dashed line). In each category, target cells T are produced at rate s, they proliferate at the rate rT, die at rate dT and are infected by virions V at the rate β to yield infected cells I, which proliferate at the rate rI, die at the rate δ and produce virions at the rate p. Free virions are cleared at the rate c. (The rates are all per capita or represent suitable rate constants.) The fractions of cells in the different phenotypes ϕ1, ϕ2 and ϕ3 determine s1=sϕ1 and so on. PR blocks productive infection of target cells with effectiveness η and inhibits viral production from infected cells with effectiveness ε. The response phenotypes imply that η1=ε1=ε2=0 and η2=η3=ε3=1. (B) Fits of model predictions (lines) to data of viral load changes (symbols) during PR therapy in a responder (blue), partial responder (red) and null responder (green). The initial viral load, Vss, β and ϕ1 were adjustable. Poorer responses yielded higher values of ϕ1.
Figure 5
Figure 5. Response to DAA-based therapy.
(A) A schematic of the model in Fig. 4 extended to include DAAs and viral mutation and drug resistance. Viruses are now divided into drug sensitive (denoted ‘0’) and resistant (denoted ‘1’). DAAs block the production of these strains with strain-specific effectiveness εDAA. Mutations occur at the rate μ. Resistant strains are assumed to suffer a cost in the replicative ability resulting in a lower production rate from infected cells. The schematic applies to all the interferon response phenotypes. (B)-(D) Distributions of the pre-treatment fraction of interferon refractory cells, ϕp, in all infected individuals, chronically infected individuals, and null responders to PR, respectively. ϕc, ϕDAA, ϕnull, and ϕPR+DAA represent threshold values of ϕp that define spontaneous clearers, responders to a DAA, null responders to PR, and responders to PR+DAA, respectively. (E) An illustration of the relationship between the SVR rates in treatment naïve individuals and previous null responders to PR. The areas of the shaded regions are marked with alphabets. For a given drug combination, let SVR be achieved when ϕp<ϕdrug. SVR in treatment naïve individuals would thus be the area SVRnaive=A+B. SVR in null responders would be the ratio SVRnull=B/(B+C), because the percentage of null responders to PR is NULL=B+C. Recognizing that A+B+C=1, it follows that SVRnaive=1 − NULL + NULL×SVRnull· The relationship provides the fit in Fig. 1B and is also close to predictions of the model above. Note that when SVRnaive<100%, SVRnull is lessthan SVRnaïve, whereas when SVRnaïve approaches 100%, the two become equal. (F) Viral kinetics illustrating the reduction in the required time for SVR from ~12 weeks (green) to ~8 weeks (blue) as ϕp decreases. The inset shows the percentage of the population that would respond to a representative treatment regimen as the treatment duration is decreased. Using the distribution of ϕp in treatment naïve individuals and SVR rates as a function of treatment duration, it follows that 20% of the patients, with high interferon responsiveness, can afford a reduction in treatment to 8 weeks, and ~50% with intermediate responsiveness to 10 weeks, from the prescribed 12 weeks.

Similar articles

Cited by

References

    1. Guidelines for the screening care and treatment of persons with chronic hepatitis C infection. Geneva: World Health Organization; 2016. - PubMed
    1. Homer SM, Naggie S. Successes and challenges on the road to cure hepatitis C. PLoS Pathog. 2015;11:e1004854. - PMC - PubMed
    1. Koizumi Y, Ohashi H, Nakajima S, et al. Quantifying antiviral activity optimizes drug combinations against hepatitis C virus infection. Proc Natl Acad Sci. 2017;114:1922–1927. - PMC - PubMed
    1. Ohashi H, Koizumi Y, Fukano K, et al. Reply to Padmanabhan and Dixit: Hepatitis C virus entry inhibitors for optimally boosting direct-acting antiviral-based treatments. Proc Natl Acad Sci. 2017;114:E4527–E4529. - PMC - PubMed
    1. Padmanabhan P, Dixit NM. Inhibitors of hepatitis C virus entry may be potent ingredients of optimal drug combinations. Proc Natl Acad Sci. 2017;114:E4524–E4526. - PMC - PubMed

Publication types