

Integrated Telehealth and Telecare for Monitoring Frail Elderly with Chronic Disease
- PMID: 30129884
- PMCID: PMC6299847
- DOI: 10.1089/tmj.2017.0322
Integrated Telehealth and Telecare for Monitoring Frail Elderly with Chronic Disease
Abstract
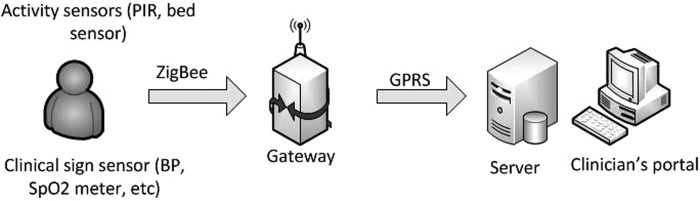
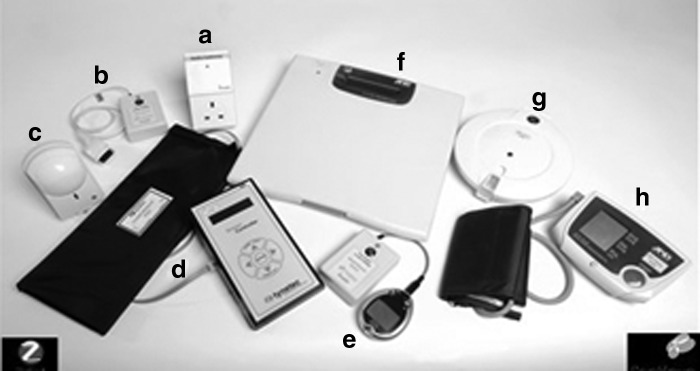
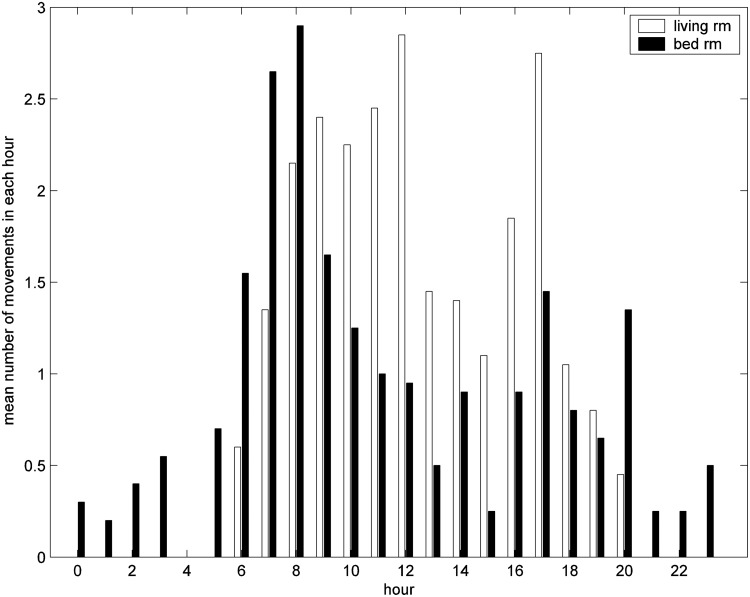
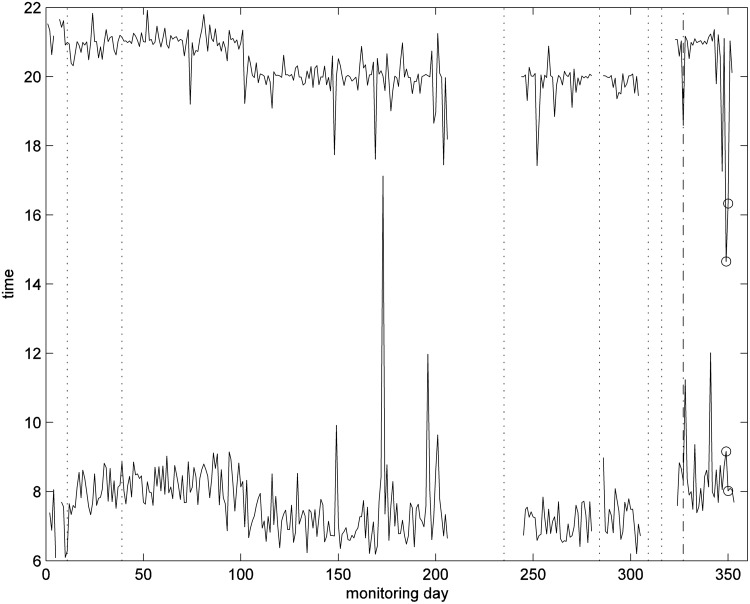
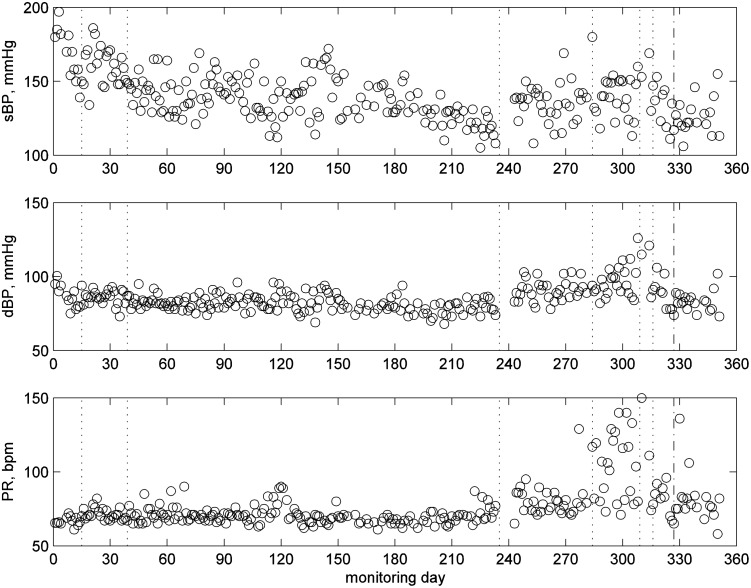
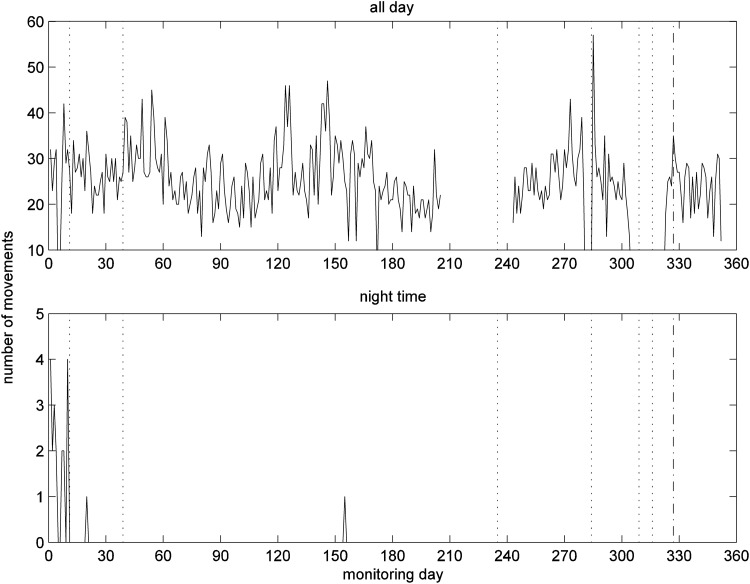
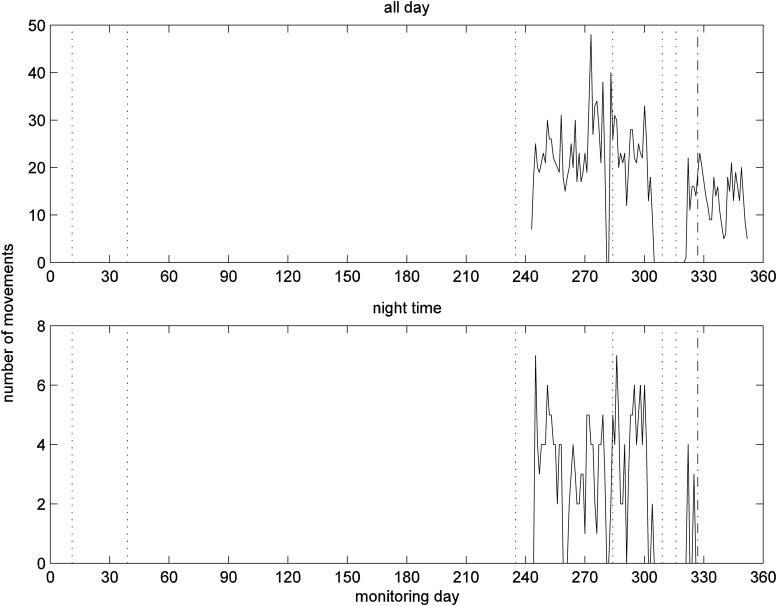
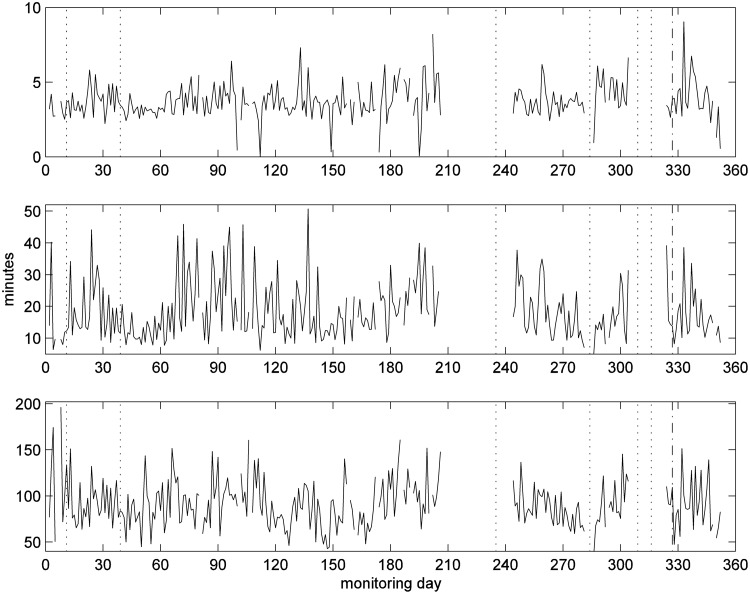
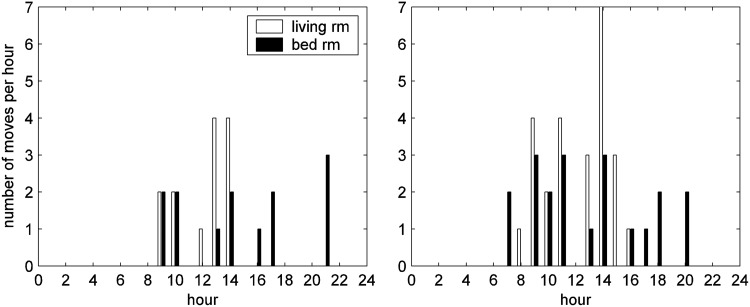
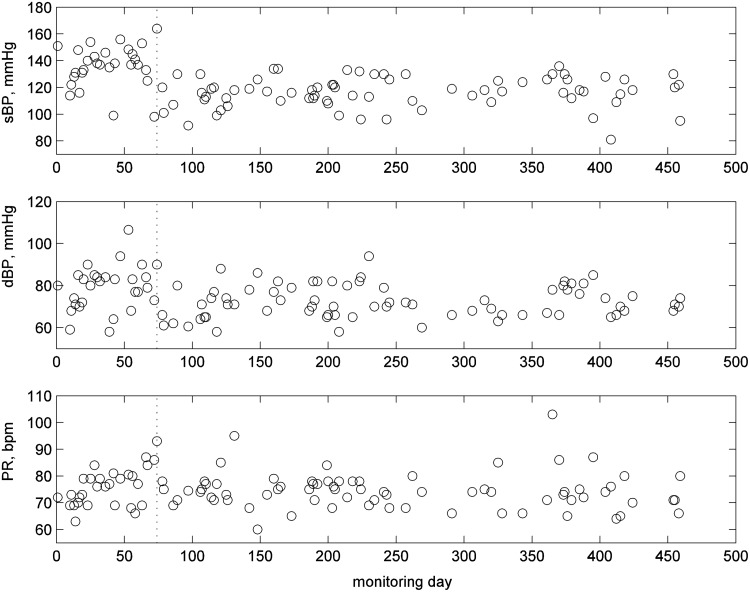
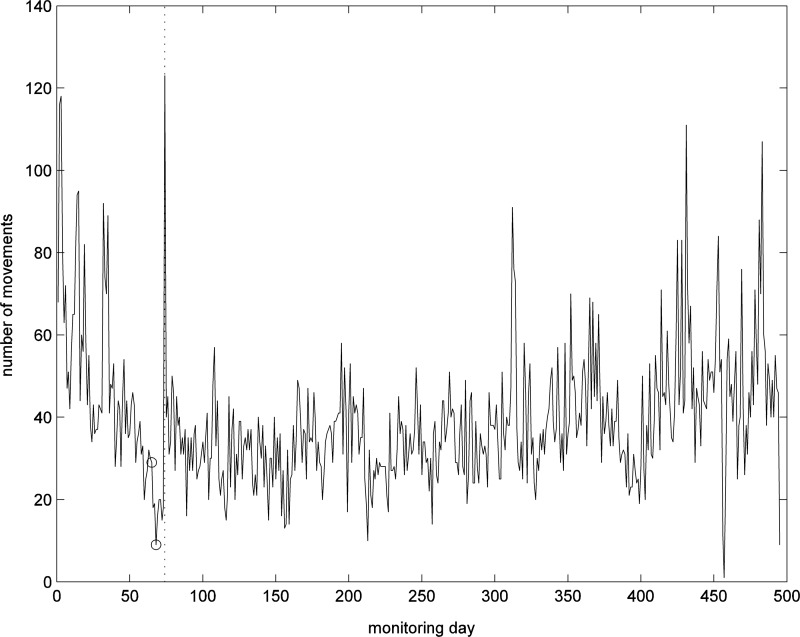
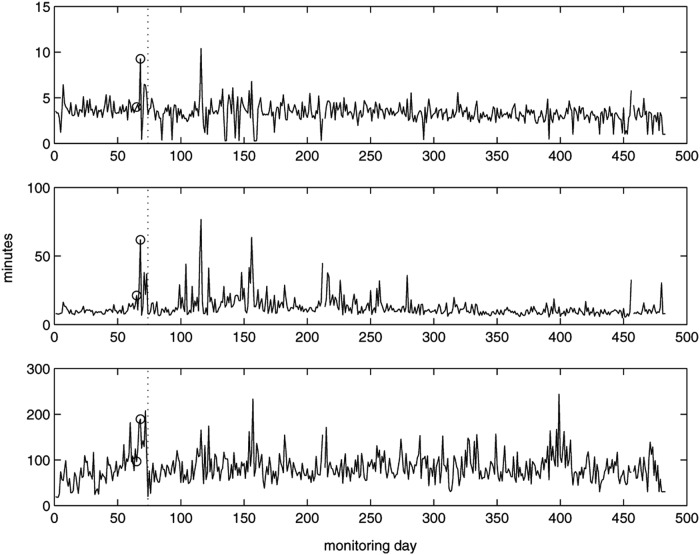
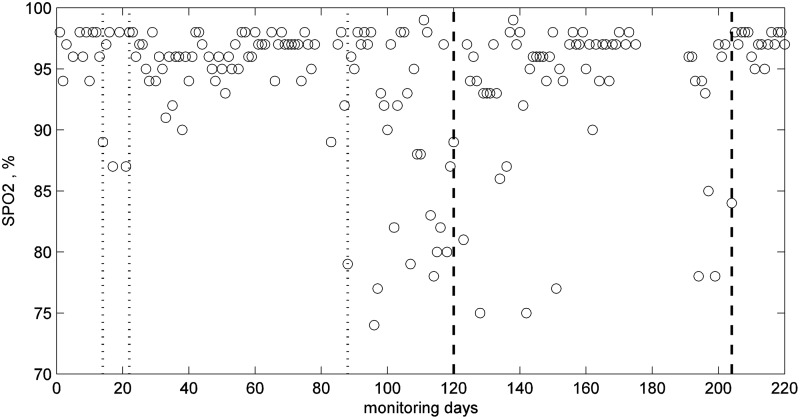
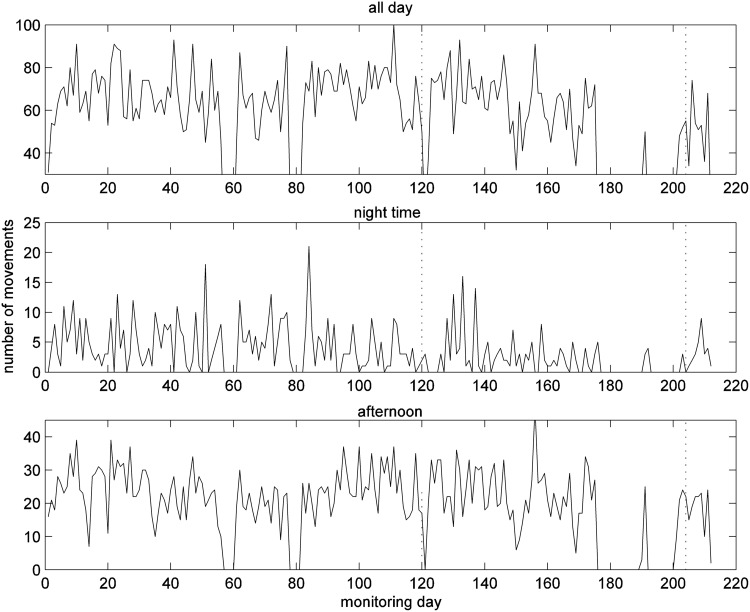
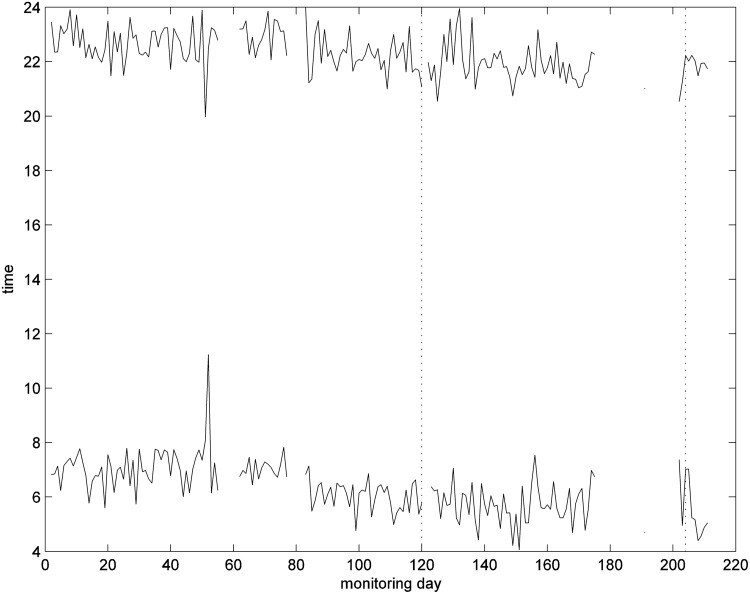
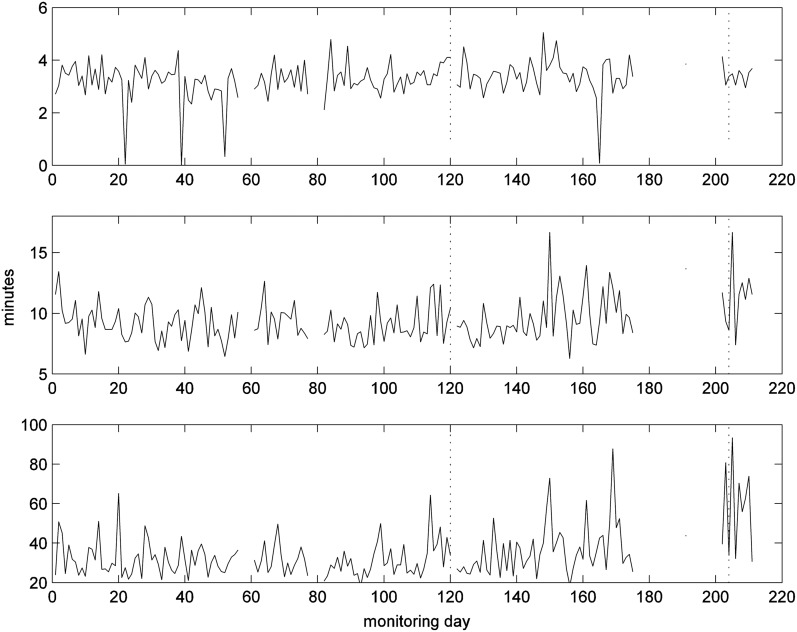
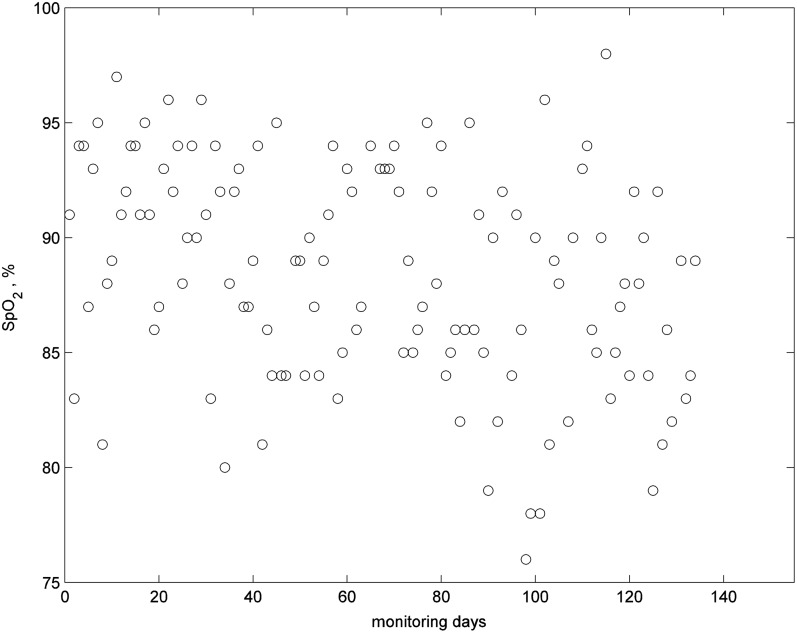
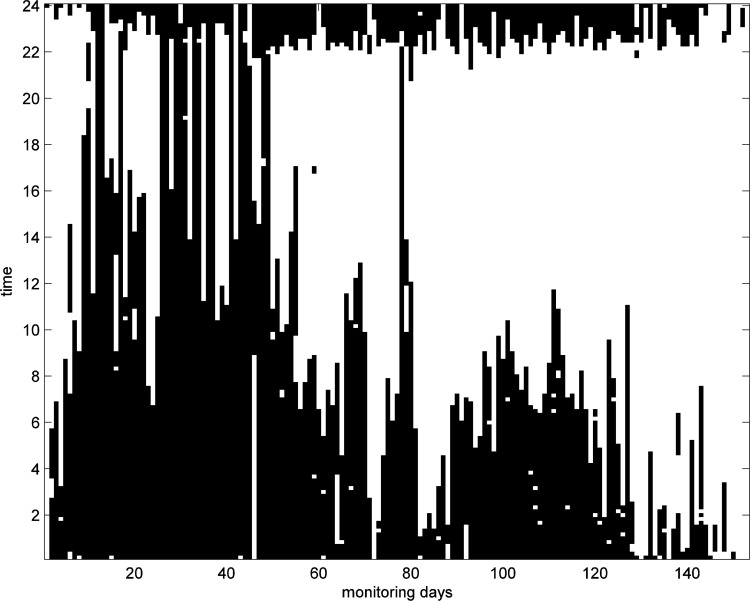
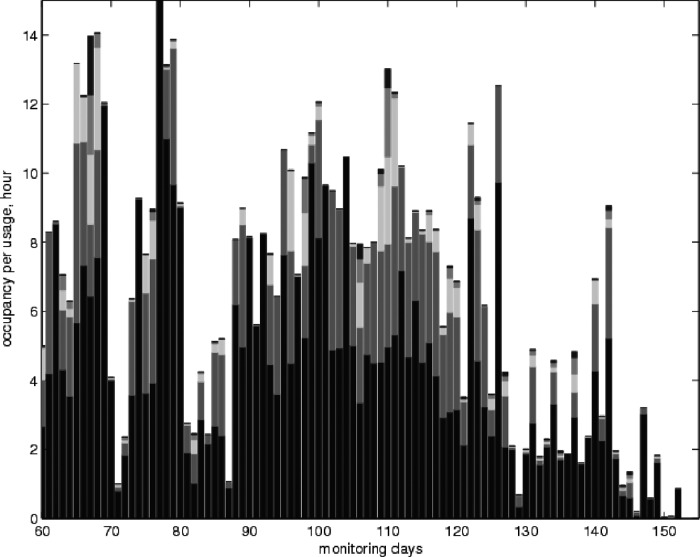
Objective:To investigate the potential of an integrated care system that acquires vital clinical signs and habits data to support independent living for elderly people with chronic disease.Materials and Methods:We developed an IEEE 11073 standards-based telemonitoring platform for monitoring vital signs and activity data of elderly living alone in their home. The platform has important features for monitoring the elderly: unobtrusive, simple, elderly-friendly, plug and play interoperable, and self-integration of sensors. Thirty-six (36) patients in a primary care practice in the United Kingdom (mean [standard deviation] age, 82 [10] years) with congestive heart failure (CHF) or chronic obstructive pulmonary disease (COPD) were provided with clinical sensors to measure the vital signs for their disease (blood pressure [BP] and weight for CHF, and oxygen saturation for COPD) and one passive infrared (PIR) motion sensor and/or a chair/bed sensor were installed in a patient's home to obtain their activity data. The patients were asked to take one measurement each day of their vital signs in the morning before breakfast. All data were automatically transmitted wirelessly to the remote server and displayed on a clinical portal for clinicians to monitor each patient. An alert algorithm detected outliers in the data and indicated alerts on the portal. Patient data have been analyzed retrospectively following hospital admission, emergency room visit or death, to determine whether the data could predict the event.Results:Data of patients who were monitored for a long period and had interventions were analyzed to identify useful parameters and develop algorithms to define alert rules. Twenty of the 36 participants had a clinical referral during the time of monitoring; 16 of them received some type of intervention. The most common reason for intervention was due to low oxygen levels for patients with COPD and high BP levels for CHF. Activity data were found to contain information on the well-being of patients, in particular for those with COPD. During exacerbation the activity level from PIR sensors increased slightly, and there was a decrease in bed occupancy. One subject with CHF who felt unwell spent most of the day in the bedroom.Conclusions:Our results suggest that integrated care monitoring technologies have a potential for providing improved care and can have positive impact on well-being of the elderly by enabling timely intervention. Long-term BP and pulse oximetry data could indicate exacerbation and lead to effective intervention; physical activity data provided important information on the well-being of patients. However, there remains a need for better understanding of long-term variations in vital signs and activity data to establish intervention protocols for improved disease management.
Keywords: activities of daily living; ageing; assistive technology; chronic disease; decision making; e-health; elderly care; habits; integrated care; pervasive care; telecare; telehealth; telemedicine; telemetry; well-being.
Conflict of interest statement
No competing financial interests exist.
Figures
Similar articles
-
The EU project "United4Health": Results and experiences from automatic health status assessment in a Norwegian telemedicine trial system.J Telemed Telecare. 2019 Jan;25(1):46-53. doi: 10.1177/1357633X17735558. Epub 2017 Oct 10. J Telemed Telecare. 2019. PMID: 28994634
-
Exacerbations in Chronic Obstructive Pulmonary Disease: Identification and Prediction Using a Digital Health System.J Med Internet Res. 2017 Mar 7;19(3):e69. doi: 10.2196/jmir.7207. J Med Internet Res. 2017. PMID: 28270380 Free PMC article. Clinical Trial.
-
[Home-based telemonitoring of simple vital signs to reduce hospitalization in heart failure patients: real-world data from a community-based hospital].G Ital Cardiol (Rome). 2011 Dec;12(12):829-36. doi: 10.1714/996.10828. G Ital Cardiol (Rome). 2011. PMID: 22158454 Italian.
-
Use of predictive algorithms in-home monitoring of chronic obstructive pulmonary disease and asthma: A systematic review.Chron Respir Dis. 2016 Aug;13(3):264-83. doi: 10.1177/1479972316642365. Epub 2016 Apr 20. Chron Respir Dis. 2016. PMID: 27097638 Free PMC article.
-
Coexistent chronic obstructive pulmonary disease and heart failure in the elderly.Int J Cardiol. 2008 Apr 10;125(2):209-15. doi: 10.1016/j.ijcard.2007.12.001. Epub 2008 Jan 24. Int J Cardiol. 2008. PMID: 18221802 Review.
Cited by
-
Evaluation of a Digital Self-management Platform for Patients With Chronic Illness in Primary Care: Qualitative Study of Stakeholders' Perspectives.JMIR Form Res. 2022 Aug 3;6(8):e38424. doi: 10.2196/38424. JMIR Form Res. 2022. PMID: 35921145 Free PMC article.
-
Use of patient-generated health data for shared decision-making in the clinical environment: ready for prime time.Mhealth. 2021 Jul 20;7:39. doi: 10.21037/mhealth.2020.03.05. eCollection 2021. Mhealth. 2021. PMID: 34345616 Free PMC article. No abstract available.
-
Exploring Health Care Professionals' Perspectives on the Use of a Medication and Care Support System and Recommendations for Designing a Similar Tool for Family Caregivers: Interview Study Among Health Care Professionals.JMIR Med Inform. 2024 Oct 23;12:e63456. doi: 10.2196/63456. JMIR Med Inform. 2024. PMID: 39442168 Free PMC article.
-
Navigating Through Innovation in Elderly's Health: A Scoping Review of Digital Health Interventions.Public Health Rev. 2024 Dec 19;45:1607756. doi: 10.3389/phrs.2024.1607756. eCollection 2024. Public Health Rev. 2024. PMID: 39749218 Free PMC article.
-
Bridging healthcare gaps through specialized mobile healthcare services to improve healthcare access and outcomes in rural Hungary.Sci Rep. 2025 Apr 12;15(1):12692. doi: 10.1038/s41598-025-97447-9. Sci Rep. 2025. PMID: 40221601 Free PMC article.
References
-
- Clarke M, Fursse J, Connelly N, Jones R. Evaluation of the National Health Services Direct Pilot Telehealth Program: Cost-Effectiveness Analysis. Telemed J E Health 2018;24:66–76 - PubMed
-
- Meyer M, Kobb R, Ryan P. Virtually healthy: Chronic disease management in the home. Dis Manag 2002;5:87–94
Publication types
MeSH terms
LinkOut - more resources
Full Text Sources
Other Literature Sources
Medical