. 2019 May 28;59(5):2264-2273.
doi: 10.1021/acs.jcim.8b00427. Epub 2018 Sep 10.

Determinants of Oligonucleotide Selectivity of APOBEC3B

Affiliations

Determinants of Oligonucleotide Selectivity of APOBEC3B

Jeffrey R Wagner et al. J Chem Inf Model. .

Abstract

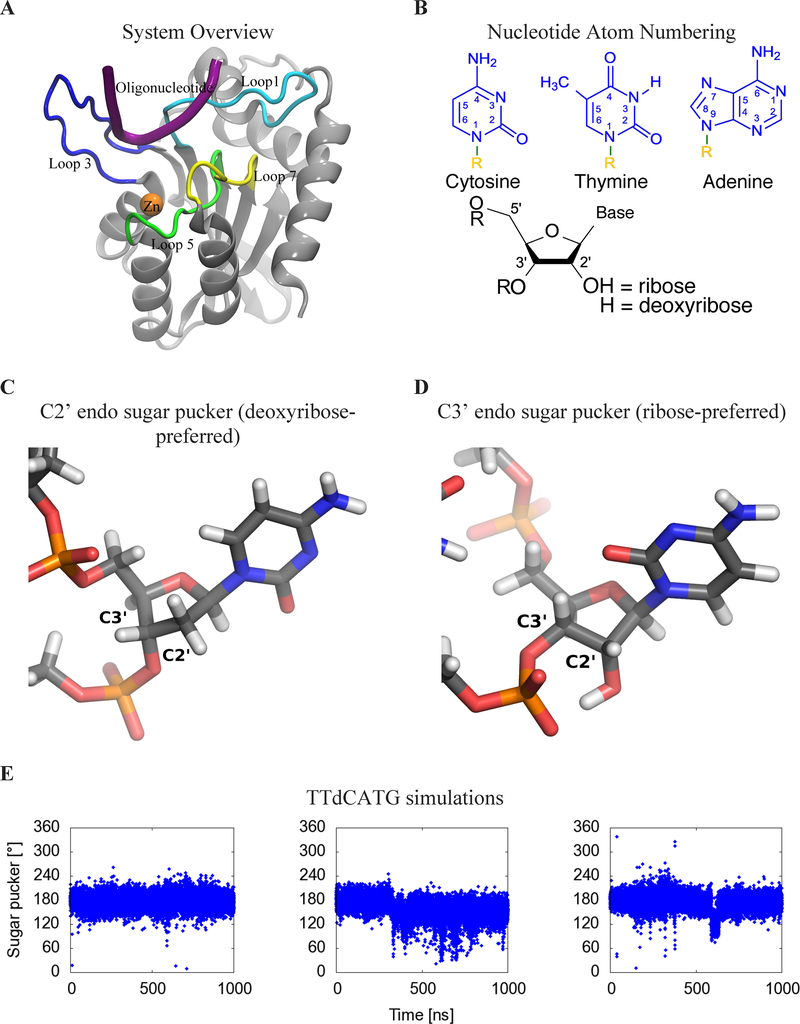
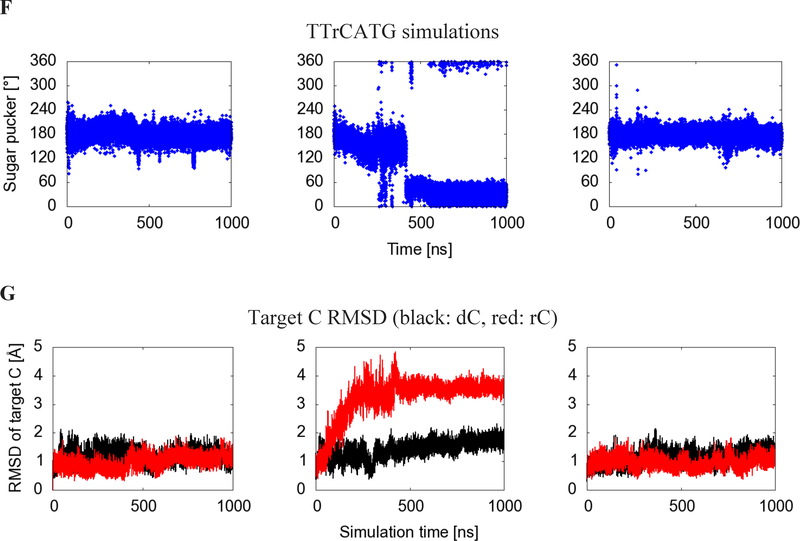
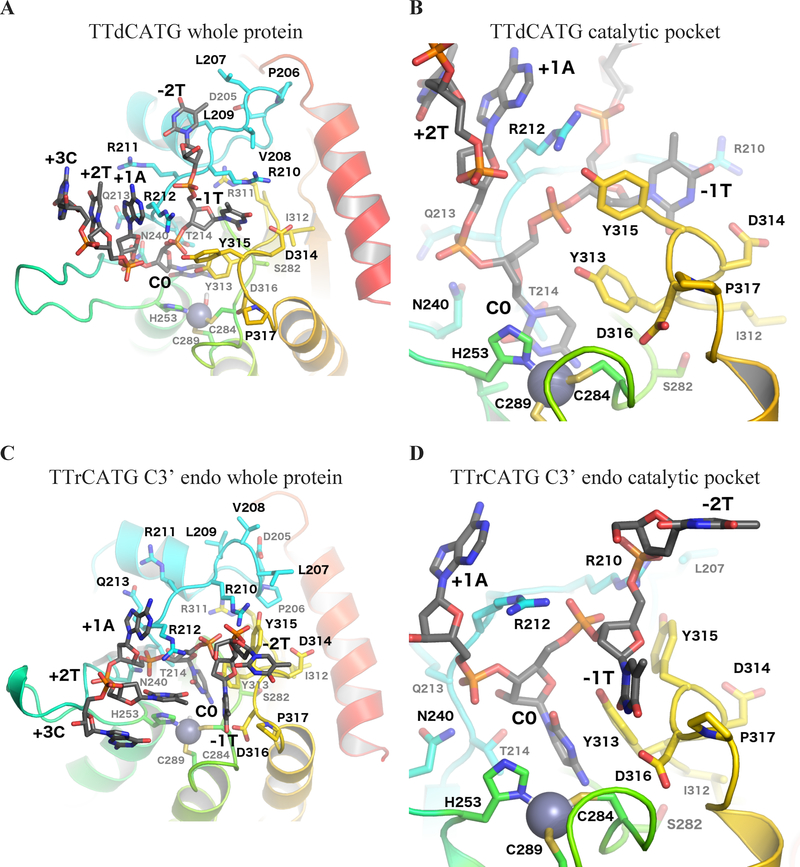
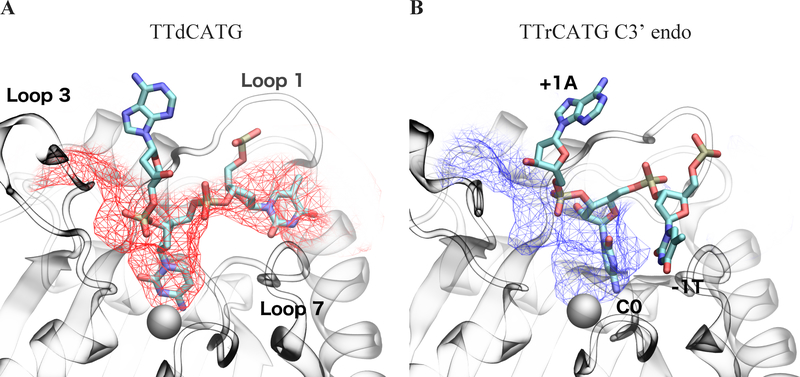
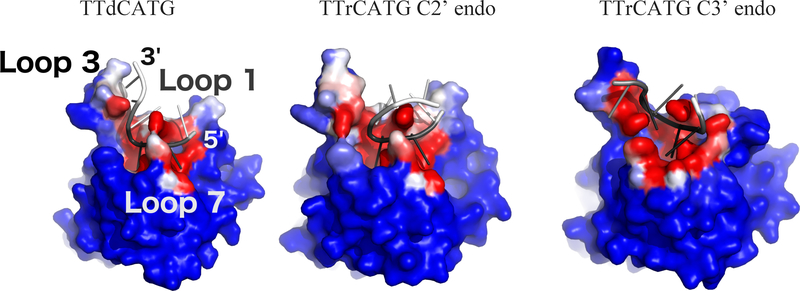
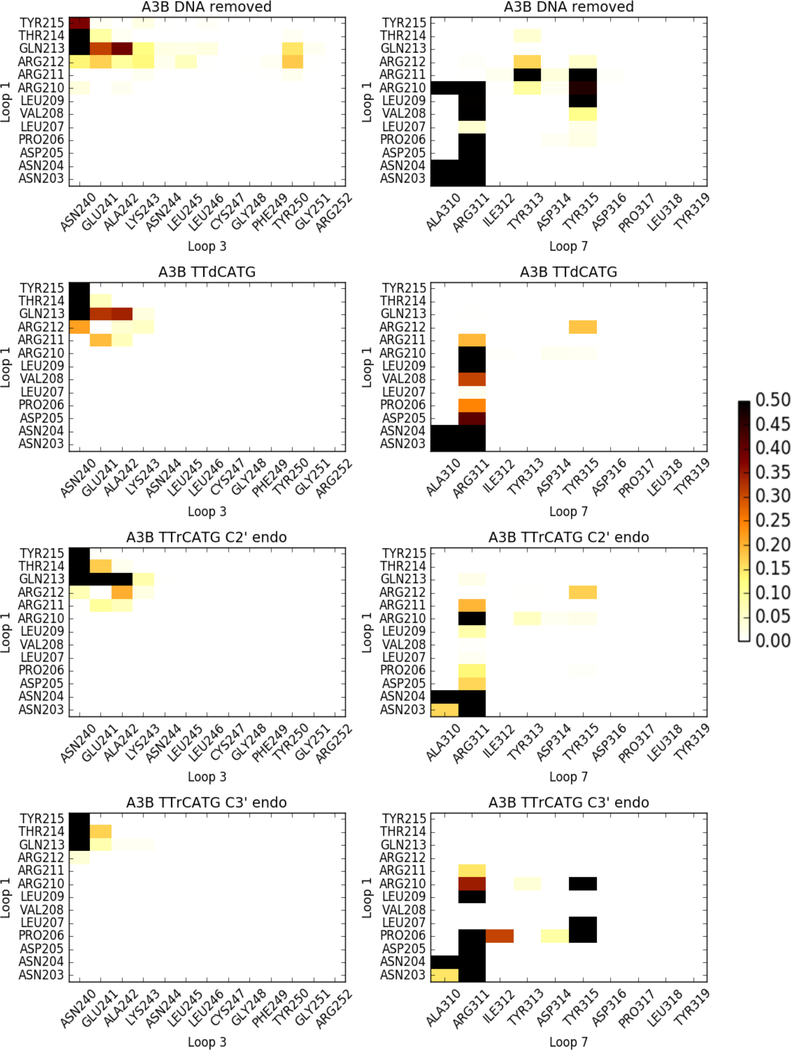
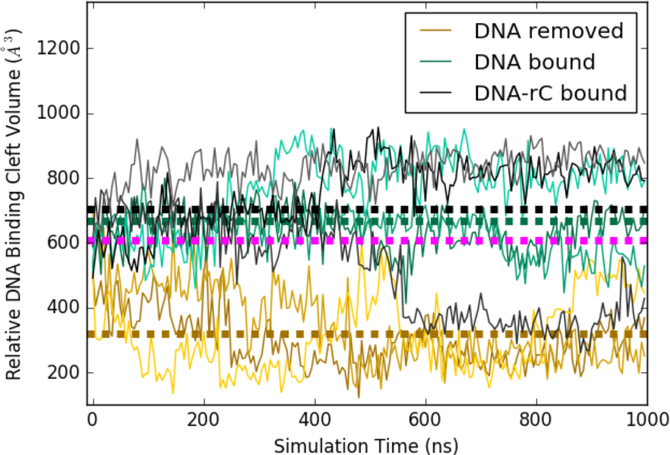
APOBEC3B (A3B) is a prominent source of mutation in many cancers. To date, it has been difficult to capture the native protein-DNA interactions that confer A3B's substrate specificity by crystallography due to the highly dynamic nature of wild-type A3B active site. We use computational tools to restore a recent crystal structure of a DNA-bound A3B C-terminal domain mutant construct to its wild type sequence, and run molecular dynamics simulations to study its substrate recognition mechanisms. Analysis of these simulations reveal dynamics of the native A3Bctd-oligonucleotide interactions, including the experimentally inaccessible loop 1-oligonucleotide interactions. A second series of simulations in which the target cytosine nucleotide was computationally mutated from a deoxyribose to a ribose show a change in sugar ring pucker, leading to a rearrangement of the binding site and revealing a potential intermediate in the binding pathway. Finally, apo simulations of A3B, starting from the DNA-bound open state, experience a rapid and consistent closure of the binding site, reaching conformations incompatible with substrate binding. This study reveals a more realistic and dynamic view of the wild type A3B binding site and provides novel insights for structure-guided design efforts for A3B.


Conflict of interest statement

Conflict of Interest Statement:

DAH & RSH are co-founders, consultants, and shareholders of ApoGen Biotechnologies, Inc. REA & HA are consultants of ApoGen Biotechnologies, Inc.

REA is a cofounder of, has equity interest in, and is on the scientific advisory board of Actavalon, Inc.

Figures

Figure 1:
Figure 1:
(A) Cartoon view of the protein, labeling features of interest including loops 1 (light blue), 3 (blue), 5 (green), and 7 (yellow), the substrate oligonucleotide (purple), and the catalytic zinc (orange). (B) Numbering system used to identify atoms in nucleotides. R=DNA (C) Geometry of C2’ endo sugar pucker taken from the starting configuration of the dC simulation, and (D) C3’ endo sugar pucker taken from the second rC simulation. (E) Sugar pucker of the target C, measured in both A3B-dC and (F) A3B-rC simulations. In rC simulation replicate 2, the RNA transitions from a C2’ endo (DNA-preferred) to a C3’ endo (RNA-preferred) sugar pucker. (G) RMSD of target C compared to its initial pose in A3Bctd-DNA (black) and A3Bctd- DNA-rC (red) simulations.
Figure 1:
Figure 1:
(A) Cartoon view of the protein, labeling features of interest including loops 1 (light blue), 3 (blue), 5 (green), and 7 (yellow), the substrate oligonucleotide (purple), and the catalytic zinc (orange). (B) Numbering system used to identify atoms in nucleotides. R=DNA (C) Geometry of C2’ endo sugar pucker taken from the starting configuration of the dC simulation, and (D) C3’ endo sugar pucker taken from the second rC simulation. (E) Sugar pucker of the target C, measured in both A3B-dC and (F) A3B-rC simulations. In rC simulation replicate 2, the RNA transitions from a C2’ endo (DNA-preferred) to a C3’ endo (RNA-preferred) sugar pucker. (G) RMSD of target C compared to its initial pose in A3Bctd-DNA (black) and A3Bctd- DNA-rC (red) simulations.
Figure 2:
Figure 2:
Binding site-adjacent residues. (A) Whole protein view and (B) catalytic pocket focused view of the simulation with target dC, showing the starting (crystal structure-based) conformation of the substrate oligonucleotide after minimization. (C) Whole protein view and (D) catalytic pocket focused view of the average structure of the C3’ endo portion of the rC simulation, as determined by POVMEpocket shape analysis. Loop 1 is shown in light blue, loop 3 in dark green, loop 5 in light green, and loop 7 in yellow.
Figure 3:
Figure 3:
Average binding cleft shapes differ between (A) dC simulations (C2’ endo/deoxyribose, red) and (B) the portion of the rC simulation after the sugar pucker change (C3’ endo/ribose, blue). Mesh shows average pocket shape along the DNA binding cleft observed in crystal structures. The atoms in the dC figure structure are the initial coordinates of the simulation, while C3’ endo atomic coordinates are taken from the POVME cluster centroid snapshot. The −1 T in the TTrCATG C3’ endo snapshots leaves the original substrate binding cleft and is no longer in the pocket defined in the 5TD5 crystal. Images are taken from the same angle and structures are RMSD-aligned. Catalytic zinc is shown as a gray sphere.
Figure 4:
Figure 4:
Oligonucleotide interaction surface differences between DNA (left) and DNA-rC (center and right) simulations. Structures from the end of each simulation are shown. Each protein atom is colored by its frequency of contact (<5 Angstrom distance) with the oligonucleotide, on a color scale from blue (no contact) to white (50% contact) to red (100% contact). The oligonucleotides are colored by RMSF, with black corresponding to 0 angstroms and white to 5 Angstroms. The C3’ endo portion of the DNA-rC simulation shows a shift in position of the 0 and −1 nucleotides of the substrate, but low RMSD after the shift. Structures are RMSD-aligned.
Figure 5:
Figure 5:
Frequency of loop-loop contacts in A3Bctd simulations. White indicates infrequent contacts, and black indicates contacts 50% of the time or more. Contacts are defined as a closest heavy atom distance of < 4 angstroms.
Figure 6:
Figure 6:
Relative pocket volumes of A3Bctd substrate binding cleft duringMD simulations. Each simulation was run in triplicate, with replicates shown as lighter and darker shades of the same color. Average pocket volumes are shown as thick dotted lines. Average volume from the same analysis performed on A3A apo simulations used in prior work shown in magenta.

References

    1. Siriwardena SU; Chen K; Bhagwat AS, Functions and Malfunctions of Mammalian DNA-Cytosine Deaminases. Chem. Rev 2016, 116, 12688–12710. - PMC - PubMed
    1. Venkatesan S; Rosenthal R; Kanu N; McGranahan N; Bartek J; Quezada SA; Hare J; Harris RS; Swanton C, Perspective: APOBEC Mutagenesis in Drug Resistance and Immune Escape in HIV and Cancer Evolution. Ann. Oncol 2018, 29, 563–572. - PMC - PubMed
    1. Helleday T; Eshtad S; Nik-Zainal S, Mechanisms Underlying Mutational Signatures in Human Cancers. Nat. Rev. Genet 2014, 15, 585–598. - PMC - PubMed
    1. Malim MH; Emerman M, HIV-1 Accessory Proteins--Ensuring Viral Survival in a Hostile Environment. Cell Host Microbe 2008, 3, 388–398. - PubMed
    1. Reuben S Harris JPD, APOBECs and Virus Restriction. Virology 2015, 0, 131. - PMC - PubMed

Publication types