. 2018 Nov 1;128(11):4884-4897.
doi: 10.1172/JCI120859. Epub 2018 Sep 24.

Kidney-infiltrating T cells in murine lupus nephritis are metabolically and functionally exhausted

Affiliations

Kidney-infiltrating T cells in murine lupus nephritis are metabolically and functionally exhausted

Jeremy S Tilstra et al. J Clin Invest. .

Abstract

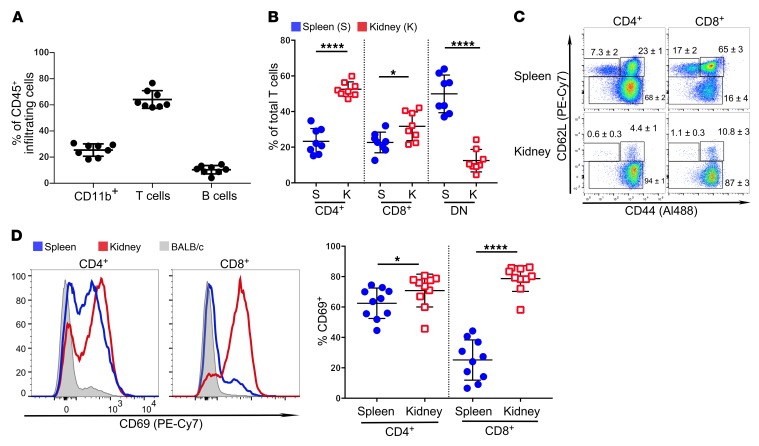
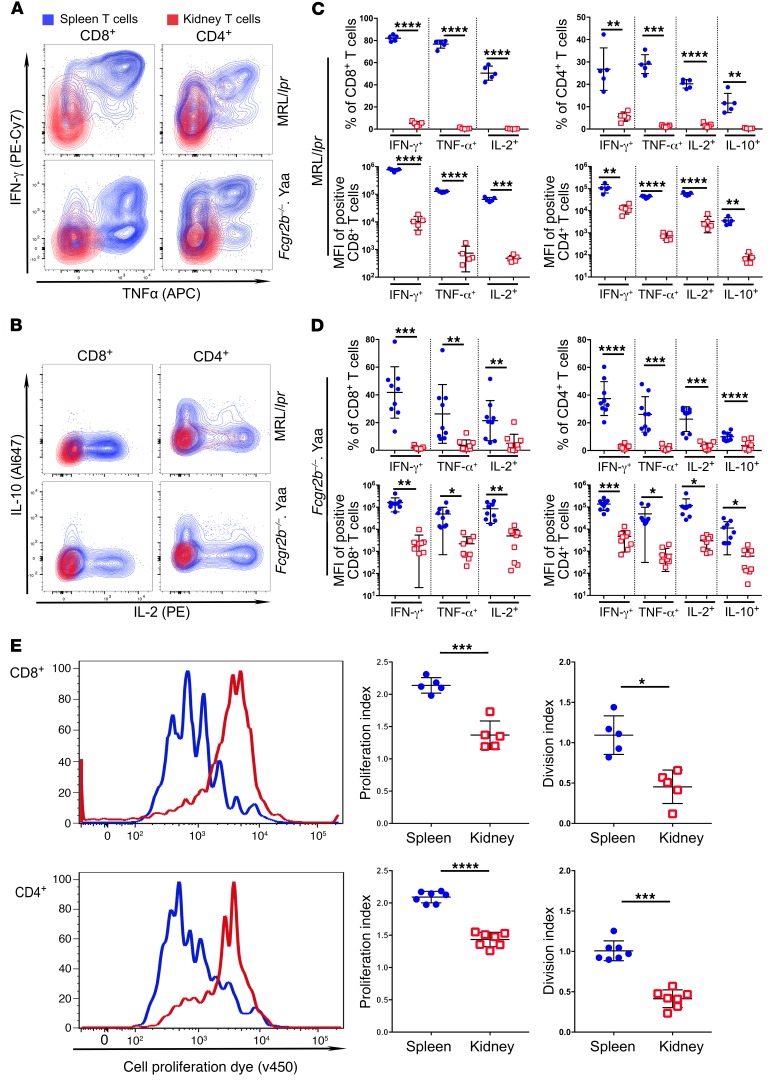
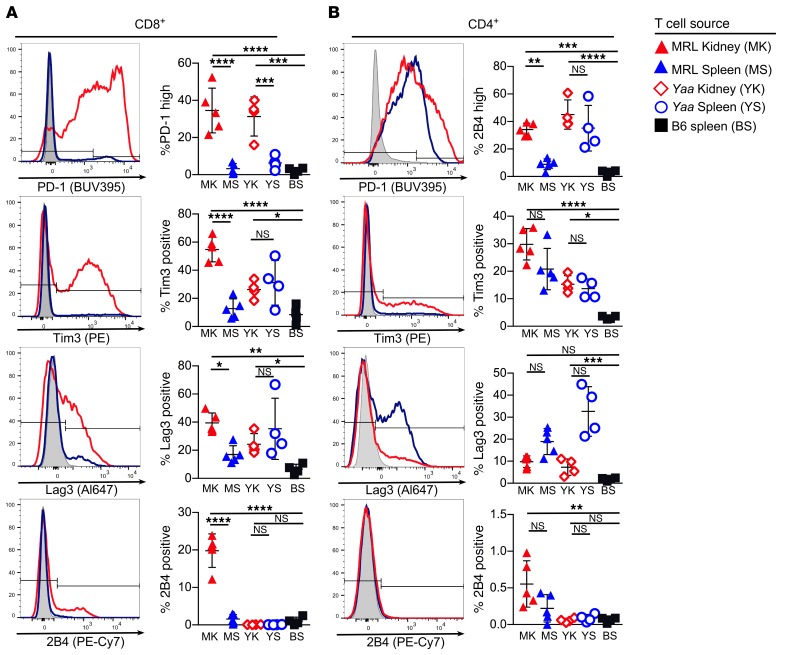
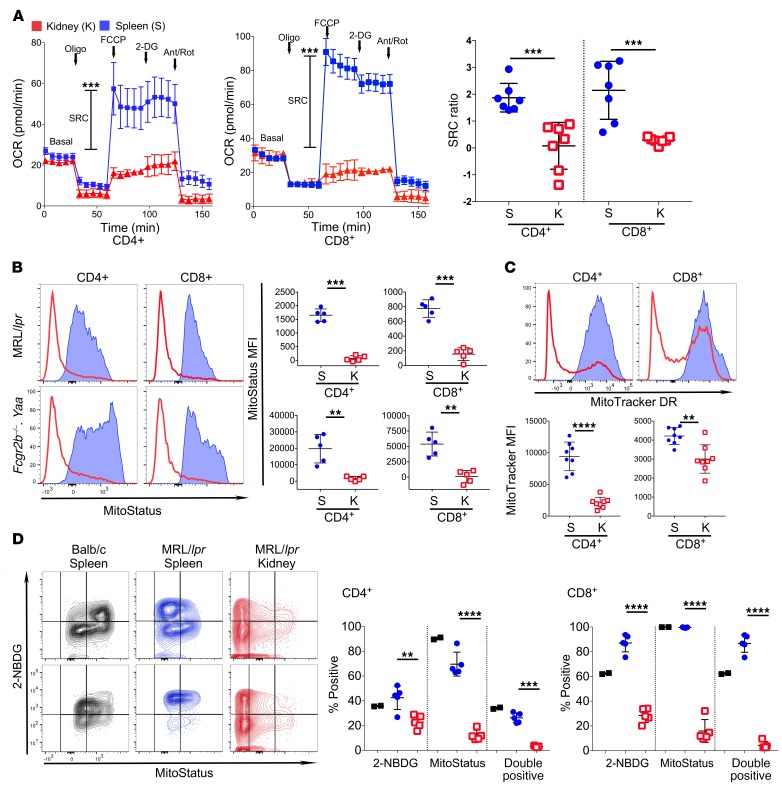
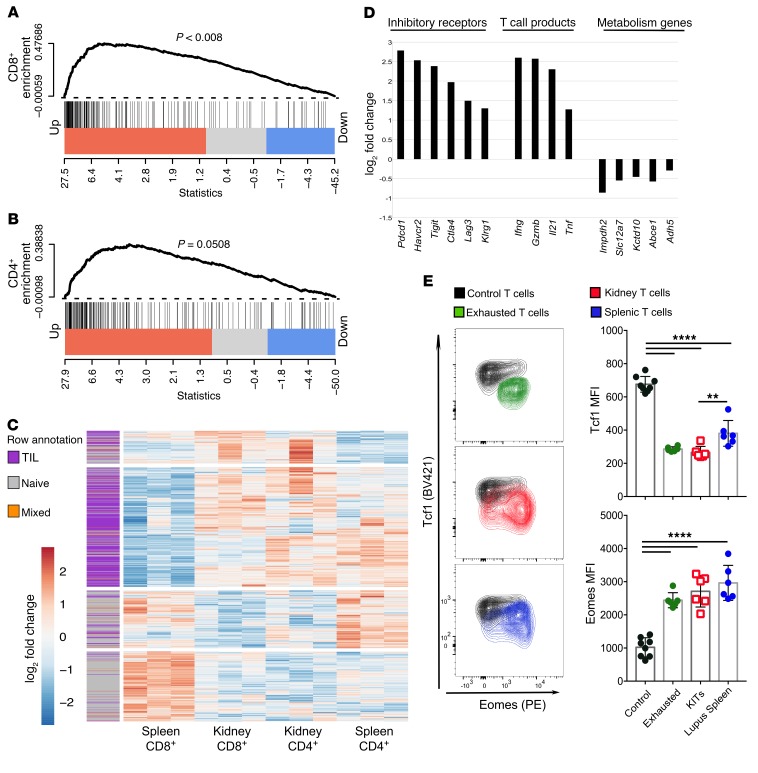
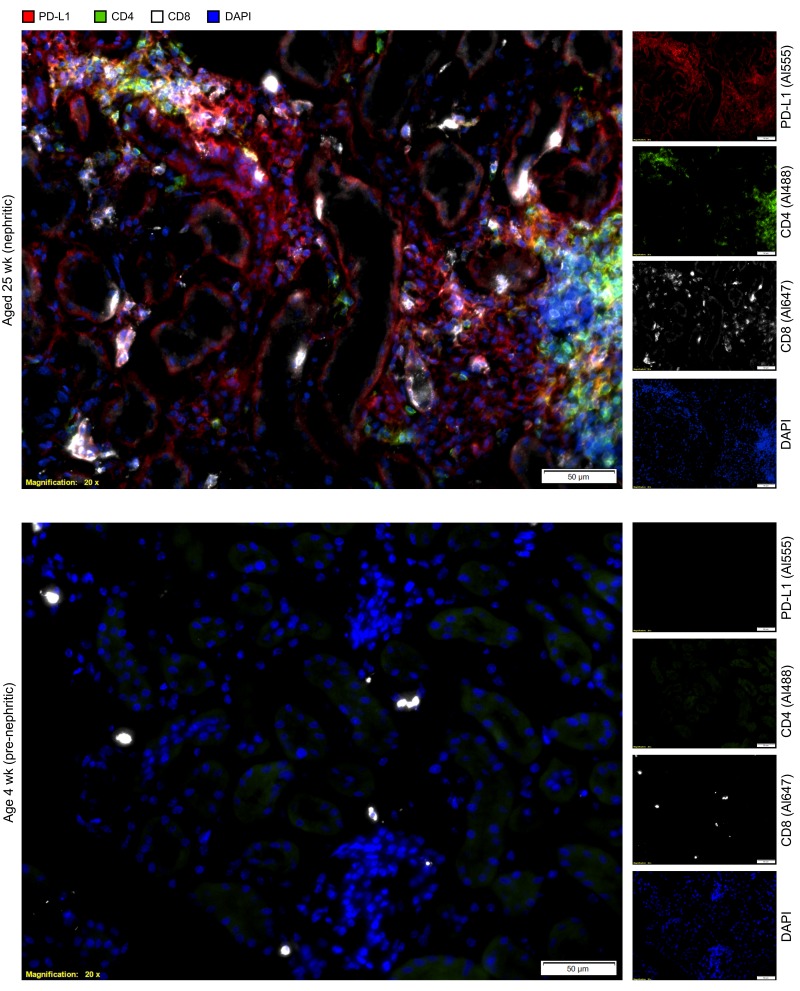
While T cells are important for the pathogenesis of systemic lupus erythematosus (SLE) and lupus nephritis, little is known about how T cells function after infiltrating the kidney. The current paradigm suggests that kidney-infiltrating T cells (KITs) are activated effector cells contributing to tissue damage and ultimately organ failure. Herein, we demonstrate that the majority of CD4+ and CD8+ KITs in 3 murine lupus models are not effector cells, as hypothesized, but rather express multiple inhibitory receptors and are highly dysfunctional, with reduced cytokine production and proliferative capacity. In other systems, this hypofunctional profile is linked directly to metabolic and specifically mitochondrial dysfunction, which we also observed in KITs. The T cell phenotype was driven by the expression of an "exhausted" transcriptional signature. Our data thus reveal that the tissue parenchyma has the capability of suppressing T cell responses and limiting damage to self. These findings suggest avenues for the treatment of autoimmunity based on selectively exploiting the exhausted phenotype of tissue-infiltrating T cells.

Keywords: Autoimmune diseases; Autoimmunity; Immunology; T cells.


Conflict of interest statement

Conflict of interest: The authors have declared that no conflict of interest exists.

Figures

Figure 1
Figure 1. Characterization of T cell populations infiltrating the kidneys of nephritic MRL/lpr mice.
(A) The frequency of CD45+CD11b+ cells, T cells (CD45+TCR+), and B cells (intracellular Igκ+) in kidney infiltrates was determined using flow cytometry (n = 8 per group). (B) The frequency of different T cell subsets was determined in the kidneys and spleens of matched MRL/lpr mice with nephritis (n = 8 per group). DN, double negative. (C) Representative flow plots of CD44 and CD62L expression on CD4+ and CD8+ T cells from indicated organs are shown with percentages ± SD of each gated subpopulation, CD62L+CD44, CD62L+CD44+, and CD62LCD44+ (n = 4 per group). (D) Left panel: representative histogram of CD69 expression on CD4+ and CD8+ T cells from indicated organs (blue, spleen; red, kidney; gray, BALB/c). Right panel: summary data from spleens and kidneys of lupus-prone mice (n = 10 mice per group). For tabulated data, each dot denotes an individual mouse, horizontal lines represent the mean, and error bars show ± 1 SD. Paired Student’s t test was used to determine statistical significance between spleen and kidney samples. *P < 0.05; ****P < 0.0001.
Figure 2
Figure 2. KITs have suppressed functional capacity.
T cells were isolated from the kidney (red) and spleen (blue) of nephritic MRL/lpr and Fcgr2b–/–.Yaa mice. (AD) Cells were stimulated in bulk culture with PMA and ionomycin in the presence of brefeldin A for 4 hours, and cytokine expression was assessed by flow cytometry. (A and B) Representative contour plots showing cytokine production by CD4+ and CD8+ T cells from MRL/lpr (upper panels) and Fcgr2b–/–.Yaa (lower panels) mice. (C and D) Cytokine production by T cells of MRL/lpr (C) and Fcgr2b–/–.Yaa mice (D) represented as the percentage of positive cells (upper panels) and MFI of producers (lower panels). (E) Proliferation of CD8+ T cells in bulk culture after 3 days of anti-CD3/anti-CD28 stimulation (upper left panel) and 5 days for CD4+ T cells (lower left panel) from indicated organs. Cells were labeled with Cell Proliferation Dye prior to culture, and its staining is shown on the x axis. Proliferation index and division index were calculated for CD8+ (n = 5) and CD4+ (n = 7) T cells. For tabulated data (CE), each dot denotes an individual mouse and horizontal lines represent the mean, with error bars representing 1 SD. Paired Student’s t test was used to determine statistical significance between spleen and kidney samples. *P < 0.05; **P < 0.01; ***P < 0.001;****P < 0.0001.
Figure 3
Figure 3. KITs increase expression of IRs.
Representative histograms of IR expression on CD8+ (A) and CD4+ (B) T cells from kidney (red) and spleen (blue) of MRL/lpr and B6 (gray) mice, with gating parameters (left column). Right columns show summary data from MRL/lpr (solid symbols, n = 5/group), Fcgr2b–/–.Yaa (open symbols, n = 4/group), and B6, nonlupus controls (black, n = 4/group). For tabulated data, each dot denotes an individual mouse, and horizontal lines represent the mean, with error bars representing 1 SD. One-way ANOVA with Tukey’s multiple comparison was performed. *P < 0.05; **P < 0.01; ***P < 0.001; ****P < 0.0001. These findings are representative of 3 replicates of MRL/lpr mice and 2 replicates of Fcgr2b–/–.Yaa mice.
Figure 4
Figure 4. KITs are metabolically suppressed.
(A) Representative oxygen consumption rate (OCR) trace (left) from sorted CD4+ and CD8+ T cells isolated from kidney (red) and spleen (blue) of MRL/lpr mice. A metabolic stress test was performed by injection of oligomycin (Oligo), mitochondrial decoupler (FCCP), glucose uptake inhibitor (2-DG), and antimycin A/rotenone (Ant/Rot). SRC was calculated as the difference between basal OCR values and maximal OCR values achieved after FCCP uncoupling. Summary data of SRC ratio, defined as SRC divided by basal OCR, is shown on the right (n = 7 per group). Error bars at each time point in the trace represent mean ± SEM of triplicate wells, with tabulated data in dot plots (right panels). (B) The Δψm was assessed by flow cytometry using MitoStatus dye. Representative histograms (red, kidney; blue, spleen) of MitoStatus from T cell lineages as indicated from both MRL/lpr (upper left panel) and Fcgr2b–/–.Yaa mice (lower left panel), with tabulated data in dot plots (right panels) (n = 5 per group), are shown (C) Mitochondrial mass was assessed by flow cytometry using MitoTracker DR. Representative histograms (red, kidney; blue, spleen) of MitoTracker DR from T cell lineages as indicated from MRL/lpr mice with summary data in dot plots (lower panels) (n = 5 per group). (D) Representative contour plots of BALB/c splenic or MRL/lpr splenic- or kidney-derived CD4+ (top) and CD8+ (bottom) T cells showing 2NBDG (glucose uptake) and MitoStatus staining, with summary data in dot plots (BALB/c, n = 2; MRL/lpr n = 5 mice). For tabulated data (BD), each dot denotes an individual mouse, and horizontal lines represent the mean, with error bars representing 1 SD. Paired Student’s t test was used to determine statistical significance between spleen and kidney samples. **P < 0.01; ***P < 0.001; ****P < 0.0001.
Figure 5
Figure 5. The transcriptional profile of KITs is consistent with T cell exhaustion.
(A and B) RNA-seq data were used to construct gene set enrichment plots illustrating genes differentially regulated in kidney- compared with splenic-derived T cells (n = 3 per group) with respect to a known set of 194 CD4+ expressed and 200 CD8+ expressed genes specific for LCMV-induced T cell exhaustion (44) in both the CD8+ (A) and CD4+ (B) compartments. MitoStatus values calculated using the conservative rankSumTestWithCorrelation function in the limma package. (C) Unbiased hierarchical clustering was performed using 1,426 genes previously identified from 10 clusters comparing TILs to activated and naive T cell populations (36) and represented as a heatmap. Row annotation on the heatmap shows association of clustered genes with PD-1+Tim3+ TILs (purple), naive, effector, and PD-1 Tim3 TILs (gray) or those with enhanced gene expression in both subgroups (orange) (36). GSEA was also performed on individual clusters (Supplemental Figure 6). (D) Differential expression between kidney and splenic CD8+ T cells for selected IRs, T cell products, and metabolic genes as determined by RNA-seq. (E) Representative contour plots for Tcf1 and Eomes expression in nonexhausted (black), exhausted (PD-1+ Tim3+ T cells from LCMV-infected mice) (green), or MRL/lpr kidney- (red) or splenic-derived (blue) CD8+ T cells. For tabulated data, each dot denotes an individual mouse, and bars represent the mean, with error bars indicating SD. One-way ANOVA was used to determine statistical significance using Tukey’s test for multiple comparisons. **P < 0.01; ****P < 0.0001.
Figure 6
Figure 6. Nephritic kidneys from MRL/lpr mice locally express PD-L1 near sites of T cell infiltration.
PD-L1 expression on kidneys of nephritic (>20 weeks) and prenephritic (4 weeks) MRL/lpr mice was assessed by immunofluorescence microscopy: CD4+ (green), CD8+ (white), and PD-L1 (red) expression. Merged and single-color images are shown for each stain. Scale bars: 50 μm (insets).

References

    1. Davidson A. What is damaging the kidney in lupus nephritis? Nat Rev Rheumatol. 2016;12(3):143–153. doi: 10.1038/nrrheum.2015.159. - DOI - PMC - PubMed
    1. Hahn BH, et al. American College of Rheumatology guidelines for screening, treatment, and management of lupus nephritis. Arthritis Care Res (Hoboken) 2012;64(6):797–808. doi: 10.1002/acr.21664. - DOI - PMC - PubMed
    1. Ioannidis JP, et al. Remission, relapse, and re-remission of proliferative lupus nephritis treated with cyclophosphamide. Kidney Int. 2000;57(1):258–264. doi: 10.1046/j.1523-1755.2000.00832.x. - DOI - PubMed
    1. Jevnikar AM, Grusby MJ, Glimcher LH. Prevention of nephritis in major histocompatibility complex class II-deficient MRL-lpr mice. J Exp Med. 1994;179(4):1137–1143. doi: 10.1084/jem.179.4.1137. - DOI - PMC - PubMed
    1. Koh DR, Ho A, Rahemtulla A, Fung-Leung WP, Griesser H, Mak TW. Murine lupus in MRL/lpr mice lacking CD4 or CD8 T cells. Eur J Immunol. 1995;25(9):2558–2562. doi: 10.1002/eji.1830250923. - DOI - PubMed

Publication types