. 2018 Nov 1;128(11):4912-4923.
doi: 10.1172/JCI120612. Epub 2018 Sep 24.

Self-associated molecular patterns mediate cancer immune evasion by engaging Siglecs on T cells

Affiliations

Self-associated molecular patterns mediate cancer immune evasion by engaging Siglecs on T cells

Michal A Stanczak et al. J Clin Invest. .

Abstract

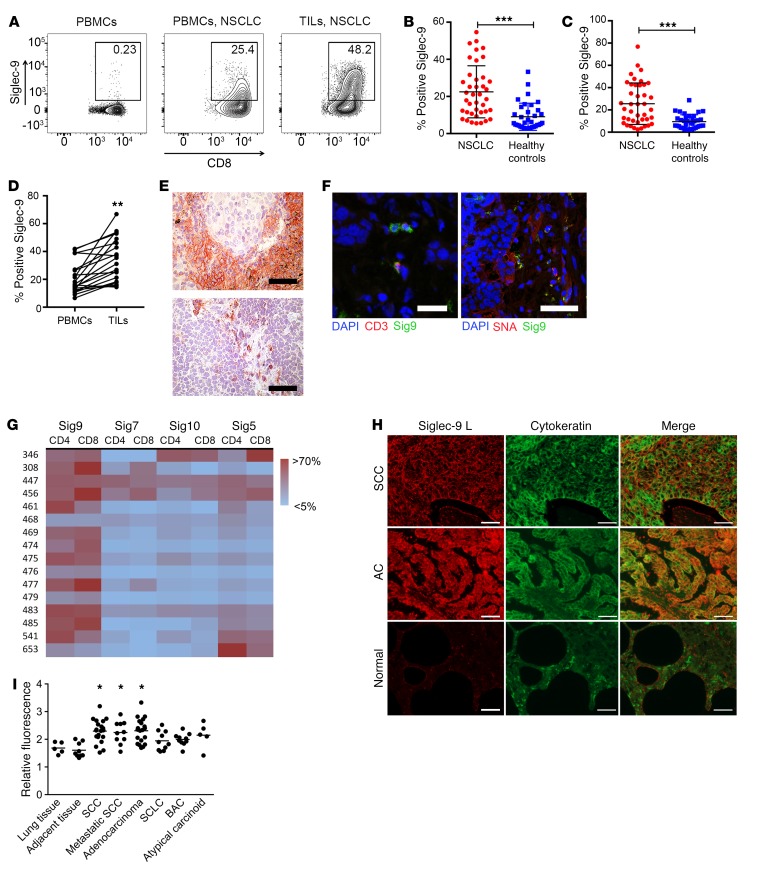
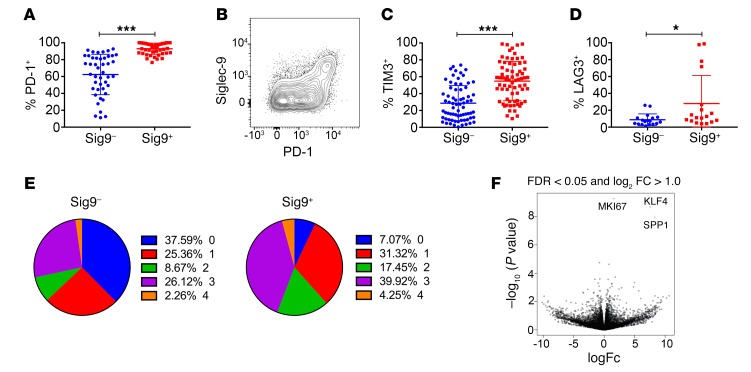
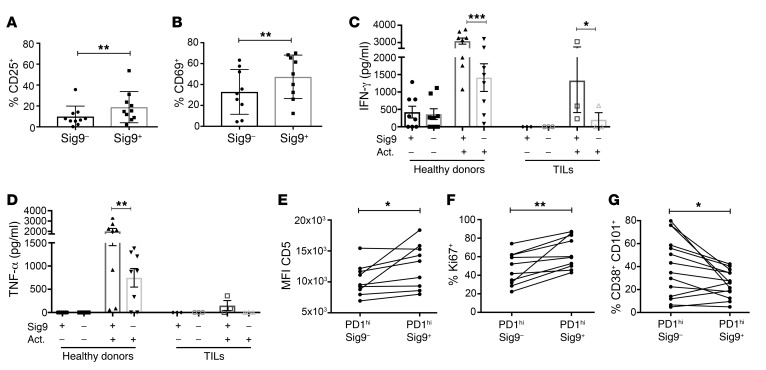
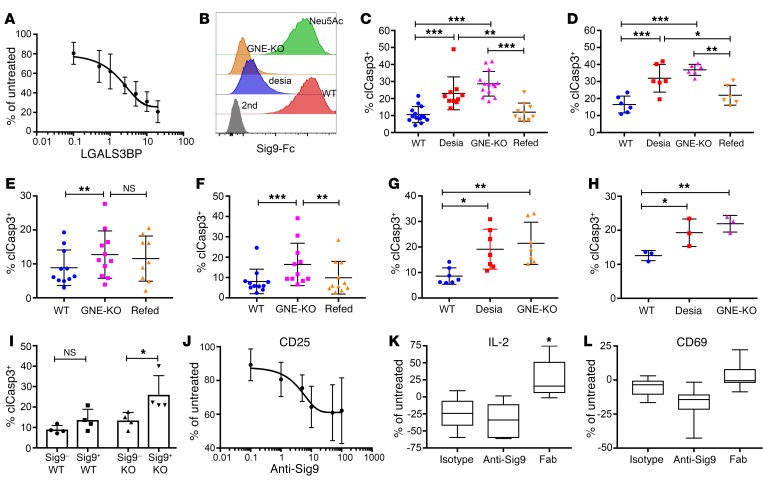
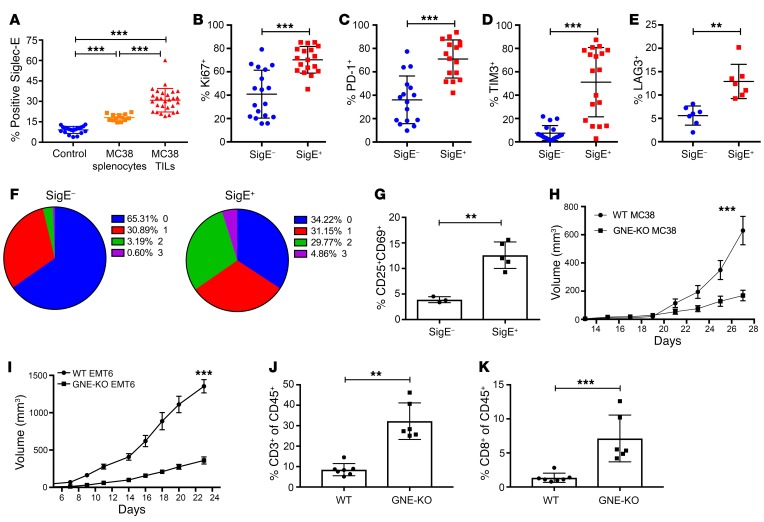
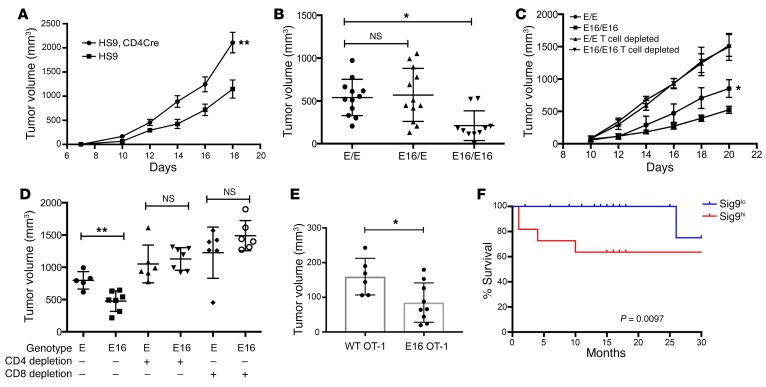
First-generation immune checkpoint inhibitors, including anti-CTLA-4 and anti-programmed death 1 (anti-PD-1) antibodies, have led to major clinical progress, yet resistance frequently leads to treatment failure. Thus, new targets acting on T cells are needed. CD33-related sialic acid-binding immunoglobulin-like lectins (Siglecs) are pattern-recognition immune receptors binding to a range of sialoglycan ligands, which appear to function as self-associated molecular patterns (SAMPs) that suppress autoimmune responses. Siglecs are expressed at very low levels on normal T cells, and these receptors were not until recently considered as interesting targets on T cells for cancer immunotherapy. Here, we show an upregulation of Siglecs, including Siglec-9, on tumor-infiltrating T cells from non-small cell lung cancer (NSCLC), colorectal, and ovarian cancer patients. Siglec-9-expressing T cells coexpressed several inhibitory receptors, including PD-1. Targeting of the sialoglycan-SAMP/Siglec pathway in vitro and in vivo resulted in increased anticancer immunity. T cell expression of Siglec-9 in NSCLC patients correlated with reduced survival, and Siglec-9 polymorphisms showed association with the risk of developing lung and colorectal cancer. Our data identify the sialoglycan-SAMP/Siglec pathway as a potential target for improving T cell activation for immunotherapy.

Keywords: Cancer immunotherapy; Immunology; Oncology; T cells.


Conflict of interest statement

Conflict of interest: The authors have declared that no conflict of interest exists.

Figures

Figure 1
Figure 1. Siglec-9 is upregulated on CD8+ TILs.
(A) Representative flow cytometry analysis of Siglec-9 expression on CD8+ T cells in PBMCs from healthy donors (left panel), PBMCs from NSCLC patients (middle panel), and TILs from a matched NSCLC patient (right panel). (B and C) Quantification of Siglec-9 expression on CD4+ (B) and CD8+ (C) TILs from NSCLC patients (PBMCs, n = 36; NSCLC, n = 41; mean ± SD). Statistical analysis by unpaired Student’s t test. (D) Paired analysis of CD8+ T cells from the peripheral blood and tumors of NSCLC patients (n = 20). Statistical analysis by paired Student’s t test. (E) Immunohistochemical staining of Siglec-9–positive cells in NSCLC sections. Scale bars: 50 μm. (F) Representative immunofluorescence analysis of CD3 and Siglec-9 double-positive cells and Siglec-9 staining or SNA staining and Siglec-9 staining (right panel). Scale bars: 30 μm (left panel); 50 μm (right panel).(G) Heatmap of expression analysis of different Siglecs in NSCLC samples on CD4+ and CD8+ TILs. (H and I) Immunofluorescence study in paraffin-embedded tissue microarrays using recombinant Siglec-9–Fc (human IgG1) fusion protein coupled to secondary PE-conjugated (Fab′)2 goat anti-human Fc antibody. Representative images (H) and Siglec ligands quantification summary (I) are shown. Original magnification, ×400. Scale bars: 50 μm. Fluorescence values were normalized against an IgG1 isotype control. Lung tissue, n = 5; adjacent lung tissue, n = 9; squamous cell carcinoma (SCC), n = 20; adenocarcinoma, n = 20; small cell lung cancer (SCLC), n = 10; broncho-alveolar carcinoma (BAC), n = 10; atypical carcinoid, n = 5. Data are shown as mean ± SEM. Statistical analysis performed by 1-way ANOVA. *P < 0.05; **P < 0.01; ***P < 0.001.
Figure 2
Figure 2. Sig9+CD8+ TILs coexpress inhibitory receptors.
(A and B) Expression of PD-1 in primary NSCLC samples on Sig9CD8+ (Sig9) or Sig9+CD8+ (Sig9+) TILs (A, n = 44) and representative FACS analysis (B). Statistical analysis by paired Student’s t test. (C and D) Expression of TIM-3 (C, n = 71) and LAG-3 (D, n = 18) on Sig9CD8+ or Sig9+CD8+ TILs from NSCLC samples. Statistical analysis by paired Student’s t test. (E) Analysis of the number of coexpressed inhibitory receptors on Sig9CD8+ or Sig9+CD8+ TILs. (F) Volcano plot of RNA-seq on sorted TILs according to their Siglec-9 expression. The 3 significantly differentially expressed genes were MIK67 (Ki67), KLF4, and SPP1. *P < 0.05; ***P < 0.001. Data are presented as mean ± SD.
Figure 3
Figure 3. Sig9+CD8+ TILs are a distinct subset within intratumoral CD8+ T cells.
(A and B) Upregulation of the activation markers CD25 (A) and CD69 (B) on Sig9CD8+ or Sig9+ TILs sorted from primary NSCLC samples and activated with anti-CD3/28 antibodies for 48 hours (n = 9). Statistical analysis by paired Student’s t test. (C) ELISA analysis of IFN-γ in the supernatant of sorted Sig9CD8+ T cells or Sig9+CD8+ T cells (n = 3–7, independent patients). Cells were sorted from PBMCs of healthy donors or primary NSCLC samples (TILs). Act, activated. Supernatants from 50,000 cells were analyzed. (D) Analysis of TNF-α in the supernatant of sorted Sig9CD8+ or Sig9+CD8+ cells from healthy donors or NSCLC patient samples (n = 3–7, independent donors/patients). Statistical analysis performed by 1-way ANOVA. (E) Expression level of CD5 in the CD8+PD-1hi population on Sig9 TILs and Sig9+ TILs (n = 9). (F) Percentage of Sig9CD8+ TILs or Sig9+CD8+ TILs in primary NSCLC samples that express Ki67 within the PD-1hi population (n = 9). (G) Frequency of CD38hiCD101hi cells on Sig9 and Sig9+CD8+PD-1hi TILs determined by flow cytometric analysis (n = 13). Statistical analysis by paired Student’s t test. *P < 0.05; **P < 0.01; ***P < 0.001. Data are presented as mean ± SD.
Figure 4
Figure 4. Sia-SAMPs inhibit T cell–mediated tumor cell killing in vitro.
(A) Inhibition of T cell activation by LGALS3BP in a dose-dependent manner measured by intracellular IFN-γ by flow cytometry. CD8+ T cells from healthy donors were activated with anti-CD3 and anti-CD28 antibodies in the presence of increasing amounts of LGALS3BP (μg/ml, n = 3). (B) Representative histograms of binding of Sig9-Fc to A549 WT cells, enzymatically desialylated A549 cells (desia), GNE-deficient A549 cells (GNE-KO), and GNE-KO A549 cells refed with 10 mM Neu5Ac. (C) Percentage of cleaved caspase-3–positive (clCasp3+) WT A549 cells, desialylated A549 cells, GNE-KO A549 cells, or GNE-KO A549 cells fed with Neu5Ac (refed) after incubation with CD8+ T cells and catumaxomab (n = 10). (D) Apoptosis of WT, desialylated, GNE-KO, and refed GNE-KO HT-29 cells measured by upregulation of cleaved caspase-3 in tumor cells (n = 6). (E and F) clCaps3+ A549 (E, n = 11) or HT-29 (F, n = 11) tumor cells after coincubation with TILs from NSCLC or CRC samples. (G) CD8+ T cells were sorted according to their Siglec-9 expression and incubated with either WT or GNE-KO A549 cells (n = 4). (H) CD19+ RAMOS cells were incubated with CD8+ T cells from healthy donors in the presence of CD3 and CD19 bispecific antibody blinatumomab (n = 7). (I) GNE-KO RAMOS cells incubated with CD8+ T cells from patients with chronic lymphocytic leukemia (n = 3). (J) Activation measured by CD25 on CD8+ T cells treated with anti-CD3 and anti-CD28 antibodies in the presence of anti–Siglec-9 antibody (clone 191240, g/ml, n = 4). (K) Relative IL-2 production of NSCLC primary tumor samples incubated with SEB and Siglec-9–blocking antibody and the Fab fragments (clone 191240, n = 5). (L) Measurement of CD69 upregulation on CD8+ TILs from NSCLC patients upon incubation with SEB in the presence of antibodies or Fab fragments (n = 5). Statistical analyses in this figure were performed by 1-way ANOVA. Data are presented as mean ± SD. *P < 0.05; **P < 0.01; ***P < 0.001.
Figure 5
Figure 5. Sialylated SAMPs enhance immune escape and tumor growth in vivo.
(A) Siglec-E expression was determined by flow cytometry on control splenocytes, splenocytes from tumor-bearing mice, and CD8+ TILs from subcutaneous MC38 tumors (n = 25–28). Statistical analysis performed by 1-way ANOVA. (B) Expression of intracellular Ki67 was examined by flow cytometry on SigECD8+ and SigE+CD8+ TILs (n = 18). Statistical analysis by paired Student’s t test. (CE) Frequencies of inhibitory immune receptor expression on SigECD8+ and SigE+CD8+ TILs from MC38 tumors, as studied by flow cytometry. PD-1 (C, n = 16), TIM-3 (D, n = 18), and LAG-3 (E, n = 7) were analyzed. Statistical analysis by paired Student’s t test. (F) Number of coexpressed inhibitory receptors on SigECD8+ or SigE+CD8+ TILs. (G) Upregulation of CD25+CD69+ upon restimulation of sorted SigECD8+ and SigE+CD8+ TILs. Statistical analysis by paired Student’s t test. (H) Growth curves of subcutaneous WT or GNE-KO MC38 tumors (n = 8–9). (I) Growth curves of subcutaneous WT and GNE-KO EMT6 tumors (n = 13-14). Experiments were replicated 2 to 3 times. Statistical analysis by 2-way ANOVA. (J and K) Frequencies of CD3+ and CD8+ cells in the tumor (n = 7). Statistical analysis by unpaired Student’s t test. **P < 0.01; ***P < 0.001. Data are presented as mean ± SD.
Figure 6
Figure 6. Engagement of inhibitory Siglecs on T cells mediates immune escape.
(A) Subcutaneous growth curves of MC38 tumors in littermate Siglec-9 transgenic control mice (HS9) or Siglec-9 transgenic mice crossed to CD4-Cre mice (HS9, CD4Cre) (n = 8–10). The experiment was repeated 3 times. Statistical analysis by 2-way ANOVA. (B) Tumor volumes after 21 days of subcutaneous MC38 tumors in littermate control mice (E/E) or homozygous (E16/E16) mice that express the chimeric receptor SigE16 (n = 7). Statistical analysis performed by 1-way ANOVA. (C) Subcutaneous growth curves of MC38 tumors in E16 mice or littermate control mice after CD4 and CD8 cell depletion by antibodies (n = 7–8). The experiment was repeated 2 times. Statistical analysis by 2-way ANOVA. (D) MC38 tumor volumes after 21 days in E16 mice and littermate control mice and independent depletion of CD4+ and CD8+ T cells. (E) Tumor volume of MC38-OVA tumors after adoptive transfer of OVA-specific OT-I CD8+ T cells from WT or SigE16 (E16) mice. Statistical analysis performed by 1-way ANOVA. *P < 0.05; **P < 0.01. Data are presented as mean ± SD. (F) Survival analysis of NSCLC patients with low (n = 18) and high percentage (above 30%, n = 11) of Siglec-9 expression on their CD8+ T cells. Differences were analyzed by Wilcoxon’s test. A multivariate analysis of the 2 groups for age and stage showed slightly reduced significance, with a P value of 0.0669 (multivariate, univariate analysis P = 0.0097) and a hazard ratio of 14.6.

References

    1. Topalian SL, Drake CG, Pardoll DM. Immune checkpoint blockade: a common denominator approach to cancer therapy. Cancer Cell. 2015;27(4):450–461. doi: 10.1016/j.ccell.2015.03.001. - DOI - PMC - PubMed
    1. Chen DS, Mellman I. Elements of cancer immunity and the cancer-immune set point. Nature. 2017;541(7637):321–330. doi: 10.1038/nature21349. - DOI - PubMed
    1. Cao X. Self-regulation and cross-regulation of pattern-recognition receptor signalling in health and disease. Nat Rev Immunol. 2016;16(1):35–50. doi: 10.1038/nri.2015.8. - DOI - PubMed
    1. Schaefer L. Complexity of danger: the diverse nature of damage-associated molecular patterns. J Biol Chem. 2014;289(51):35237–35245. - PMC - PubMed
    1. Mogensen TH. Pathogen recognition and inflammatory signaling in innate immune defenses. Clin Microbiol Rev. 2009;22(2):240–273. doi: 10.1128/CMR.00046-08. - DOI - PMC - PubMed

Publication types

MeSH terms

Substances