. 2018 Aug 21;15(8):e1002638.
doi: 10.1371/journal.pmed.1002638. eCollection 2018 Aug.

Using routinely collected laboratory data to identify high rifampicin-resistant tuberculosis burden communities in the Western Cape Province, South Africa: A retrospective spatiotemporal analysis

Affiliations

Using routinely collected laboratory data to identify high rifampicin-resistant tuberculosis burden communities in the Western Cape Province, South Africa: A retrospective spatiotemporal analysis

Avery I McIntosh et al. PLoS Med. .

Abstract

Background: South Africa has the highest tuberculosis incidence globally (781/100,000), with an estimated 4.3% of cases being rifampicin resistant (RR). Control and elimination strategies will require detailed spatial information to understand where drug-resistant tuberculosis exists and why it persists in those communities. We demonstrate a method to enable drug-resistant tuberculosis monitoring by identifying high-burden communities in the Western Cape Province using routinely collected laboratory data.

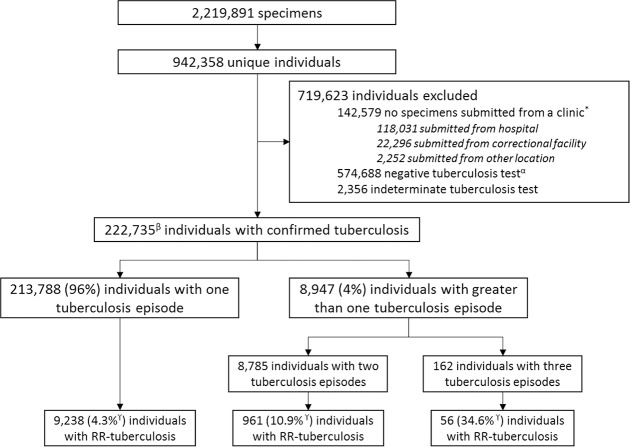
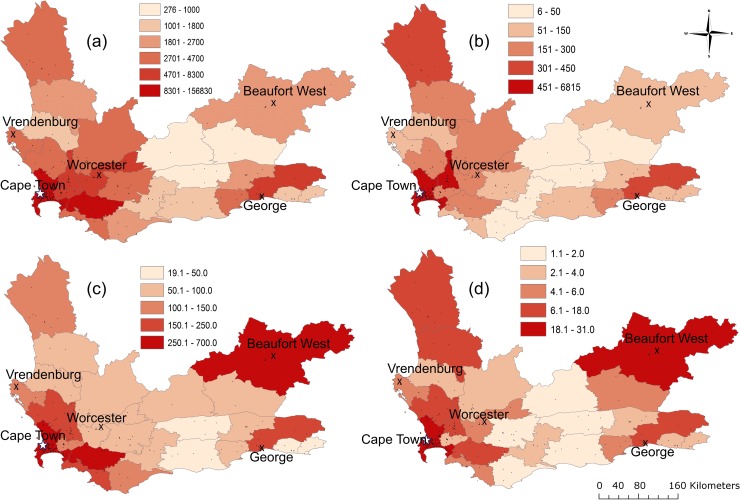
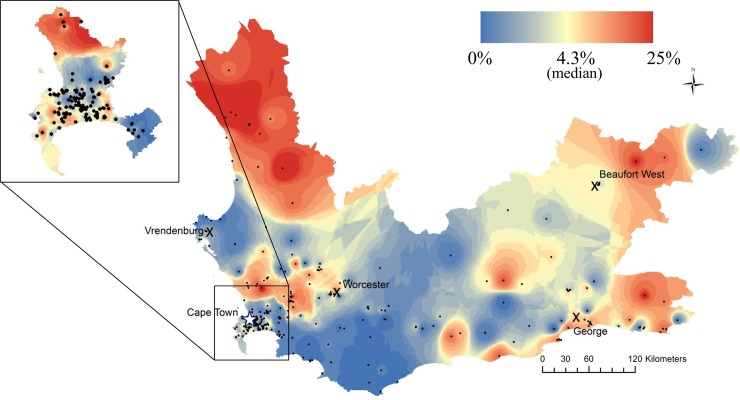
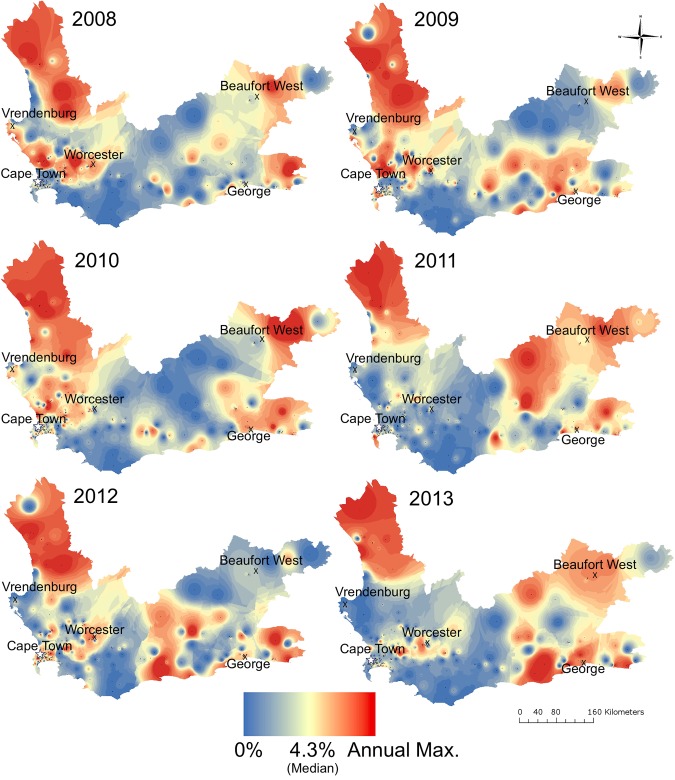
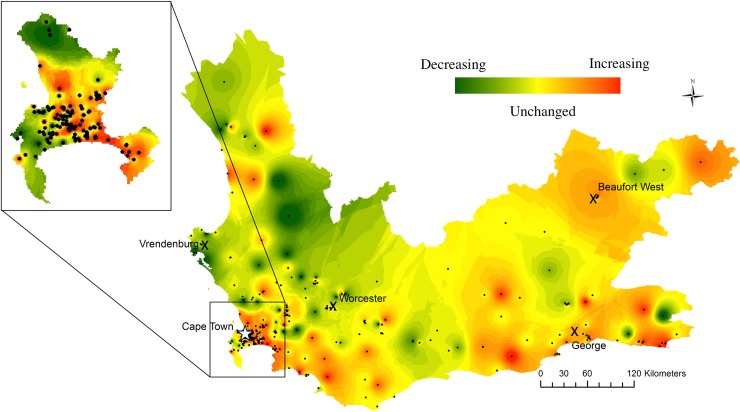
Methods and findings: We retrospectively identified cases of microbiologically confirmed tuberculosis and RR-tuberculosis from all biological samples submitted for tuberculosis testing (n = 2,219,891) to the Western Cape National Health Laboratory Services (NHLS) between January 1, 2008, and June 30, 2013. Because the NHLS database lacks unique patient identifiers, we performed a series of record-linking processes to match specimen records to individual patients. We counted an individual as having a single disease episode if their positive samples came from within two years of each other. Cases were aggregated by clinic location (n = 302) to estimate the percentage of tuberculosis cases with rifampicin resistance per clinic. We used inverse distance weighting (IDW) to produce heatmaps of the RR-tuberculosis percentage across the province. Regression was used to estimate annual changes in the RR-tuberculosis percentage by clinic, and estimated average size and direction of change was mapped. We identified 799,779 individuals who had specimens submitted from mappable clinics for testing, of whom 222,735 (27.8%) had microbiologically confirmed tuberculosis. The study population was 43% female, the median age was 36 years (IQR 27-44), and 10,255 (4.6%, 95% CI: 4.6-4.7) cases had documented rifampicin resistance. Among individuals with microbiologically confirmed tuberculosis, 8,947 (4.0%) had more than one disease episode during the study period. The percentage of tuberculosis cases with rifampicin resistance documented among these individuals was 11.4% (95% CI: 10.7-12.0). Overall, the percentage of tuberculosis cases that were RR-tuberculosis was spatially heterogeneous, ranging from 0% to 25% across the province. Our maps reveal significant yearly fluctuations in RR-tuberculosis percentages at several locations. Additionally, the directions of change over time in RR-tuberculosis percentage were not uniform. The main limitation of this study is the lack of unique patient identifiers in the NHLS database, rendering findings to be estimates reliant on the accuracy of the person-matching algorithm.

Conclusions: Our maps reveal striking spatial and temporal heterogeneity in RR-tuberculosis percentages across this province. We demonstrate the potential to monitor RR-tuberculosis spatially and temporally with routinely collected laboratory data, enabling improved resource targeting and more rapid locally appropriate interventions.


Conflict of interest statement

MBM is a member of the Editorial Board of PLOS Medicine. The authors declare no other competing interests exist.

Figures

Fig 1
Fig 1. Flow diagram showing initial specimens from NHLS, person-linkage results in unique individuals, reasons for exclusion from final mapping, and final results stratified by number of tuberculosis episodes and number of individuals with RR-tuberculosis.
*Locations of individuals with no specimens submitted from a clinic, indicating the location of the first specimen submitted for a given individual. αIndividuals without a positive tuberculosis test and at least one negative tuberculosis test. βOf these individuals with microbiologic confirmation of tuberculosis, 109,246 (49%) had documented rifampicin DST results, either Genotype MTBDRplus LPA or culture based. γThe percentage of individuals with RR-tuberculosis is calculated as the number of RR-tuberculosis cases diagnosed by DST divided by all individuals with microbiologically confirmed tuberculosis. Because a proportion did not complete the rifampicin resistance testing algorithm, this percentage is a lower boundary. DST, drug susceptibility test; LPA, line probe assay; NHLS, National Health Laboratory Services; RR, rifampicin-resistant.
Fig 2
Fig 2
Tuberculosis case counts and RR-tuberculosis case counts aggregated by subdistrict (a and b) and per 100,000 population (c and d). (a) Clinic-diagnosed tuberculosis case counts at subdistrict level between January 2008 and June 2013. (b) Clinic-diagnosed RR-tuberculosis case counts at subdistrict level for the same period. (c) Clinic-diagnosed tuberculosis case count at subdistrict per 100,000 population per year. (d) Clinic-diagnosed RR-tuberculosis case count per 100,000 population per year. Black points denote clinic locations, X’s denote large towns, and the star denotes the Cape Town metropole. RR, rifampicin-resistant.
Fig 3
Fig 3. The percentage of total clinic-diagnosed tuberculosis cases found to be rifampicin resistant in Western Cape Province between 2008 and 2013.
Colors are broken by quantiles. Black dots denote clinic locations, X’s denote large towns, and the star denotes the Cape Town metropole. Zoom to Cape Town. Spatial locator map available in S2 Fig.
Fig 4
Fig 4. The percentage of total clinic-diagnosed tuberculosis cases found to be rifampicin resistant in Western Cape Province, yearly, for 2008–2013.
Each year has an associated spectrum of interpolated percentages, beginning with the percentage of total clinic-diagnosed tuberculosis cases found to be RR-tuberculosis equal to 0 set at blue, with a median value of 4.3% (provincial average) at yellow, and the year-specific maximum (Max.) percentage in red. X’s denote large towns and the star denotes the Cape Town metropole. Max., year-specific maximum; RR, rifampicin-resistant.
Fig 5
Fig 5. Interpolation heatmap of the statistically significant change in rifampicin resistance as a percentage of clinic-diagnosed tuberculosis during 2008–2013.
Red indicates increased rifampicin resistance percentage. Green indicates decreased rifampicin resistance percentage. Yellow indicates no significant change in rifampicin resistance percentages. Intensity of color denotes degree of statistical significance. Black dots denote clinic locations, X’s denote large towns, and the star denotes the Cape Town metropole. Zoom to Cape Town.

References

    1. World Health Organization. Global tuberculosis report 2017. Geneva; 2017.
    1. Floyd K, Glaziou P, Zumla A, Raviglione M. The global tuberculosis epidemic and progress in care, prevention, and research: an overview in year 3 of the End TB era. Lancet Respir Med. Elsevier; 2018;6: 299–314. 10.1016/S2213-2600(18)30057-2 - DOI - PubMed
    1. Jacobson KR, Theron D, Kendall EA, Franke MF, Barnard M, Van Helden PD, et al. Implementation of geno type MTBDRplus reduces time to multidrug-resistant tuberculosis therapy initiation in South Africa. Clin Infect Dis. 2013;56: 503–508. 10.1093/cid/cis920 - DOI - PMC - PubMed
    1. Petruccioli E, Scriba TJ, Petrone L, Hatherill M, Cirillo DM, Joosten SA, et al. Long-lasting tuberculous pleurisy. Eur Respir J. 2017;49 10.1183/13993003.00356–2017 - DOI - PubMed
    1. Guerra CA, Gikandi PW, Tatem AJ, Noor AM, Smith DL, Hay SI, et al. The limits and intensity of Plasmodium falciparum transmission: implications for malaria control and elimination worldwide. PLoS Med. 2008;5 10.1371/journal.pmed.0050038 - DOI - PMC - PubMed

Publication types