. 2018 Dec:183:438-455.
doi: 10.1016/j.neuroimage.2018.08.033. Epub 2018 Aug 18.

Metastable neural dynamics in Alzheimer's disease are disrupted by lesions to the structural connectome

Affiliations

Metastable neural dynamics in Alzheimer's disease are disrupted by lesions to the structural connectome

Thomas H Alderson et al. Neuroimage. 2018 Dec.

Abstract

Current theory suggests brain regions interact to reconcile the competing demands of integration and segregation by leveraging metastable dynamics. An emerging consensus recognises the importance of metastability in healthy neural dynamics where the transition between network states over time is dependent upon the structural connectivity between brain regions. In Alzheimer's disease (AD) - the most common form of dementia - these couplings are progressively weakened, metastability of neural dynamics are reduced and cognitive ability is impaired. Accordingly, we use a joint empirical and computational approach to reveal how behaviourally relevant changes in neural metastability are contingent on the structural integrity of the anatomical connectome. We estimate the metastability of fMRI BOLD signal in subjects from across the AD spectrum and in healthy controls and demonstrate the dissociable effects of structural disconnection on synchrony versus metastability. In addition, we reveal the critical role of metastability in general cognition by demonstrating the link between an individuals cognitive performance and their metastable neural dynamic. Finally, using whole-brain computer modelling, we demonstrate how a healthy neural dynamic is conditioned upon the topological integrity of the structural connectome. Overall, the results of our joint computational and empirical analysis suggest an important causal relationship between metastable neural dynamics, cognition, and the structural efficiency of the anatomical connectome.

Keywords: Alzheimer's disease; DTI; Kuramoto; Metastability; Structural connectome; Whole-brain modelling.


Figures

Fig. 1.
Fig. 1.
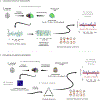
Overview of experimental design. Resting state fMRI BOLD signal was used to calculate empirical metastability across three groups including HC, MCI, and AD (top). 1. A, Each subject’s T1-weighted structural image was parcellated into 148 regions from which average BOLD signal was extracted. Time series were then converted into complex phase plane representation using the Hilbert transform. 1. B, Estimates of resting state network metastability were then calculated. DTI data across the same three groups were used to inform the coupling strength between nodes in a simple oscillator model (bottom). 2. A, A subject’s T1-weighted image was parcellated into 148 distinct regions which were subsequently used to constrain tractography. 2. B, Individual connectivity matrices were created for each clinical subject by lesioning the average control connectivity in tracts that significantly deviated from healthy control values. 2. C, Subject-level whole-brain computer models were constructed with coupling informed by the anatomical data. 2. D, Simulated phase output was subsequently used to estimate resting state network metastability.
Fig. 2.
Fig. 2.
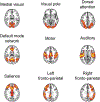
Nine canonical resting state networks reconstructed in MNI 152 space according to the 148 region’s of the Destrieux atlas with a 3 mm isotropic Gaussian blur. The resting state fMRI data of 36 control subjects was decomposed into fifteen independent components nine of which resembled canonical resting state networks (Smith et al., 2009). These nine were subsequently projected into the same space as the Destrieux atlas. Regions exhibiting a mean z-score > 2.3 (p < 0.01) were entered into that network.
Fig. 3.
Fig. 3.
Estimation of subject-level structural disconnection in diagnostic groups (MCI/AD). A. Subject-level connectivity matrices were derived by lesioning the average control network or “healthy template” in locations where tracts demonstrated unusually low FA. The FA value for a single tract was extracted from all 30 controls to form a normal distribution with characteristic mean and standard deviation (blue). The same procedure in the patient cohort yielded a second normal distribution with a mean offset from the first (orange). Patients with tracts displaying FA values less than —1.96 standard deviations from the mean of the controls (p < 0.05; uncorrected) were considered damaged and lesioned from the average structural network of the controls, the strength of these connections being weakened by 50%. Repeating the procedure for all tracts yielded 30 subject-level connectivity matrices per diagnostic group (MCI/ AD). B, Group-level structural connectivity matrices (MCI/AD) were derived for different values of the network based statistic threshold. Nodes forming part of significantly disconnected FA sub-components were considered damaged and lesioned from the average control network or “healthy template”, the strength of these connections being weakened by 50%.
Fig. 4.
Fig. 4.
Total number of lesions pertaining to each region of the Destrieux cortical atlas in MCI (left) and AD cohorts (right), where blue indicates zero lesions and yellow the highest number recorded (normalised between zero and one). In both diagnostic groups, the majority of lesions was focused around core components of the default mode network. Notice however the relative difference in magnitude.
Fig. 5.
Fig. 5.
Model validation and tuning. A, Correlation between simulated and empirical functional connectivity for increasing value of phase lag parameter with 95% CI. B, Mean simulated global synchrony for increasing value of phase lag parameter with correlation overlaid for comparison. Correlation peaks where simulated synchronisation matches empirical synchronisation. C, Mean simulated global metastability for increasing value of phase lag parameter with correlation overlaid for comparison. Again, correlation peaks where simulated metastability matches empirical metastability.
Fig. 6.
Fig. 6.
Empirical global metastability of fMRI BOLD signal (in grey) and simulated global metastability (in green). Simulated metastability was calculated from a computer model with anatomically informed coupling. Empirical metastability was estimated from fMRI BOLD signal. Bars display mean, 95% CI, and one standard deviation for the three cohorts (HC/MCI/AD) with individual subjects indicated. One-way ANOVA revealed significantly lower metastability of large-scale neural dynamics in AD compared to controls for both empirical and simulated data (*p < 0.01).
Fig. 7.
Fig. 7.
Local topological features of the average healthy connectome predict damage to nodal connectivity in the computer model (top) of AD subjects. This included A, eigenvector centrality, B, clustering coefficient, C, local efficiency and D, participation coefficient. All relationships were significant, corrected for multiple comparisons at the Bonferroni p-level of p < 0.001. Nodes of the rich club regime demonstrate the highest number of lesions (bottom). E, All 148 nodes of the Destrieux atlas rank ordered by degree with lesion count ranging from zero lesions, in blue, to the highest number recorded, in yellow, normalised to lie between zero and one. Dashed horizontal lines signal the rich-club regime between degrees 40 and 70. F, All 148 nodes of the Destrieux atlas plotted at the centre of mass of their respective cortical parcellations (left) with diameter proportional to degree and normalised lesion count indicated by colour. Nodes (and their edges) with degree > 60 qualifying for rich-club membership (right).
Fig. 8.
Fig. 8.
Relationship between macroscopic topological organisation including A, mean eigenvector centrality, B, mean clustering coefficient, C, global efficiency and D, mean participation coefficient after lesioning and simulated global metastability in MCI (in red) and AD cohorts (in yellow). A significant positive association was found between macroscopic measures of structural topology and simulated global metastability corrected for multiple comparisons at the Bonferroni p-level of p < 0.0063. For reference, vertical dashed line indicates the value obtained in the group averaged control network.
Fig. 9.
Fig. 9.
Statistically significant (p < 0.05; corrected) intensity-based decreases in focal synchrony between a circumscribed set of resting state networks identified using the network based statistic in fMRI data (left). Statistically significant (p < 0.05; corrected) extent-based decreases in metastability between a widespread set of resting state networks identified using the network based statistic in fMRI data (right). In both cases, the NBS was applied to matrices of synchrony and metastability calculated from empirical fMRI BOLD data at the resting state network level where thresholds were set to reveal the largest disconnected sub-graphs that were statistically significant.
Fig. 10.
Fig. 10.
Relationship between global cognitive test scores and brain-wide metastability of fMRI BOLD signal. A significant association between global cognitive performance (MMSE) and empirical macroscopic neural metastability was found across all participants (p < 0.01).
Fig. 11.
Fig. 11.
Determining the most likely group-level structural skeleton (or NBS threshold) responsible for generating the empirically observed resting state network synchronisation dynamic in the MCI cohort. A, Mean correlation between simulated synchrony (generated from a computer model with coupling defined by grouplevel connectivity) and empirical synchrony (measured in fMRI BOLD signal) drawn in blue with 95% CI. For comparison, the mean correlation between the simulated synchrony of a random control (generated from a computer model with randomly defined coupling) and empirical synchrony (measured in fMRI BOLD signal) is in red with 95% CI. Cohen’s d effect size is indicated by black dashed line. The group-level connectivity or NBS threshold (3.4) at which correlation between simulated and empirical synchrony approximately peaked (r = 0.88) and the Cohen effect size maximised (d = 2.1). B, Same as in A but for metastability. At the group-level connectivity or NBS threshold of 3.4, correlations between simulated and empirical metastability are at their peak (r = 0.80) and the Cohen effect size is moderate (d = 0.5). C, Disconnected FA sub-networks identified by the NBS in a group of 30 patients with MCI at different thresholds (p < 0.05; corrected). Nodes are positioned at the centre of mass of their respective cortical parcellation. At each threshold, identified nodes had their connectivity lesioned from the average control connectivity. The resulting structure informed coupling strength between nodes in a group-level simulation.
Fig. 12.
Fig. 12.
Determining the most likely group-level structural skeleton (or NBS threshold) responsible for generating the empirically observed resting state network synchronisation dynamic in the AD cohort. A, Mean correlation between simulated synchrony (generated from a computer model with coupling defined by group-level connectivity) and empirical synchrony (measured in fMRI BOLD signal) drawn in blue with 95% CI. For comparison, the mean correlation between the simulated synchrony of a random control (generated from a computer model with randomly defined coupling) and empirical synchrony (measured in fMRI BOLD signal) is in red with 95% CI. Cohen’s d effect size is indicated by black dashed line. The group-level connectivity or NBS threshold (4.8) at which correlation between simulated and empirical synchrony approximately peaked (r = 0.9) and the Cohen effect size maximised (d = 2.9) was considered optimal. B, Same as in A but for metastability. At the group-level connectivity or NBS threshold of 4.8, correlations between simulated and empirical metastability are at their peak (r = 0.83) and the Cohen effect size is moderate (d = 0.75). C, Disconnected FA sub-networks identified by the NBS in a group of 30 patients with AD at different thresholds (p < 0.05; corrected). Nodes are positioned at the centre of mass of their respective cortical parcellation. At each threshold, identified nodes had their connectivity lesioned from the average control connectivity. The resulting structure informed coupling strength between nodes in a group-level simulation.

References

    1. Acebrón J. a., Bonilla LL, Vicente CJP, Ritort F, Spigler R, 2005. The Kuramoto model: a simple paradigm for synchronization phenomena. Rev. Mod. Phys. 77, 137–185. 10.1103/RevModPhys.77.137. - DOI
    1. Andersson JLR, Jenkinson M, Smith S, 2007. Non-linear registration aka spatial normalisation FMRIB technial report TR07JA2. In: Practice.
    1. Andreasen NC, O’Leary DS, Cizadlo T, Arndt S, Rezai K, Watkins GL, Ponto LLB, Hichwa RD, 1995. Remembering the past: two facets of episodic memory explored with positron emission tomography. Am. J. Psychiatr. 152, 1576–1585. 10.1176/ajp.152.11.1576. - DOI - PubMed
    1. Aung WY, Mar S, Benzinger TL, 2013. Diffusion tensor MRI as a biomarker in axonal and myelin damage. Imag. Med. 5, 427–440. 10.2217/iim.13.49 - DOI - PMC - PubMed
    1. Bassett DS, Wymbs NF, Porter MA, Mucha PJ, Carlson JM, Grafton ST, 2011. Dynamic reconfiguration of human brain networks during learning. Proc. Natl. Acad. Sci. U. S. A. 108, 7641–7646. 10.1073/pnas.1018985108. - DOI - PMC - PubMed

Publication types