. 2018 Oct 3;8(10):3255-3267.
doi: 10.1534/g3.118.200502.

Imputation-Aware Tag SNP Selection To Improve Power for Large-Scale, Multi-ethnic Association Studies

Affiliations

Imputation-Aware Tag SNP Selection To Improve Power for Large-Scale, Multi-ethnic Association Studies

Genevieve L Wojcik et al. G3 (Bethesda). .

Abstract

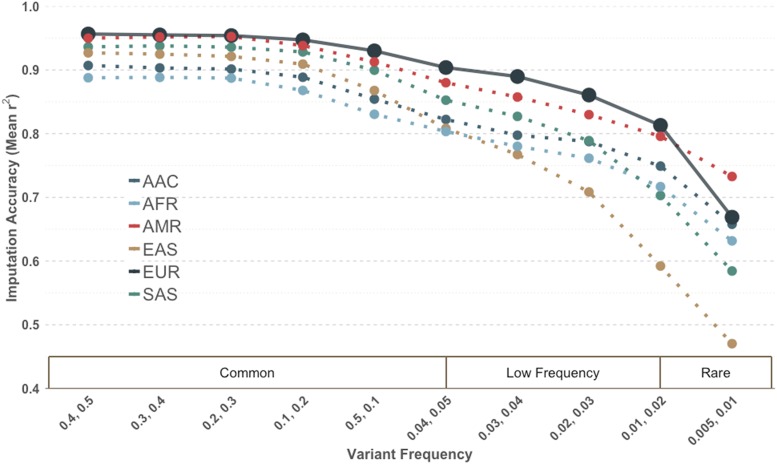
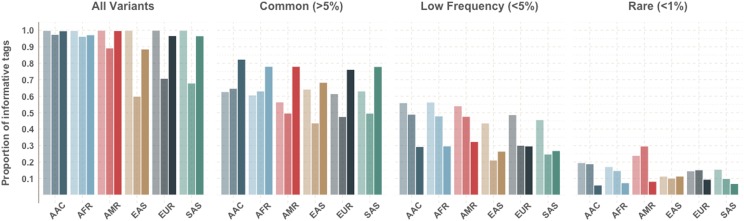
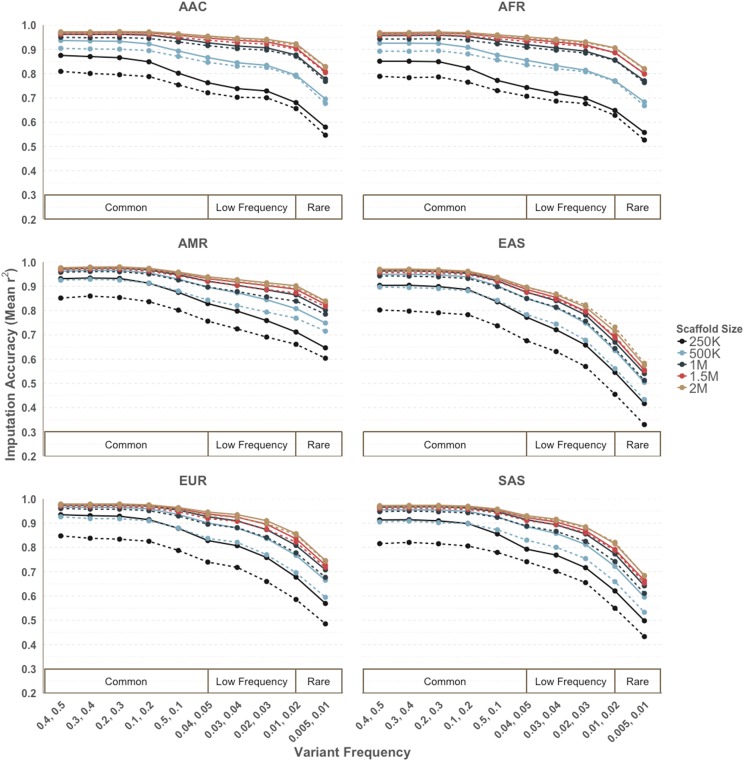
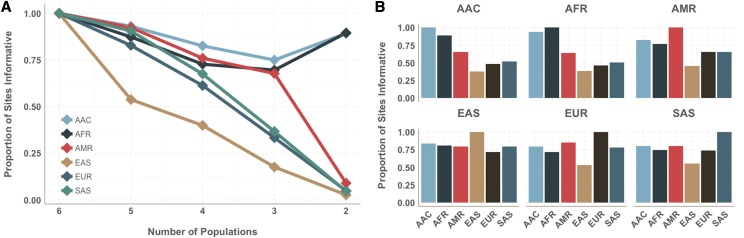
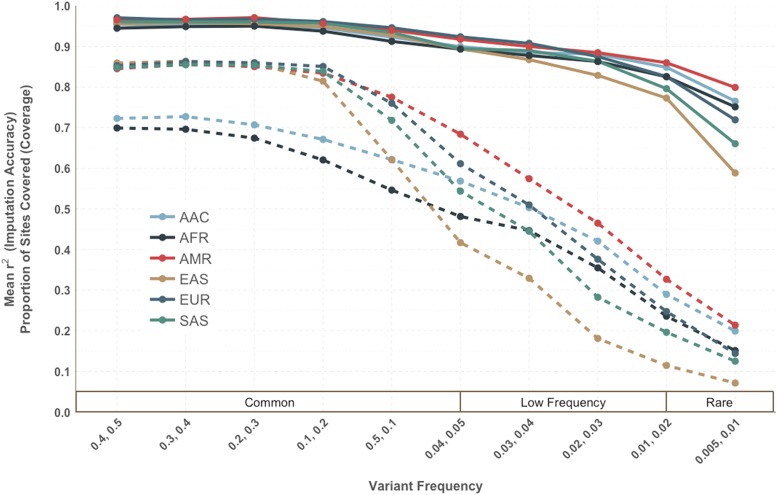
The emergence of very large cohorts in genomic research has facilitated a focus on genotype-imputation strategies to power rare variant association. These strategies have benefited from improvements in imputation methods and association tests, however little attention has been paid to ways in which array design can increase rare variant association power. Therefore, we developed a novel framework to select tag SNPs using the reference panel of 26 populations from Phase 3 of the 1000 Genomes Project. We evaluate tag SNP performance via mean imputed r2 at untyped sites using leave-one-out internal validation and standard imputation methods, rather than pairwise linkage disequilibrium. Moving beyond pairwise metrics allows us to account for haplotype diversity across the genome for improve imputation accuracy and demonstrates population-specific biases from pairwise estimates. We also examine array design strategies that contrast multi-ethnic cohorts vs. single populations, and show a boost in performance for the former can be obtained by prioritizing tag SNPs that contribute information across multiple populations simultaneously. Using our framework, we demonstrate increased imputation accuracy for rare variants (frequency < 1%) by 0.5-3.1% for an array of one million sites and 0.7-7.1% for an array of 500,000 sites, depending on the population. Finally, we show how recent explosive growth in non-African populations means tag SNPs capture on average 30% fewer other variants than in African populations. The unified framework presented here will enable investigators to make informed decisions for the design of new arrays, and help empower the next phase of rare variant association for global health.

Keywords: Genomics; Imputation; Statistical Genetics; array design; tag SNPs.


Figures

Figure 1
Figure 1
Imputation Accuracy by super population of tags selected in European populations for a scaffold assuming 500,000 genome-wide variants. Tags were required to have a MAF ≥ 1% and r2 ≥ 0.5 with target sites. This trend is observed across all super populations (S1 Fig).
Figure 2
Figure 2
Proportion of tags that are informative by population with the three methods. (Left, lightest) tags selected from only a single population, (Center) tags selected by pooling all populations agnostically, and (Right) tags selected with the cross-population prioritization approach. Tag SNPs were informative if they were in linkage disequilibrium (r2 > 0.5) with at least one untagged site.
Figure 3
Figure 3
Increased imputation accuracy with cross-population prioritization (solid line) vs. naïve approach (dashed line) for a minimum pairwise correlation threshold of r2 > 0.5 and MAF > 1% across different scaffold sizes. Imputation accuracy was calculated separately within minor allele frequency bins for each super population.
Figure 4
Figure 4
Influence of (A) minimum r2 threshold and (B) lower MAF threshold on imputation accuracy and coverage (r2 > 0.5 and r2 > 0.8) within populations from the Americas with an allocation of 1M sites.
Figure 5
Figure 5
Tag SNPs informativeness across population. (A) Proportion of sites informative (r2 > 0.5, MAF > 0.01, 1M site scaffold) across a number of populations, with lines corresponding to the index population. For example, for sites that are informative (r2 > 0.5 with any untyped SNP in genome) in five out of the six populations, only slightly more than half are informative in East Asian populations while greater than 90% are informative in African populations. (B) Proportion of sites shared across populations, conditional on index population. For example, for sites informative in African populations, less than half are informative in East Asian, European, and South Asian populations.
Figure 6
Figure 6
Coverage (dashed lines) vs. Imputation Accuracy (solid lines), assuming a genome-wide scaffold size of one million tags. Coverage is shown with an r2 > 0.8. While pairwise tagging values are low, particularly in African-descent populations, multi-marker imputation accuracy remains high across groups.

References

    1. 1000 Genomes Project Consortium, A. Auton, Brooks L. D., Durbin R. M., Garrison E. P., et al. , 2015. A global reference for human genetic variation. Nature 526: 68–74. 10.1038/nature15393 - DOI - PMC - PubMed
    1. Banda Y., Kvale M. N., Hoffmann T. J., Hesselson S. E., Ranatunga D., et al. , 2015. Characterizing Race/Ethnicity and Genetic Ancestry for 100,000 Subjects in the Genetic Epidemiology Research on Adult Health and Aging (GERA) Cohort. Genetics 200: 1285–1295. 10.1534/genetics.115.178616 - DOI - PMC - PubMed
    1. Barrett J. C., Cardon L. R., 2006. Evaluating coverage of genome-wide association studies. Nat. Genet. 38: 659–662. 10.1038/ng1801 - DOI - PubMed
    1. Bhangale T. R., Rieder M. J., Nickerson D. A., 2008. Estimating coverage and power for genetic association studies using near-complete variation data. Nat. Genet. 40: 841–843. 10.1038/ng.180 - DOI - PubMed
    1. Browning B. L., Browning S. R., 2016. Genotype Imputation with Millions of Reference Samples. Am. J. Hum. Genet. 98: 116–126. 10.1016/j.ajhg.2015.11.020 - DOI - PMC - PubMed

Publication types