. 2018 Aug 21;11(544):eaat6753.
doi: 10.1126/scisignal.aat6753.

Phosphoproteomic analysis of chimeric antigen receptor signaling reveals kinetic and quantitative differences that affect cell function

Affiliations

Phosphoproteomic analysis of chimeric antigen receptor signaling reveals kinetic and quantitative differences that affect cell function

Alexander I Salter et al. Sci Signal. .

Abstract

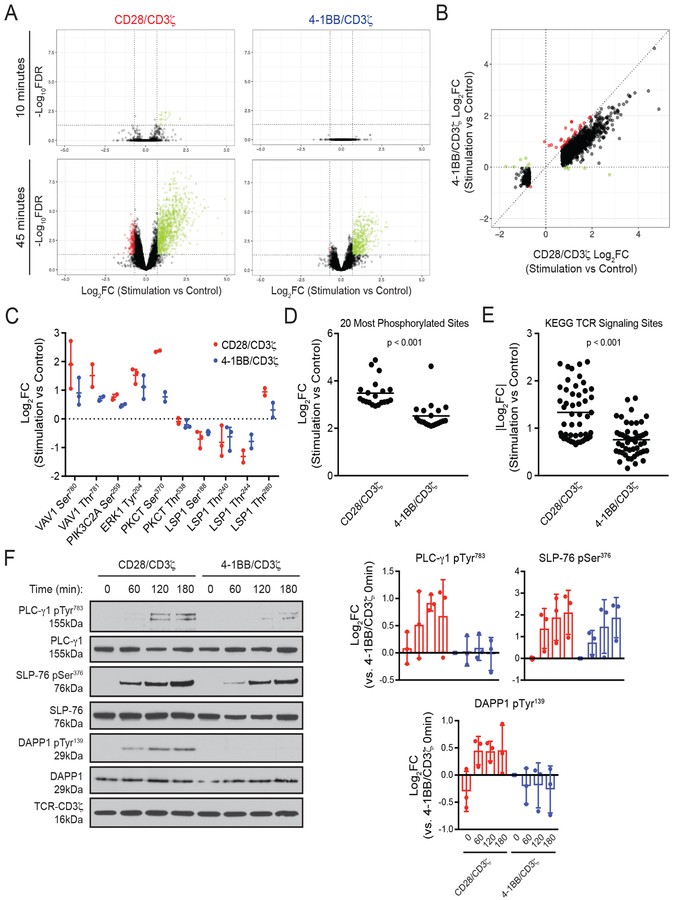
Chimeric antigen receptors (CARs) link an antigen recognition domain to intracellular signaling domains to redirect T cell specificity and function. T cells expressing CARs with CD28/CD3ζ or 4-1BB/CD3ζ signaling domains are effective at treating refractory B cell malignancies but exhibit differences in effector function, clinical efficacy, and toxicity that are assumed to result from the activation of divergent signaling cascades. We analyzed stimulation-induced phosphorylation events in primary human CD8+ CD28/CD3ζ and 4-1BB/CD3ζ CAR T cells by mass spectrometry and found that both CAR constructs activated similar signaling intermediates. Stimulation of CD28/CD3ζ CARs activated faster and larger-magnitude changes in protein phosphorylation, which correlated with an effector T cell-like phenotype and function. In contrast, 4-1BB/CD3ζ CAR T cells preferentially expressed T cell memory-associated genes and exhibited sustained antitumor activity against established tumors in vivo. Mutagenesis of the CAR CD28 signaling domain demonstrated that the increased CD28/CD3ζ CAR signal intensity was partly related to constitutive association of Lck with this domain in CAR complexes. Our data show that CAR signaling pathways cannot be predicted solely by the domains used to construct the receptor and that signal strength is a key determinant of T cell fate. Thus, tailoring CAR design based on signal strength may lead to improved clinical efficacy and reduced toxicity.


Conflict of interest statement

Competing Interests:

S.R.R. is a founder, shareholder, and scientific advisor of Juno Therapeutics. R.G. is a consultant for Juno Therapeutics. STII CAR technology used in this study is licensed to Juno Therapeutics. A.I.S. and S.R.R. have filed a provisional patent application number 62/635,450 covering applications of mutant CD28 CARs for cellular therapy. The other authors declare that they have no competing interests.

Figures

Figure 1.
Figure 1.. Both CD28/CD3ζ and 4–1BB/CD3ζ CAR T cells can be activated through an engineered STII hinge.
(A) Schematic of CARs incorporating a STII sequence in the extracellular hinge. CARs contained either the CD19-specific FMC63 scFv or ROR1-specific R12 scFv. (B) Schematic of CAR T cell activation through the STII hinge using magnetic beads coated with antibody against STII. (C) Flow cytometry analysis of CD8 and EGFRt staining on singlet CD19 CAR T cells after expansion. Dot plots are representative of 3 independent experiments. The frequency of positive cells are means from all experiments. (D and E) Flow cytometry analysis of STII staining of cell surface CAR (D) or CD45RO, CD62L, CD27, CD28, PD-1, and Tim-3 phenotypic marker staining (E) on sort-purified CD19-specific or ROR1-specific singlet CD8+ CAR T cells after expansion. Histogram plots of CD28/CD3ζ CAR T cells (red), 4–1BB/CD3ζ CAR T cells (blue), or isotype control staining (grey) are representative of 4 independent experiments. The frequency of positive cells are means from all experiments. (F) Flow cytometry analysis of the DNA content of CAR T cells after expansion. Histograms are representative of 4 independent experiments. The frequency of cells in G0/G1 gate are means from all experiments. (G) Western blot analysis for CD3ζ, CD3ζ pTyr142, SLP-76, and SLP-76 pSer376 in lysates of ROR1 4–1BB/CD3ζ CAR T cells after 45 minutes of co-culture with varying quantities of STII microbeads, K562 cells, or K562/ROR1 cells. Blots and Fold change (log2FC) of normalized band intensity values are representative of 2 independent experiments. The indicated P values were calculated by paired two-tailed t test (E).
Figure 2.
Figure 2.. CAR T cells signal through endogenous T cell signaling proteins.
(A and B) Human CAR T cell treatment conditions and experimental groups. (C to E) Tandem MS/MS analysis of phosphorylated peptides from lysates of CAR T cells stimulated as in (A). The total number of pSer, pThr and pTyr peptides identified (C) and the Venn diagram of the overlap among phosphorylation sites (D) are pooled from 3 independent experiments. The fold change (log2FC) in phosphorylation at the indicated times at sites involved in canonical TCR signaling (E) are means ± range from 2 or 3 independent experiments. (F) Western blot analysis for CD3ζ, CD3ζ pTyr142, ZAP-70 pTyr319, and PLC-γ1 pTyr783 in lysates from CD19-specific CD28/CD3ζ or 4–1BB/CD3ζ CAR T cells at the indicated times after stimulation. Blots are representative of the 3 independent experiments. Fold change (log2FC) of normalized band intensity are means ± SD from all experiments. The indicated P values were calculated by repeated-measures one-way ANOVA with Tukey’s multiple comparisons test comparing CD28/CD3ζ and 4–1BB/CD3ζ CAR samples (F).
Figure 3.
Figure 3.. The kinetics and strength of signaling vary after stimulation of CD28/CD3ζ or 4–1BB/CD3ζ CAR T cells.
(A) Volcano plots of fold change (log2FC) and false discovery rate (FDR) for phosphorylation sites identified by tandem MS/MS in Fig 2. Green dots indicate sites with increased phosphorylation and red dots indicate sites with decreased phosphorylation after CAR stimulation in at least 2 experiments. (B) Comparison of stimulation-responsive phosphorylation sites identified by tandem MS/MS in Fig 2 at 45 minutes after activation in either CD28/CD3ζ and 4–1BB/CD3ζ CAR samples. Green dots specify sites that exhibited opposite responses after CD28/CD3ζ or 4–1BB/CD3ζ CAR activation, whereas red dots indicate sites phosphorylated to a greater extent after stimulation of 4–1BB/CD3ζ CAR T cells in at least 2 tandem MS/MS experiments in Fig 2. (C) The fold change in phosphorylation sites on known CD28 and 4–1BB signaling pathway members at 45 minutes after CAR T cell stimulation. Data are means ± range from 2 or 3 tandem MS/MS experiments in Fig 2. (D) The fold change in the 20 most phosphorylated sites identified by tandem MS/MS in Fig 2. Data are means from all experiments. (E) The absolute fold change of phosphorylation sites on known KEGG TCR signaling pathway proteins identified by tandem MS/MS in Fig 2. Data are means from all experiments. (F) Western blot analysis for CD3ζ, DAPP1, DAPP1 pTyr139, SLP-76, SLP-76 pSer376, PLC-γ1, and PLC-γ1 pTyr783 in lysates from ROR1 CAR T cells stimulated with STII microbeads for the indicated times. Blots are representative of 3 independent experiments. Fold change of normalized band intensity are means ± SD from all experiments. The indicated P values were calculated by unpaired two-tailed t test (D and E).
Figure 4.
Figure 4.. Stimulation of CD28/CD3ζ or 4–1BB/CD3ζ CAR T cells alters protein phosphorylation across similar signaling pathways and cellular compartments.
Map of select proteins differentially phosphorylated after 45 minutes of CAR T cell stimulation from analysis of all tandem MS/MS experiments in Fig 2.
Figure 5.
Figure 5.. Increased CD28/CD3ζ CAR signal intensity is associated with an effector cell-like phenotype and reduced in vivo anti-tumor activity.
(A to C) RNA-Seq analysis of total RNA expression in CD28/CD3ζ or 4–1BB/CD3ζ CAR T cells with and without stimulation. The fold change values of the indicated transcripts (A and B) are means ± SD from 3 independent experiments. Transcripts in (B) met an FDR of 1% for differential expression between CD28/CD3ζ and 4–1BB/CD3ζ CAR T cells. Volcano plot analysis (C) indicates genes with increased expression in CD28/CD3ζ CAR T cells (green) or increased expression in 4–1BB/CD3ζ CAR T cells (red). (D) qRT-PCR analysis of IL7R, KLF2, and FOXO4 expression in CD28/CD3ζ and 4–1BB/CD3ζ CAR T cells. Fold change data are means ± SD from 3 biological replicates. (E) ELISA analysis of cytokine production 24 hours after co-culture of ROR1-specific CAR T cells with K562/ROR1 cells. Data are means ± SD of 3–4 independent experiments. (F) Flow cytometry analysis of T cell proliferation as measured by CFSE dye dilution at 72 hours after STII microbead stimulation. Histogram plot of unstimulated CD28/CD3ζ CAR T cells (grey), unstimulated 4–1BB/CD3ζ CAR T cells (black), stimulated CD28/CD3ζ CAR T cells (red), and stimulated 4–1BB/CD3ζ CAR T cells (blue). The proliferation index of cells are means from 5 independent experiments (p = 0.0747). (G to J) At 7 days after Raji/ffluc engraftment, NSG mice were treated with a single infusion of the indicated dose of CAR T cells. Survival analyses (G) of 6, 9, or 15 mice per group are pooled from 2–3 independent experiments. Bioluminescence images of Raji/ffluc tumor burden in mice at the indicated time points (H) are representative of all experiments. (I and J) Flow cytometry analysis of CAR T cell frequency in bone marrow or peripheral blood (I), or abundance of PD-1, Lag-3, or Tim-3 on CAR T cells in the bone marrow (J) on day 20. Frequency and MFI data are means ± SD of 10 mice per group from 2 independent experiments. The indicated P values were calculated by one sample t test with null hypothesis H0 = 0 (D), paired two-tailed t test (E and F), log-rank (Mantel-Cox) test (G), or unpaired two-tailed t test (I and J).
Figure 6.
Figure 6.. CD28/CD3ζ and 4–1BB/CD3ζ CARs differentially associate with endogenous Lck and CD28.
(A) Western blot analysis for Lck, CD28, and CD3ζ in whole cell lysates (L) and STII immunoprecipitated fractions (IP) from unstimulated ROR1-specific CAR T cells. Blots are representative of 3–4 independent experiments. (B) Schematic of mutations made to the CAR CD28 signaling domain. (C) Flow cytometry analysis of ROR1-specific CAR T cell proliferation as measured by CFSE dye dilution at 72 hours after co-culture with K562/ROR1 cells. Histograms of untransduced T cells (grey), or 4–1BB/CD3ζ (blue), CD28/CD3ζ (red), Y1 (green), and Y3 CAR T cells (purple) after stimulation are representative of 3 independent experiments. (D) ELISA analysis of IFN-γ production by ROR1-specific 4–1BB/CD3ζ (blue), CD28/CD3ζ (red), Y1 (green), or Y3 CAR T cells (purple) after co-culture with K562/ROR1 cells for 24 hours. Fold change data are means ± SD of 3 independent experiments. (E) Western blot analysis for CD3ζ, CD3ζ pTyr142, SLP-76, SLP-76 pSer376, PLC-γ1, and PLC-γ1 pTyr783 in lysates from ROR1-specific CAR T cells stimulated for the indicated times with STII microbeads. Blots are representative of 3 independent experiments. Fold change of normalized band intensity are means ± SD from all experiments. (F) Western blot analysis for Lck, CD28, and CD3ζ in whole cell lysates (L) and STII immunoprecipitated fractions (IP) from resting CAR T cells. Blots are representative of at least 3 independent experiments. Fold change of normalized band intensity are means ± SD from 3 (CD28) or 4 (Lck) independent experiments. The indicated P values were calculated by repeated-measures one-way ANOVA with Tukey’s multiple comparisons test comparing samples at equivalent time points (E and F).
Figure 7.
Figure 7.. Mutations that reduce Lck binding diminish CD28/CD3ζ CAR signal intensity.
(A) Schematic of mutations made to the CAR CD28 signaling domain. (B) Western blot analysis for Lck and CD3ζ within whole cell lysates (L) and STII immunoprecipitated fractions (IP) from resting CAR T cells. Blots and fold change in the normalized band intensity values are representative of 2 independent experiments. (C) Western blot analysis for CD3ζ, CD3ζ pTyr142, SLP-76, SLP-76 pSer376, PLC-γ1, and PLC-γ1 pTyr783 within lysates from CAR T cells stimulated for the indicated times with STII microbeads. Blots are representative of 3 independent experiments. Fold change in the normalized band intensity values are means ± SD from all experiments. The indicated P values were calculated by repeated-measures one-way ANOVA with Tukey’s multiple comparisons test comparing samples at equivalent time points (C).

Similar articles

Cited by

References

    1. Sadelain M, Riviere I, Riddell S, Therapeutic T cell engineering, Nature 545, 423–431 (2017). - PMC - PubMed
    1. Srivastava S, Riddell SR, Engineering CAR-T cells: Design concepts, Trends in Immunology 36, 494–502 (2015). - PMC - PubMed
    1. Kalos M, Levine BL, Porter DL, Katz S, Grupp SA, Bagg A, June CH, T cells with chimeric antigen receptors have potent antitumor effects and can establish memory in patients with advanced leukemia, Sci Transl Med 3, 95ra–73. (2011). - PMC - PubMed
    1. Maude SL, Frey N, Shaw PA, Aplenc R, Barrett DM, Bunin NJ, Chew A, Gonzalez VE, Zheng Z, Lacey SF, Mahnke YD, Melenhorst JJ, Rheingold SR, Shen A, Teachey DT, Levine BL, June CH, Porter DL, Grupp SA, Chimeric antigen receptor T cells for sustained remissions in leukemia, N Engl J Med 371, 1507–1517 (2014). - PMC - PubMed
    1. Davila ML, Riviere I, Wang X, Bartido S, Park J, Curran K, Chung SS, Stefanski J, Borquez-Ojeda O, Olszewska M, Qu J, Wasielewska T, He Q, Fink M, Shinglot H, Youssif M, Satter M, Wang Y, Hosey J, Quintanilla H, Halton E, Bernal Y, Bouhassira DCG, Arcila ME, Gonen M, Roboz GJ, Maslak P, Douer D, Frattini MG, Giralt S, Sadelain M, Brentjens R, Efficacy and toxicity management of 19–28z CAR T cell therapy in B cell acute lymphoblastic leukemia, Sci Transl Med 6, 224–25 (2014). - PMC - PubMed

Publication types

MeSH terms

Substances