. 2018 Dec 1;24(23):6028-6039.
doi: 10.1158/1078-0432.CCR-18-1256. Epub 2018 Aug 21.

Abemaciclib Is Active in Preclinical Models of Ewing Sarcoma via Multipronged Regulation of Cell Cycle, DNA Methylation, and Interferon Pathway Signaling

Affiliations

Abemaciclib Is Active in Preclinical Models of Ewing Sarcoma via Multipronged Regulation of Cell Cycle, DNA Methylation, and Interferon Pathway Signaling

Michele Dowless et al. Clin Cancer Res. .

Abstract

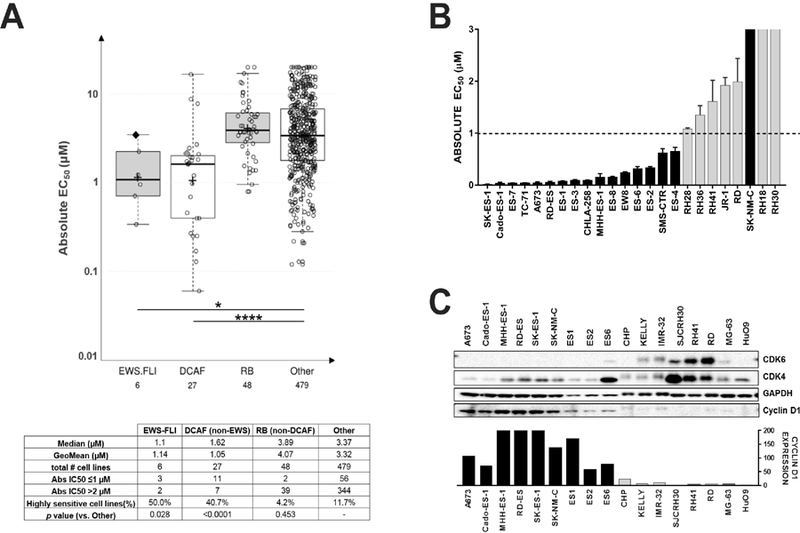
Purpose: Ewing sarcoma (ES) is a rare and highly malignant cancer that occurs in the bone and surrounding tissue of children and adolescents. The EWS/ETS fusion transcription factor that drives ES pathobiology was previously demonstrated to modulate cyclin D1 expression. In this study, we evaluated abemaciclib, a small-molecule CDK4 and CDK6 (CDK4 and 6) inhibitor currently under clinical investigation in pediatric solid tumors, in preclinical models of ES.

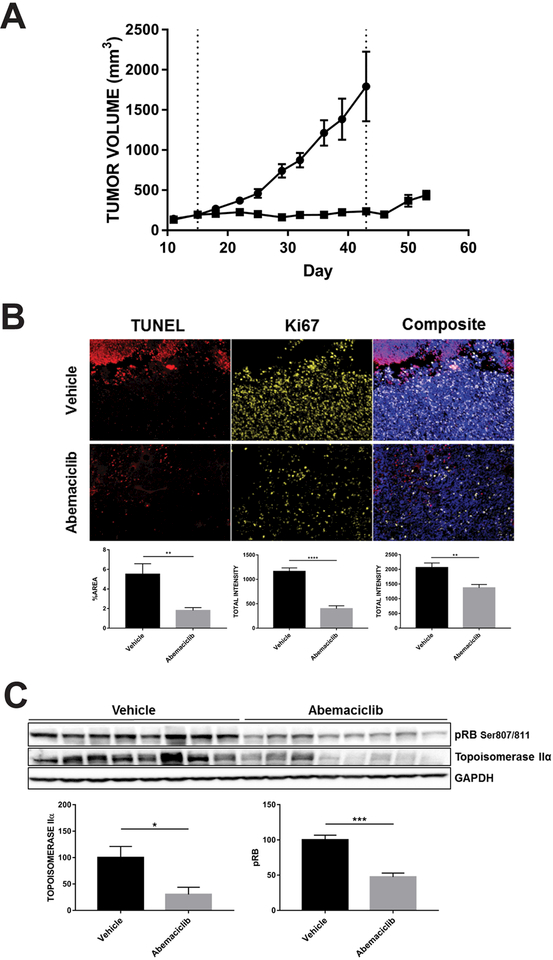
Experimental design: Using Western blot, high-content imaging, flow cytometry, ELISA, RNA sequencing, and CpG methylation assays, we characterized the in vitro response of ES cell lines to abemaciclib. We then evaluated abemaciclib in vivo in cell line-derived xenograft (CDX) and patient-derived xenograft (PDX) mouse models of ES as either a monotherapy or in combination with chemotherapy.

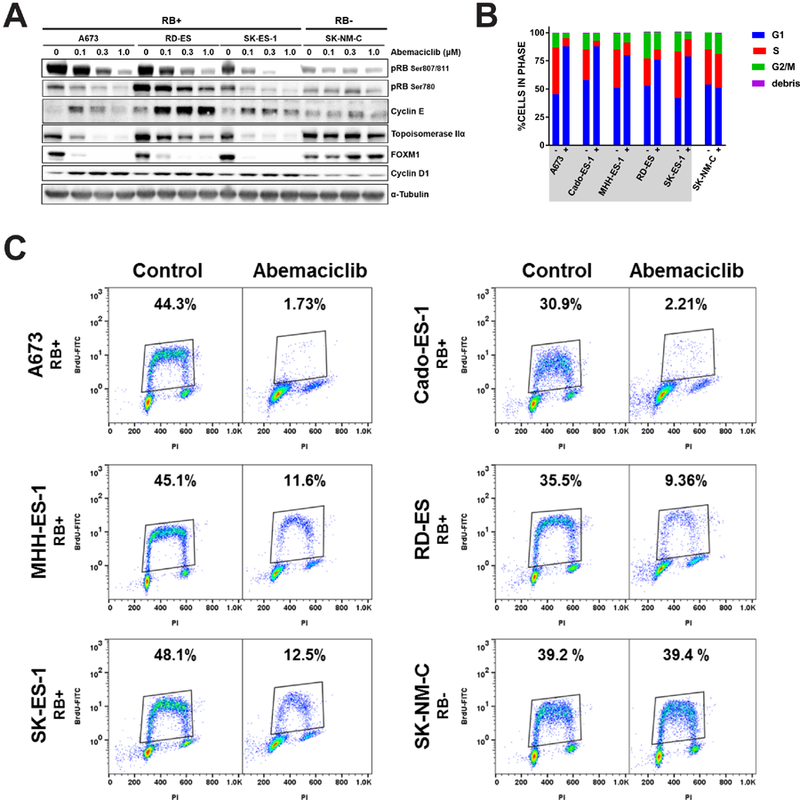
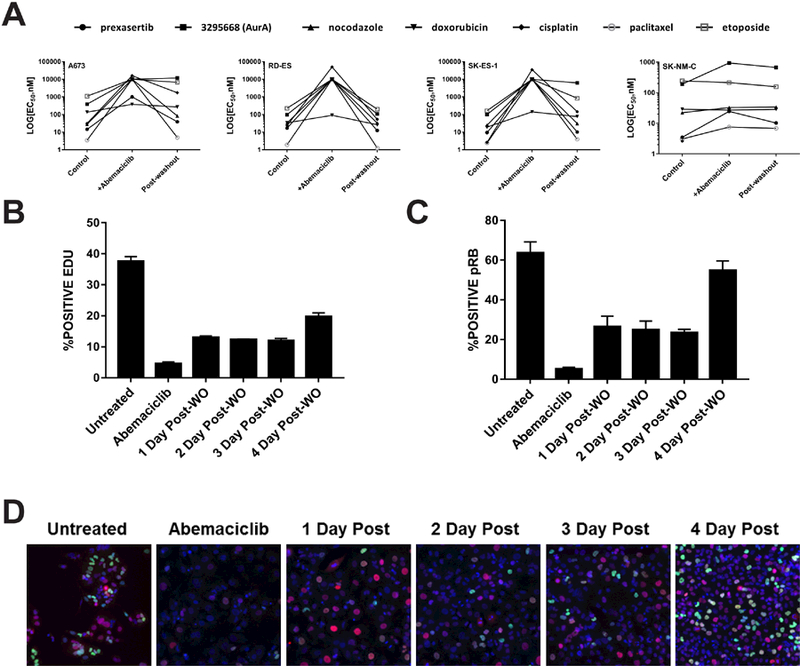
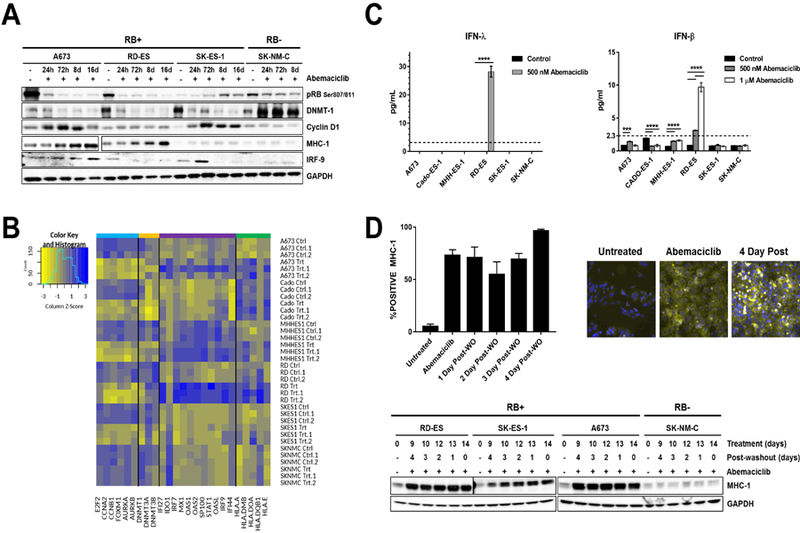
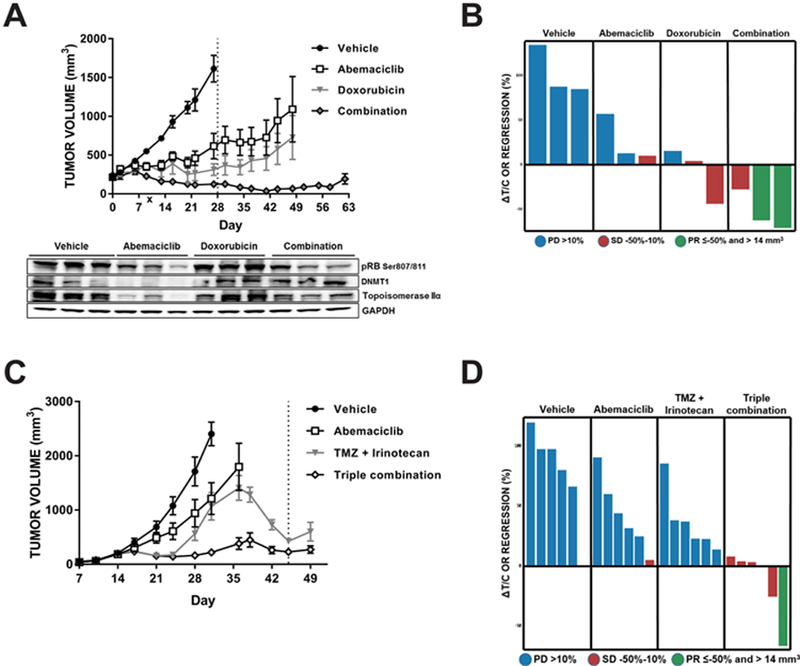
Results: Abemaciclib induced quiescence in ES cell lines via a G1 cell-cycle block, characterized by decreased proliferation and reduction of Ki-67 and FOXM1 expression and retinoblastoma protein (RB) phosphorylation. In addition, abemaciclib reduced DNMT1 expression and promoted an inflammatory immune response as measured by cytokine secretion, antigen presentation, and interferon pathway upregulation. Single-agent abemaciclib reduced ES tumor volume in preclinical mouse models and, when given in combination with doxorubicin or temozolomide plus irinotecan, durable disease control was observed.

Conclusions: Collectively, our data demonstrate that the antitumor effects of abemaciclib in preclinical ES models are multifaceted and include cell-cycle inhibition, DNA demethylation, and immunogenic changes.


Conflict of interest statement

Conflict of Interest Statement: All authors except for T. Shackleford and P. Houghton are full-time employees of Eli Lilly and Company.

Figures

Figure 1.
Figure 1.. Ewing’s sarcoma and other cell lines with D-cyclin activating features are highly sensitive to abemaciclib.
A, Box plot graphical representation of abemaciclib sensitivity in a 560 cell line panel. Data is divided into categories based on those cells with an EWS/FLI1 fusion (EWS.FLI), cells with D-cyclin activating features (DCAF), cells with RB mutation (RB), or all other cells (other). +: geometric mean; black diamond: SK-NM-C ES cell line which has both the EWS/FLI fusion protein and an RB1 mutation; gray diamond: NCI-H1048 small cell lung cancer cell has both DCAF and an RB1 mutation. Ordinary one-way ANOVA of log EC50s with Sidak’s multiple comparison test. * = p < 0.05, **** = p < 0.0001. For a complete list of cell lines tested, see Supplementary Table S1 of (25). B, Cell lines were treated with abemaciclib for 96 h and proliferation determined using either cell counts or alamarBlue assay. Absolute EC50 values are the average of three biological replicates. Black bars: ES cell lines; gray bars: rhabdomyosarcoma (RMS) cell lines; error bars: SEM; dotted line: clinically achievable sustained concentration. C, Whole cell lysates from a panel of pediatric cell lines from multiple histologies: Ewing’s sarcoma (black bars), neuroblastoma (CHP, KELLY, IMR-32), RMS (SJCRH30, RH41, RD), and osteosarcoma (MG-63, HuO9) were analyzed by Western blot for the indicated proteins. Quantitation below Western blot is cyclin D1 normalized to GAPDH.
Figure 2.
Figure 2.. Abemaciclib induces a cell cycle block in Ewing’s sarcoma cell lines with intact RB.
A, After treatment with abemaciclib for 48 h, cells were lysed and the indicated total and phosphorylated proteins were assessed by Western blot analysis. B and C, After 96 h of treatment with 500 nM abemaciclib, cells were pulsed with BrdU for 1 h and then fixed. Cells were co-stained with anti-BrdU and PI and analyzed by flow cytometry. B, Cell cycle was based on PI staining and modeled with ModFit software. Cell lines with RB proficiency are encompassed by the gray box. , Percentage of cells in S-phase was determined by BrdU analysis and is indicated by the boxed-in portion of the graph.
Figure 3.
Figure 3.. Abemaciclib treated ES cells are resistant to chemotherapy agents during simultaneous treatment but regain sensitivity upon abemaciclib washout.
A, ES cell lines were treated with 1 μM abemaciclib or vehicle control continuously for 14 days. Cells were then co-treated with the indicated drug or abemaciclib was washed out for 7 days prior to drug treatment. Cell proliferation was measured 72 h post-drug treatment and EC50 values for chemotherapy agents calculated based on a 10-point serial dilution curve. B-D, A673 cells were treated continually for 14 days with abemaciclib or abemaciclib was washed out prior to fixation (Day Post-WO) and replaced with normal growth media. On day 14 cells were fixed, stained, and imaged for active DNA synthesis by EdU expression (B,) and RB phosphorylation (C). Data is presented as the mean of 4 technical replicates ± SEM measuring % positive cells. D, Representative images from each time point taken at 20X magnification. Blue: nuclei; green: EdU; red: pRB.
Figure 4.
Figure 4.. Abemaciclib treatment induces a loss of DNMT-1, active interferon pathway signaling, and durable antigen presentation response in vitro.
ES cell lines were treated continually with 500 nM abemaciclib for up to 16 days. A, Whole cell lysates were analyzed by western blot for expression of the indicated proteins. B, Day 14 biological triplicate samples were split for RNA and protein analysis, RNASeq results are presented as a heat map. ANOVA models were used to eliminate machine, flow-cell, and lane effects. Gene count data were quantile normalized and log2 transformed. For each gene, the difference in expression between the control and abemaciclib-treated in each cell line was estimated using linear regression model. The Bonferroni correction p value of 2.43E-06 was used to determine differential expression. Genes presented are split into 4 groups depicted by colored bar, Blue: E2F target genes showing cell cycle changes; orange: DNMT group; purple: interferon-stimulated genes; green: HLA genes. C, Interferon α, β, γ, and λ levels were assessed in the conditioned media of ES cells treated for 14 days with 500 nM or 1 μM abemaciclib. Changes in IFN-λ (left) and IFN-β (29) levels are shown. IFN-α and IFN-γ were not detected in any samples. Dotted line represents lowest IFN concentration of standard curve. n = 3, 2-way ANOVA analysis, *** p < 0.001, **** p < 0.0001. D, A673 cells were treated continually for 14 days with abemaciclib or abemaciclib was washed out 4, 3, 2, and 1 day prior to fixation. (Top left) %POSITIVE MHC-1 is mean of 4 technical replicates ± SEM. (Top right) Images show representative fields taken at 20X magnification for the indicated timepoint. Post: days post-washout. Blue: nuclei; yellow: MHC-1. (Bottom) ES cell lines were treated continually for 14 days with abemaciclib or abemaciclib was washed out 96, 72 48, or 24 h prior to harvest and replaced with growth media. On day 14 cells were lysed and indicated proteins were analyzed by immunoblot.
Figure 5.
Figure 5.. Abemaciclib has single agent activity in the xenograft model RD-ES giving a stable disease response for duration of treatment.
Mice bearing RD-ES xenografts were treated orally with 50 mg/kg abemaciclib (■) or vehicle (●) daily. A, Tumor growth over time. Dotted lines indicate dosing interval. Mean ± SEM is displayed, n = 3/group. B and C, Xenografts were harvested after 10 days of treatment. B, IHC analysis for cell death (TUNEL), cell proliferation (Ki67), and cell number (DNA content). Bar graphs under each set of representative images quantify staining for each endpoint, n = 8 fields/group. One-way ANOVA with Dunnett’s comparison. C, Analysis of protein expression by immunoblotting. Protein levels were quantitated using the Chemidoc XRS software (BioRad). Reported values are normalized to G PDH (n = 8/group). Error bars: SEM. Paired Student’s t-test; *: p < 0.05; **: p < 0.01; ***: p < 0.001; ****: p < 0.0001.
Figure 6.
Figure 6.. Abemaciclib plus chemotherapy demonstrates additive effects of stable disease and tumor regression in preclinical models of ES.
A, Animals bearing CTG-0142 PDX were given vehicle, abemaciclib (daily), doxorubicin (once weekly), or the combination for 28 days (n = 3/group). Dotted line marks end of dosing schedule. Additional mice (3/arm) were added to each cohort and xenografts were harvested after 10 days of treatment (x) and interrogated for expression of DNMT1 and topoisomerase IIα and phopshorylation of RB. B, Waterfall plot of CTG-0142 PDX study at day 28. C, Mice with A673 tumors were treated with vehicle, abemaciclib (daily), temozolomide (TMZ) and irinotecan (once daily for 5 days, rest for 16 days), or the combination (n = 5/group). Dotted line represents end of dosing schedule. D, Waterfall plot of A673 CDX study at day 31. Error bars: SEM. Blue bars: progressive disease (PD, ≥10%); red bars: stable disease (SD, −50% to 10%); green bars: partial response (PR, ≤−50% and >14 mm3).

Similar articles

Cited by

References

    1. Cesari M, Righi A, Cevolani L, Palmerini E, Vanel D, Donati DM, et al. Ewing sarcoma in patients over 40 years of age: a prospective analysis of 31 patients treated at a single institution. Tumori 2016;102:481–7 - PubMed
    1. Leavey PJ, Mascarenhas L, Marina N, Chen Z, Krailo M, Miser J, et al. Prognostic factors for patients with Ewing sarcoma (EWS) at first recurrence following multi-modality therapy: A report from the Children’s Oncology Group. Pediatr Blood Cancer 2008;51:334–8 - PMC - PubMed
    1. Esiashvili N, Goodman M, Marcus RB, Jr. Changes in incidence and survival of Ewing sarcoma patients over the past 3 decades: Surveillance Epidemiology and End Results data. J Pediatr Hematol Oncol 2008;30:425–30 - PubMed
    1. McTiernan AM, Cassoni AM, Driver D, Michelagnoli MP, Kilby AM, Whelan JS. Improving Outcomes After Relapse in Ewing’s Sarcoma: Analysis of 114 Patients From a Single Institution. Sarcoma 2006;2006:83548. - PMC - PubMed
    1. Rainusso N, Wang LL, Yustein JT. The adolescent and young adult with cancer: state of the art -- bone tumors. Curr Oncol Rep 2013;15:296–307 - PubMed

Publication types

MeSH terms