. 2018 Aug 21;9(1):3347.
doi: 10.1038/s41467-018-05864-4.

A low-cost paper-based synthetic biology platform for analyzing gut microbiota and host biomarkers

Affiliations

A low-cost paper-based synthetic biology platform for analyzing gut microbiota and host biomarkers

Melissa K Takahashi et al. Nat Commun. .

Abstract

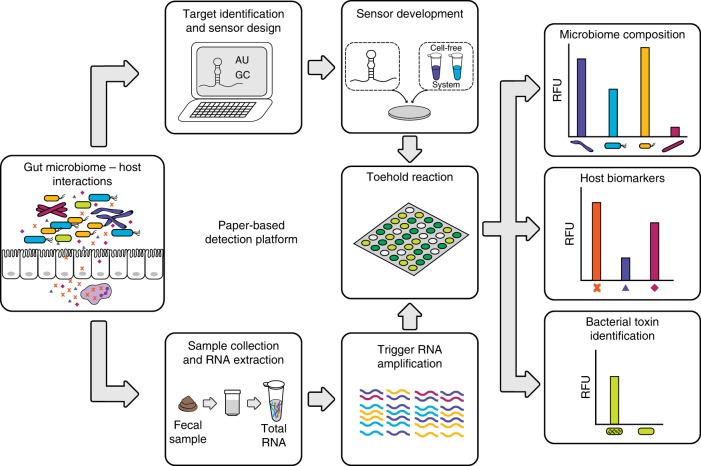
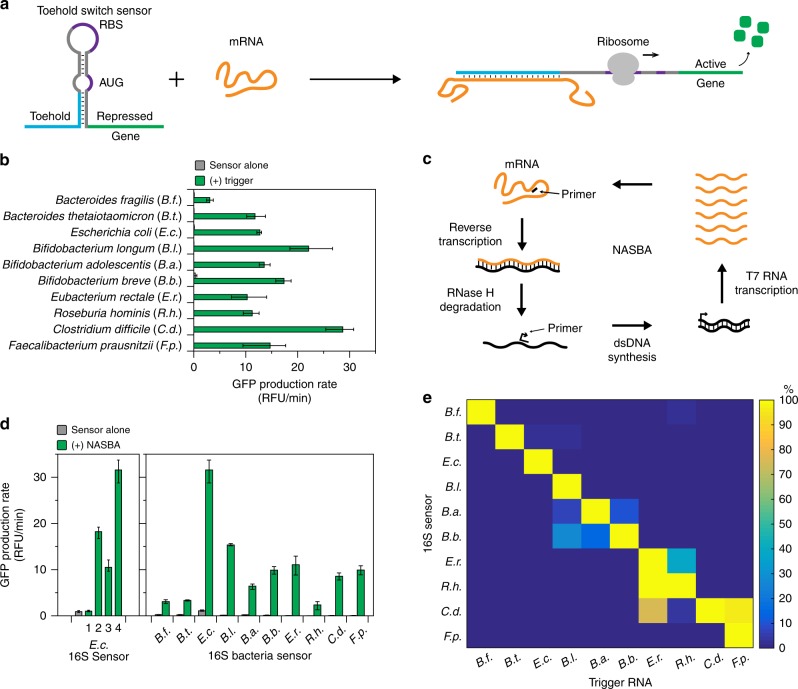
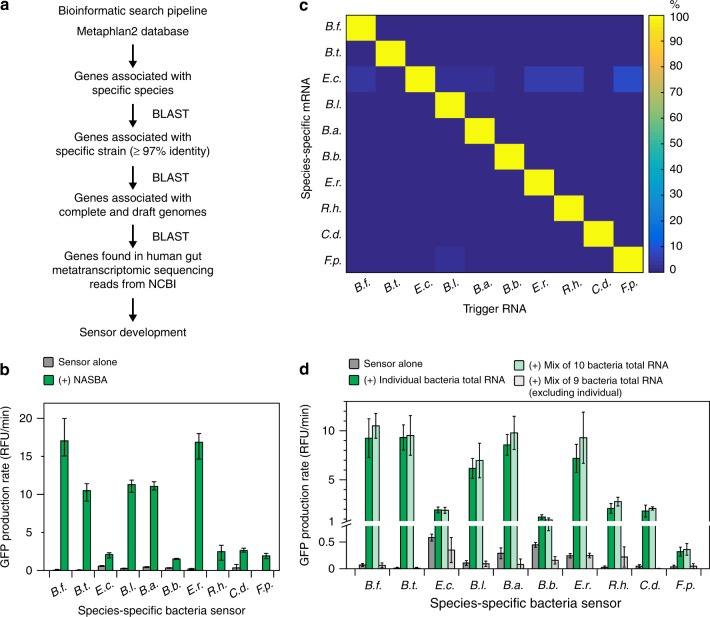
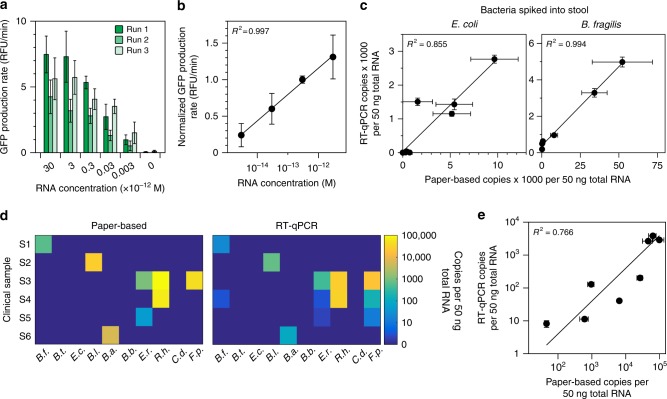
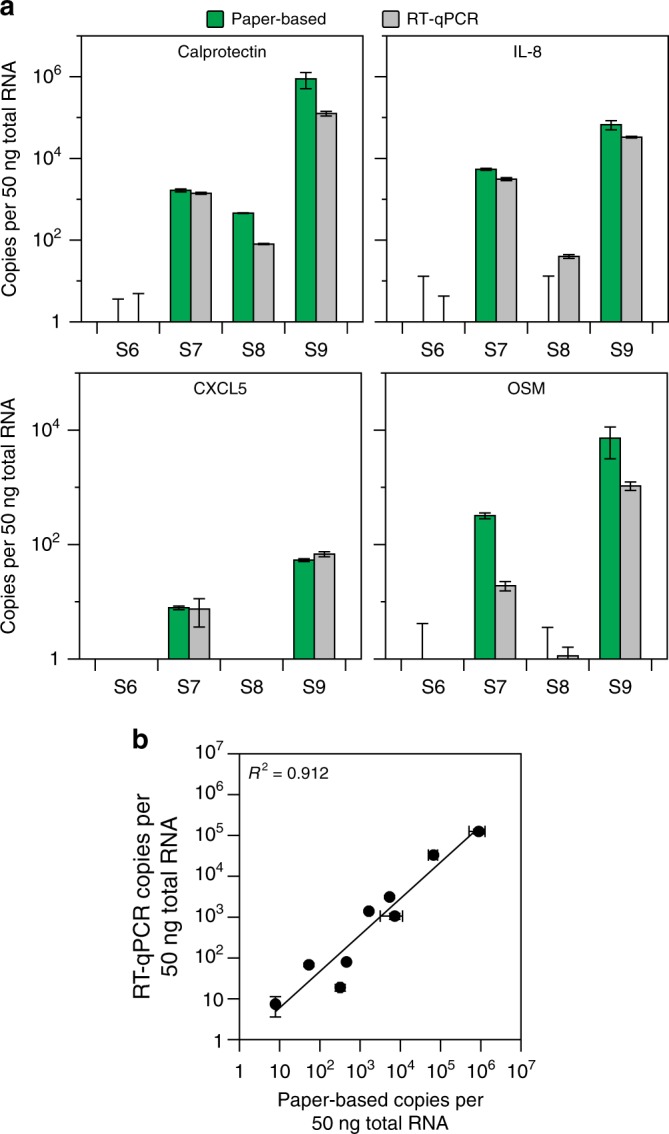
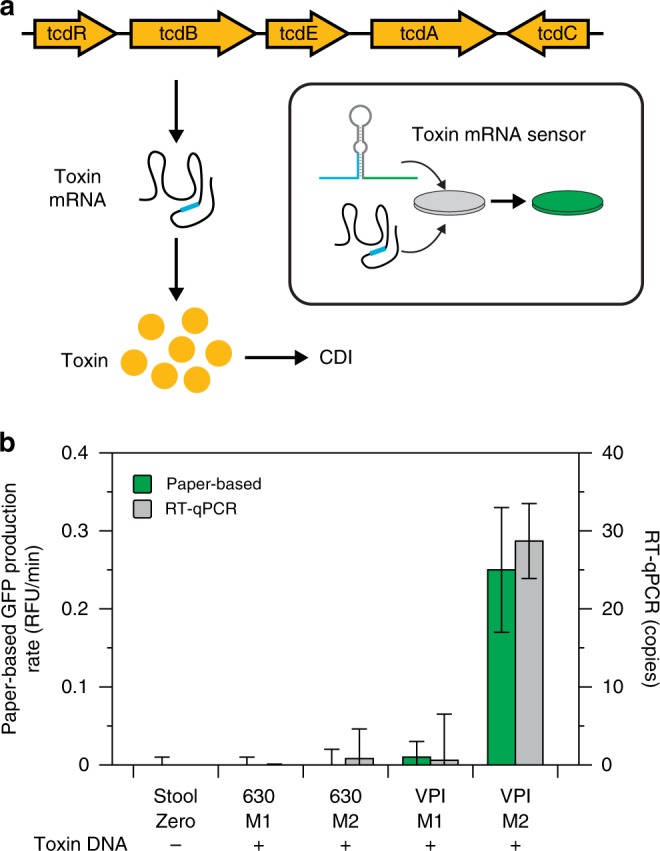
There is a need for large-scale, longitudinal studies to determine the mechanisms by which the gut microbiome and its interactions with the host affect human health and disease. Current methods for profiling the microbiome typically utilize next-generation sequencing applications that are expensive, slow, and complex. Here, we present a synthetic biology platform for affordable, on-demand, and simple analysis of microbiome samples using RNA toehold switch sensors in paper-based, cell-free reactions. We demonstrate species-specific detection of mRNAs from 10 different bacteria that affect human health and four clinically relevant host biomarkers. We develop a method to quantify mRNA using our toehold sensors and validate our platform on clinical stool samples by comparison to RT-qPCR. We further highlight the potential clinical utility of the platform by showing that it can be used to rapidly and inexpensively detect toxin mRNA in the diagnosis of Clostridium difficile infections.


Conflict of interest statement

J.J.C. is an author on a patent application for the paper-based synthetic gene networks US20160312312A1 and a patent for the RNA toehold switch sensors US9550987B2. The remaining authors declare no competing interests.

Figures

Fig. 1
Fig. 1
Workflow for analysis of microbiome samples using our paper-based detection platform. Once key bacteria or mRNA targets have been identified, RNA toehold switch sensors and primers for isothermal RNA amplification are designed in silico. Sensors and primers are then rapidly assembled and validated in paper-based reactions. For subsequent use, total RNA is extracted from human fecal samples using a commercially available kit. Specific RNAs are amplified via NASBA (nucleic acid sequence based amplification) and quantified using arrays of toehold switch sensors in paper-based reactions. Microbial and host biomarker RNA concentrations of the samples are determined using a simple calibration curve
Fig. 2
Fig. 2
16S rRNA sensors. a Schematic of toehold switch sensor function. b Best performing toehold switch sensors targeting the V3 hypervariable region of 16S rRNA for each species. Data represent mean GFP production rates from paper-based reactions with sensor alone and sensor plus 36-nucleotide trigger RNA (2 μM). Error bars represent high and low values from three technical replicates. c Schematic of NASBA-mediated RNA amplification. d Evaluation of NASBA primers. NASBA reactions were performed on 1 ng of total RNA for 90 min. Outputs from NASBA reactions were used to activate toehold switch sensors in paper-based reactions. Data represent mean values of three technical replicates. Error bars represent high and low values of the three replicates. e Orthogonality of 16S sensors. Each sensor was challenged with 2 μM of NASBA trigger RNAs from each species representing what would be amplified in a NASBA reaction. GFP production rates for an individual sensor were normalized to the production rate of the sensor plus its cognate trigger (100%). Data represent mean values of six replicates (two biological replicates × three technical replicates). Full data and s.d. are shown in Supplementary Figure 3
Fig. 3
Fig. 3
Species-specific mRNA sensors. a Bioinformatic pipeline for identifying species-specific mRNAs. b Best performing NASBA primers and species-specific mRNA sensors for each species. NASBA reactions were performed on 10 ng of total RNA for 90 min. Outputs from NASBA reactions were used to activate toehold switch sensors in paper-based reactions. Data represent mean values of three technical replicates. Error bars represent high and low values of the three replicates. c Orthogonality of species-specific sensors. Each sensor was challenged with 2 μM of trigger RNAs from each species representing what would be amplified in a NASBA reaction. GFP production rates for an individual sensor were normalized to the production rate of the sensor plus its cognate trigger (100%). Data represent mean values of six replicates (two biological replicates × three technical replicates). Full data and s.d. are shown in Supplementary Figure 6. d Orthogonality of NASBA primer sets. NASBA reactions were performed on 10 ng of total RNA for 90 min. Data represent mean ± s.d. of six replicates (two biological replicates (NASBA reactions) × three technical replicates (paper-based reactions))
Fig. 4
Fig. 4
Quantification of NASBA-mediated amplification using toehold switch sensors. a Run-to-run variation in mRNA standards amplified by NASBA and measured by toehold sensors. mRNA standards for the B. thetaiotaomicron species-specific sensor were run in NASBA reactions for 30 min. Outputs from NASBA reactions were used to activate toehold switch sensors in paper-based reactions. b Calibration curve for the B.t. species-specific mRNA. Values from each standard in the individual runs in a were normalized to the 300 fM standard for that specific run and averaged across runs. c Quantifying species-specific mRNAs in stool. E. coli or B. fragilis cells were spiked into 150 mg of a commercial stool sample and processed for total RNA. Species-specific mRNAs were quantified using our paper-based platform and RT-qPCR. d Analysis of clinical stool samples. Six clinical stool samples were processed for total RNA and analyzed by our paper-based platform and RT-qPCR. Data and s.d. are shown in Supplementary Figure 11. e Correlation of clinical sample results. Non-zero paper-based concentrations from d were compared to RT-qPCR determined values. Data represent mean values. Paper-based error bars in a, c, and e represent s.d. from nine replicates (three biological replicates (NASBA reactions) × three technical replicates (paper-based reactions)). RT-qPCR error bars in c and e represent s.d. from six replicates (two biological replicates (RT reactions) × three technical replicates (qPCR reactions))
Fig. 5
Fig. 5
Detection of host biomarkers of inflammation. a Analysis of clinical stool samples. Four clinical stool samples were processed for total RNA and analyzed by our paper-based platform and RT-qPCR. Data represent mean values. Paper-based error bars represent s.d. from nine replicates (three biological replicates (NASBA reactions) × three technical replicates (paper-based reactions)). RT-qPCR error bars represent s.d. from six replicates (two biological replicates (RT reactions) × three technical replicates (qPCR reactions)). b Correlation of clinical sample results. Non-zero paper-based concentrations from a were compared to RT-qPCR determined values
Fig. 6
Fig. 6
Paper-based detection of C. difficile infection. a Schematic of RNA-based CDI detection using a toehold switch sensor to detect toxin B mRNA. b Toxin B mRNA detection in stool samples. Two C. difficile strains (630 and VPI 10463) were grown in two different media (M1—TYG plus cysteine, M2—TY). Cells from each culture were spiked into 150 mg of a commercial stool sample and processed for total RNA. Toxin B mRNA was measured by our paper-based platform and RT-qPCR. Data represent mean values. Paper-based error bars represent s.d. from nine replicates (three biological replicates (NASBA reactions) × three technical replicates (paper-based reactions)). RT-qPCR error bars represent s.d. from six replicates (two biological replicates (RT reactions) × three technical replicates (qPCR reactions)). Toxin B DNA was confirmed in each sample using qPCR (Cq values shown in Supplementary Table 11)

Similar articles

Cited by

References

    1. Rooks MG, Garrett WS. Gut microbiota, metabolites and host immunity. Nat. Rev. Immunol. 2016;16:341–352. doi: 10.1038/nri.2016.42. - DOI - PMC - PubMed
    1. Pfeiffer JK, Virgin HW. Transkingdom control of viral infection and immunity in the mammalian intestine. Science. 2016;351:aad5872. doi: 10.1126/science.aad5872. - DOI - PMC - PubMed
    1. van Nood E, et al. Duodenal infusion of donor feces for recurrent Clostridium difficile. N. Engl. J. Med. 2013;368:407–415. doi: 10.1056/NEJMoa1205037. - DOI - PubMed
    1. Koeth RA, et al. Intestinal microbiota metabolism of l-carnitine, a nutrient in red meat, promotes atherosclerosis. Nat. Med. 2013;19:576–585. doi: 10.1038/nm.3145. - DOI - PMC - PubMed
    1. Haiser HJ, et al. Predicting and manipulating cardiac drug inactivation by the human gut bacterium Eggerthella lenta. Science. 2013;341:295–298. doi: 10.1126/science.1235872. - DOI - PMC - PubMed

Publication types