Comparative Study
. 2018 Aug 21;8(1):12516.
doi: 10.1038/s41598-018-31007-2.

Prediction of Pseudoprogression versus Progression using Machine Learning Algorithm in Glioblastoma

Affiliations
Comparative Study

Prediction of Pseudoprogression versus Progression using Machine Learning Algorithm in Glioblastoma

Bum-Sup Jang et al. Sci Rep. .

Abstract

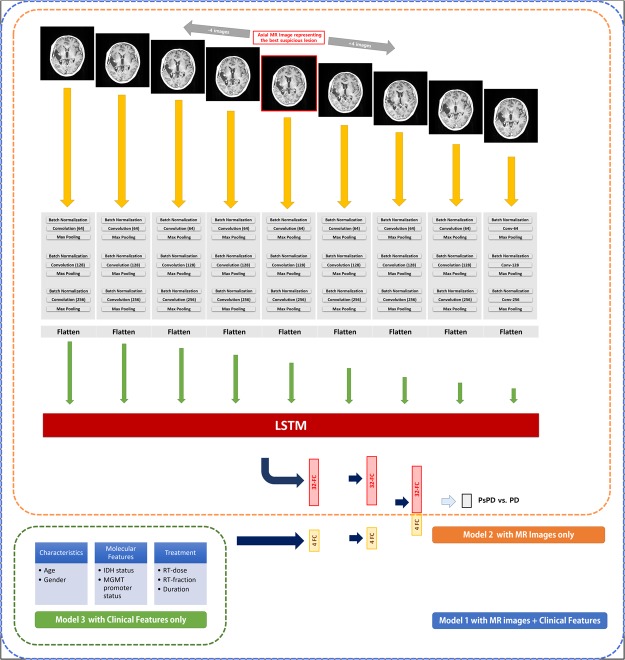
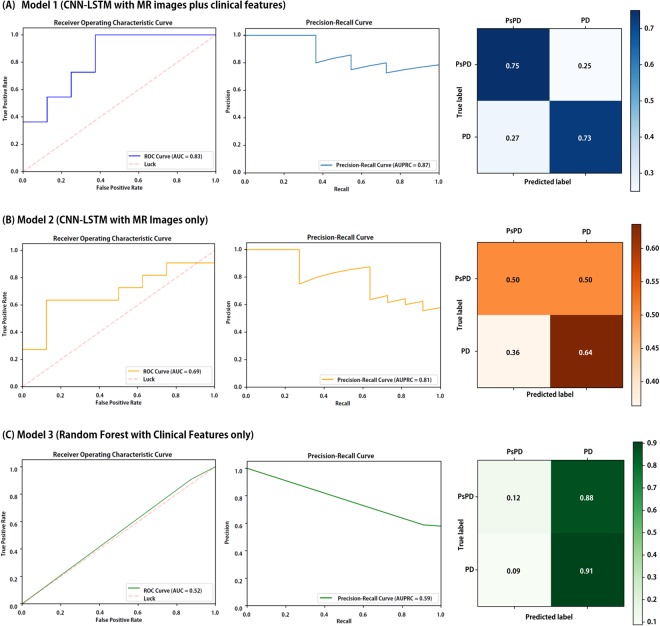
We aimed to investigate the feasibility of machine learning (ML) algorithm to distinguish pseudoprogression (PsPD) from progression (PD) in patients with glioblastoma (GBM). We recruited the patients diagnosed as primary GBM who received gross total resection (GTR) and concurrent chemoradiotherapy in two institutions from April 2010 to April 2017 and presented suspicious contrast-enhanced lesion on brain magnetic resonance imaging (MRI) during follow-up. Patients from two institutions were allocated to training (N = 59) and testing (N = 19) datasets, respectively. We developed a convolutional neural network combined with a long short-term memory ML structure. MRI data, which was 9 axial post-contrast T1-weighted images in our study, and clinical features were incorporated (Model 1). In the testing set, the trained Model 1 resulted in AUC of 0.83, AUPRC of 0.87, and F1-score of 0.74 using optimal threshold. The performance was superior to that of Model 2 (CNN-LSTM model with MRI data alone) and Model 3 (random forest model with clinical feature alone). The developed algorithm involving MRI data and clinical features could help making decision during follow-up of patients with GBM treated with GTR and concurrent CCRT.


Conflict of interest statement

The authors declare no competing interests.

Figures

Figure 1
Figure 1
Schematic representation of the structures of the three models. In Model 1 (blue), selected 9 axial MR images were passed through CNN-LSTM, and clinical features were passed into two FCs with four nodes. In Model 2 (orange), only selected 9 axial MR images passed were passed through CNN-LSTM. In Model 3 (green), random forest model using only clinical factors were used. The output is a probability corresponding to PsPD or PD. The number in parentheses in ‘Convolution’ layer means the number of filters made by 2 × 2 pixels kernel. Abbreviations: LSTM, long short-term memory; ML, machine learning; FC, fully-connected layer; PD, progressive disease; PsPD, pseudoprogression; MGMT, O6-methylguanine-DNA-methyltransferase; IDH, isocitrate dehydrogenase.
Figure 2
Figure 2
Parameter tuning process. In the training set (N = 59), 20 percent was separated into validation sets. (A) Tracing plot representing both train (blue lines) and validation loss (orange lines) through five iterations when learning rate was 0.001, the number of memory cells in LSTM was 24, and batch size was 7. Box and whisker plots depict statistics collected from 5-fold validation, comparing AUC values when (B) memory cell size of LSTM was 18, 20, 22, or 24 (C) batch size was 6, 7, 8 or 9, and (D) learning rate was 0.0001, 0.001, 0.01 and 0.1.
Figure 3
Figure 3
Receiver operating characteristic (ROC) and precision-recall curves from 10-fold internal validation in the training set (N = 59). Area under the ROC curve (AUC) and area under the precision-recall curve (AUPRC) values were also estimated in each fold and represented in graphs. Abbreviations: AUC, area under the curve of ROC curve; AUPRC, area under the precision-recall curve.
Figure 4
Figure 4
Summarized testing results comparing finalized (A) Model 1, (B) Model 2, and (C) Model 3 in the testing set (N = 19). Receiver operating characteristic curves (left) and precision-recall curves (middle) were depicted and area under the ROC curve (AUC) and area under the precision-recall curve (AUPRC) values were estimated. Normalized confusion matrix (right) also derived. The diagonal number denotes the normalized number of cases where the predicted label is equal to true label. Abbreviations: PD, progression; PsPD, pseudoprogression; AUC, area under the curve of ROC curve; AUPRC, area under the precision-recall curve.

References

    1. Stupp R, et al. Radiotherapy plus concomitant and adjuvant temozolomide for glioblastoma. New England Journal of Medicine. 2005;352:987–996. doi: 10.1056/NEJMoa043330. - DOI - PubMed
    1. Brandsma D, Stalpers L, Taal W, Sminia P, van den Bent MJ. Clinical features, mechanisms, and management of pseudoprogression in malignant gliomas. The lancet oncology. 2008;9:453–461. doi: 10.1016/S1470-2045(08)70125-6. - DOI - PubMed
    1. Topkan E, Topuk S, Oymak E, Parlak C, Pehlivan B. Pseudoprogression in patients with glioblastoma multiforme after concurrent radiotherapy and temozolomide. American journal of clinical oncology. 2012;35:284–289. doi: 10.1097/COC.0b013e318210f54a. - DOI - PubMed
    1. Chu HH, et al. Differentiation of true progression from pseudoprogression in glioblastoma treated with radiation therapy and concomitant temozolomide: comparison study of standard and high-b-value diffusion-weighted imaging. Radiology. 2013;269:831–840. doi: 10.1148/radiol.13122024. - DOI - PubMed
    1. Park JE, Kim HS, Goh MJ, Kim SJ, Kim JH. Pseudoprogression in patients with glioblastoma: assessment by using volume-weighted voxel-based multiparametric clustering of MR imaging data in an independent test set. Radiology. 2015;275:792–802. doi: 10.1148/radiol.14141414. - DOI - PubMed

Publication types

LinkOut - more resources