

Identification of Rapeseed (Brassica napus) Cultivars With a High Tolerance to Boron-Deficient Conditions
- PMID: 30131820
- PMCID: PMC6091279
- DOI: 10.3389/fpls.2018.01142
Identification of Rapeseed (Brassica napus) Cultivars With a High Tolerance to Boron-Deficient Conditions
Abstract
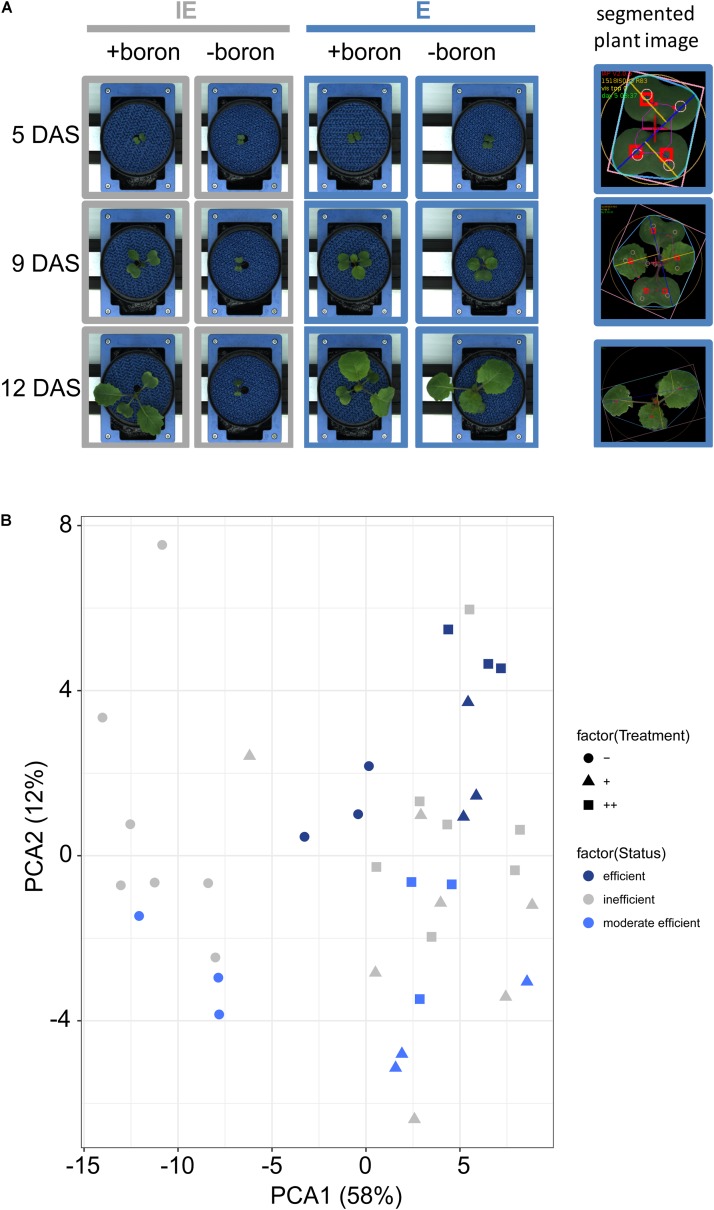
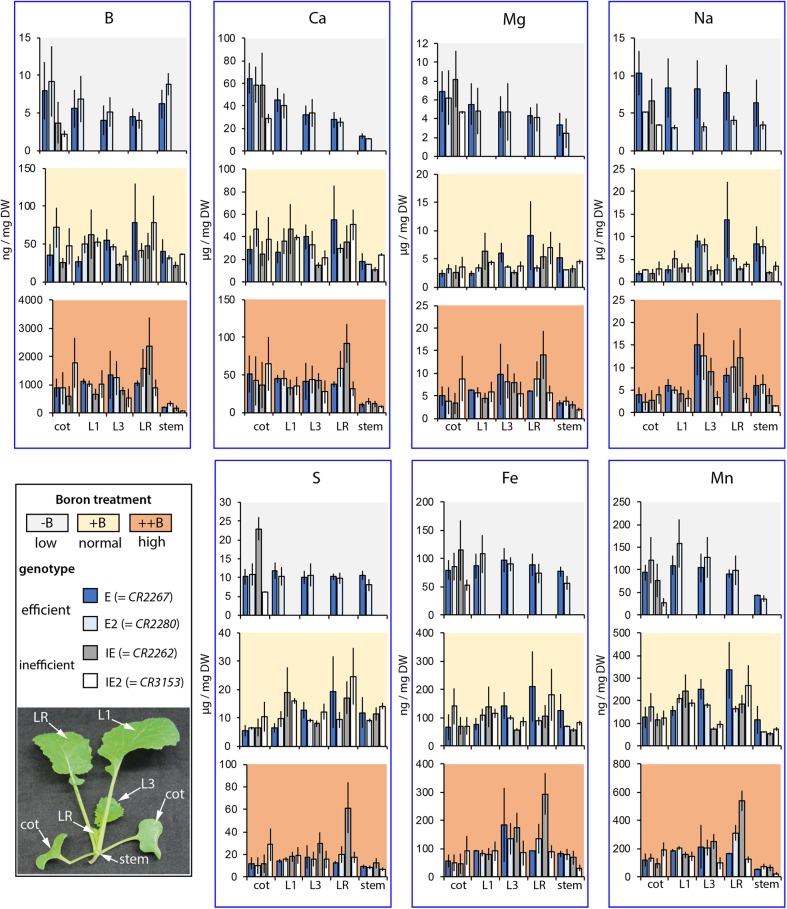
Boron (B) is an essential micronutrient for seed plants. Information on B-efficiency mechanisms and B-efficient crop and model plant genotypes is very scarce. Studies evaluating the basis and consequences of B-deficiency and B-efficiency are limited by the facts that B occurs as a trace contaminant essentially everywhere, its bioavailability is difficult to control and soil-based B-deficiency growth systems allowing a high-throughput screening of plant populations have hitherto been lacking. The crop plant Brassica napus shows a very high sensitivity toward B-deficient conditions. To reduce B-deficiency-caused yield losses in a sustainable manner, the identification of B-efficient B. napus genotypes is indispensable. We developed a soil substrate-based cultivation system which is suitable to study plant growth in automated high-throughput phenotyping facilities under defined and repeatable soil B conditions. In a comprehensive screening, using this system with soil B concentrations below 0.1 mg B (kg soil)-1, we identified three highly B-deficiency tolerant B. napus cultivars (CR2267, CR2280, and CR2285) among a genetically diverse collection comprising 590 accessions from all over the world. The B-efficiency classification of cultivars was based on a detailed assessment of various physical and high-throughput imaging-based shoot and root growth parameters in soil substrate or in in vitro conditions, respectively. We identified cultivar-specific patterns of B-deficiency-responsive growth dynamics. Elemental analysis revealed striking differences only in B contents between contrasting genotypes when grown under B-deficient but not under standard conditions. Results indicate that B-deficiency tolerant cultivars can grow with a very limited amount of B which is clearly below previously described critical B-tissue concentration values. These results suggest a higher B utilization efficiency of CR2267, CR2280, and CR2285 which would represent a unique trait among so far identified B-efficient B. napus cultivars which are characterized by a higher B-uptake capacity. Testing various other nutrient deficiency treatments, we demonstrated that the tolerance is specific for B-deficient conditions and is not conferred by a general growth vigor at the seedling stage. The identified B-deficiency tolerant cultivars will serve as genetic and physiological "tools" to further understand the mechanisms regulating the B nutritional status in rapeseed and to develop B-efficient elite genotypes.
Keywords: Brassica napus; boron; boron deficiency tolerance; boron efficiency; phenotyping; rapeseed.
Figures
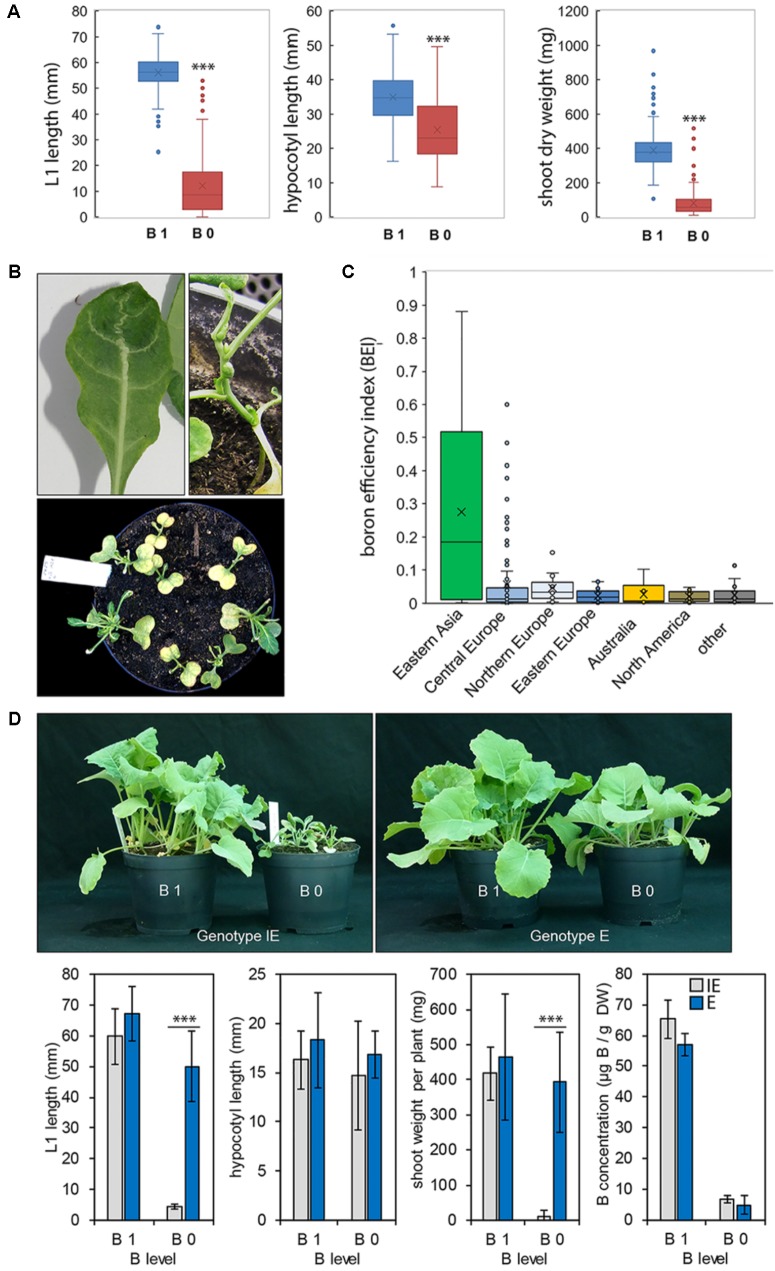
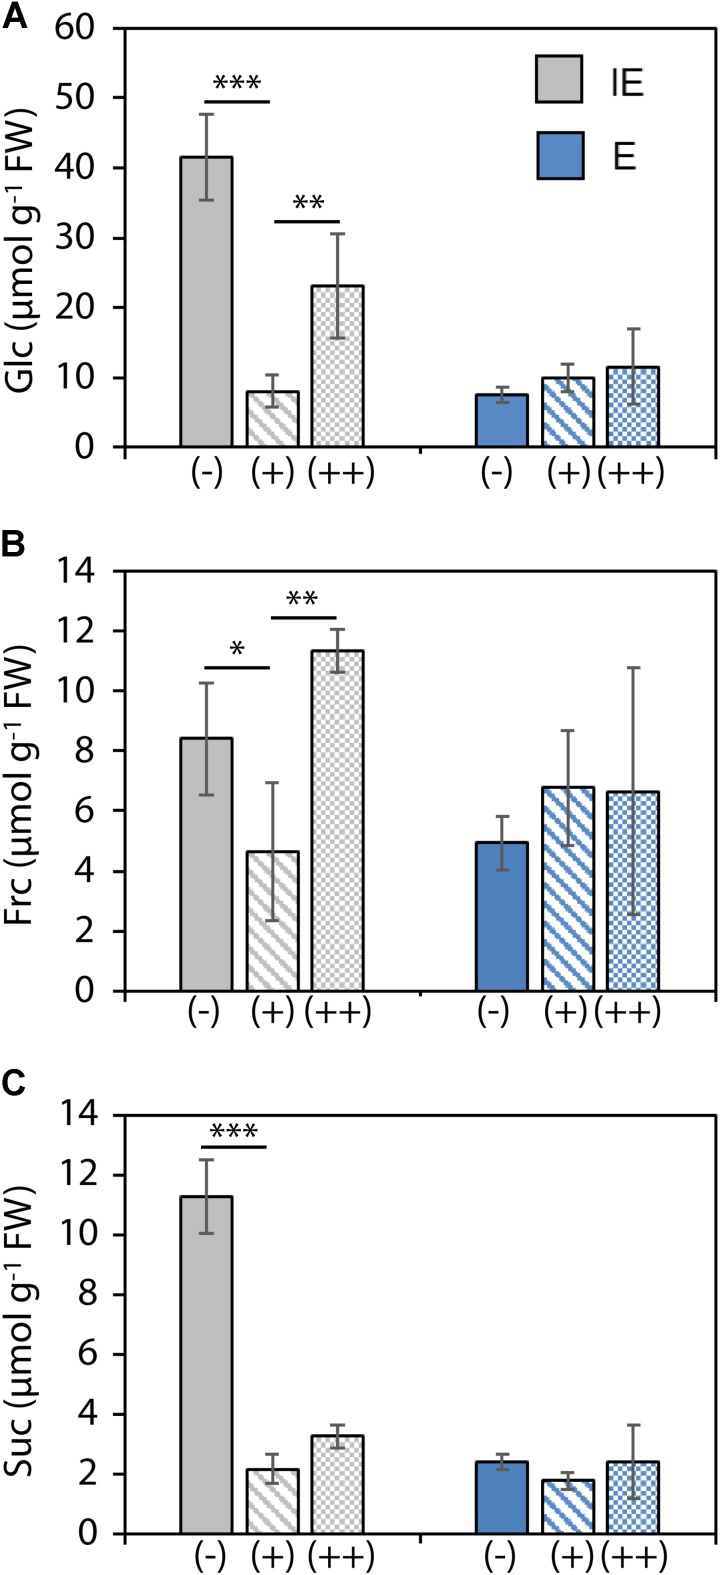
 = B-deficient (-),
  = B-sufficient (+) or
  = B-surplus (++) conditions].
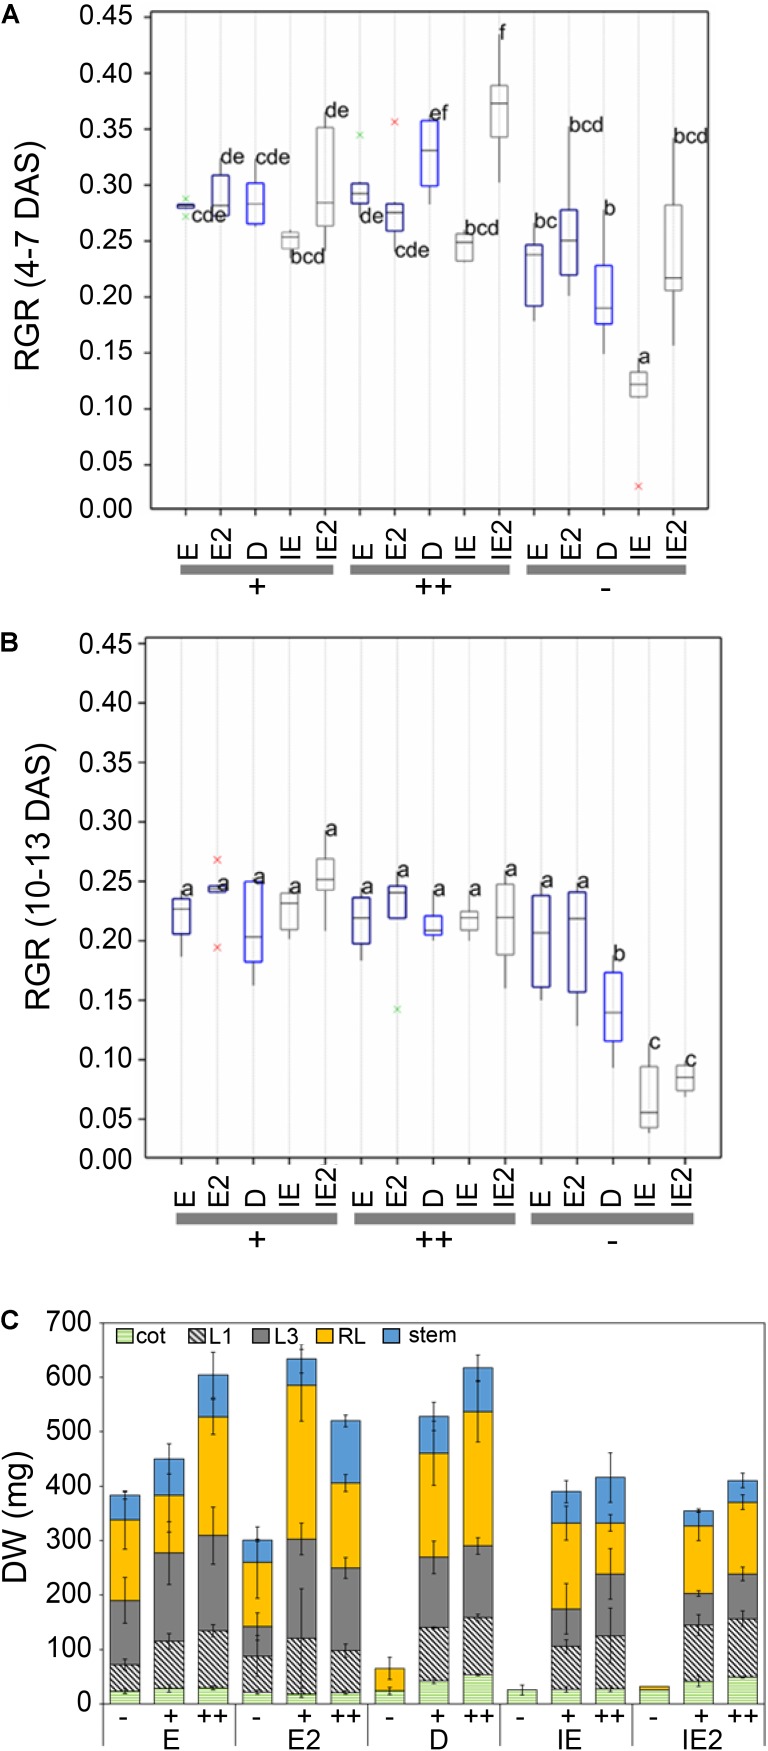
Similar articles
-
Genotypic differences in the synergistic effect of nitrogen and boron on the seed yield and nitrogen use efficiency of Brassica napus.J Sci Food Agric. 2022 Jul;102(9):3563-3571. doi: 10.1002/jsfa.11700. Epub 2021 Dec 13. J Sci Food Agric. 2022. PMID: 34854085
-
Bridging Molecular Insights and Agronomic Innovations: Cutting-Edge Strategies for Overcoming Boron Deficiency in Sustainable Rapeseed Cultivation.Plants (Basel). 2025 Mar 21;14(7):995. doi: 10.3390/plants14070995. Plants (Basel). 2025. PMID: 40219062 Free PMC article. Review.
-
Cytokinins as boron deficiency signals to sustain shoot development in boron-efficient oilseed rape.Physiol Plant. 2022 Sep;174(5):e13776. doi: 10.1111/ppl.13776. Physiol Plant. 2022. PMID: 36066313
-
Genetic variation of BnaA3.NIP5;1 expressing in the lateral root cap contributes to boron deficiency tolerance in Brassica napus.PLoS Genet. 2021 Jul 1;17(7):e1009661. doi: 10.1371/journal.pgen.1009661. eCollection 2021 Jul. PLoS Genet. 2021. PMID: 34197459 Free PMC article.
-
Boron deficiency in woody plants: various responses and tolerance mechanisms.Front Plant Sci. 2015 Oct 27;6:916. doi: 10.3389/fpls.2015.00916. eCollection 2015. Front Plant Sci. 2015. PMID: 26579163 Free PMC article. Review.
Cited by
-
K Deprivation Modulates the Primary Metabolites and Increases Putrescine Concentration in Brassica napus.Front Plant Sci. 2021 Aug 13;12:681895. doi: 10.3389/fpls.2021.681895. eCollection 2021. Front Plant Sci. 2021. PMID: 34484256 Free PMC article.
-
Phytochemical responses of camelina to brassinolide and boron foliar spray under irrigation regimes.Heliyon. 2025 Feb 11;11(4):e42630. doi: 10.1016/j.heliyon.2025.e42630. eCollection 2025 Feb 28. Heliyon. 2025. PMID: 40084035 Free PMC article.
-
Elucidating the Possible Involvement of Maize Aquaporins in the Plant Boron Transport and Homeostasis Mediated by Rhizophagus irregularis under Drought Stress Conditions.Int J Mol Sci. 2020 Mar 4;21(5):1748. doi: 10.3390/ijms21051748. Int J Mol Sci. 2020. PMID: 32143345 Free PMC article.
-
Effect of boron deficiency on the photosynthetic performance of sugar beet cultivars with contrasting boron efficiencies.Front Plant Sci. 2023 Jan 16;13:1101171. doi: 10.3389/fpls.2022.1101171. eCollection 2022. Front Plant Sci. 2023. PMID: 36726677 Free PMC article.
-
Strong temporal dynamics of QTL action on plant growth progression revealed through high-throughput phenotyping in canola.Plant Biotechnol J. 2020 Jan;18(1):68-82. doi: 10.1111/pbi.13171. Epub 2019 Jun 12. Plant Biotechnol J. 2020. PMID: 31125482 Free PMC article.
References
-
- Asad A., Bell R. W., Dell B., Huang L. (1997). Development of a boron buffered solution culture system for controlled studies of plant boron nutrition. Plant Soil 188 21–32. 10.1023/A:1004291225723 - DOI
-
- Bergmann W. (1992). Nutritional Disorders of Plants. Jena: Gustav Fischer Verlag.
LinkOut - more resources
Full Text Sources
Other Literature Sources