. 2018 Aug 6:9:296.
doi: 10.3389/fgene.2018.00296. eCollection 2018.

Spindle Dynamics Model Explains Chromosome Loss Rates in Yeast Polyploid Cells

Affiliations

Spindle Dynamics Model Explains Chromosome Loss Rates in Yeast Polyploid Cells

Ivan Jelenić et al. Front Genet. .

Abstract

Faithful chromosome segregation, driven by the mitotic spindle, is essential for organismal survival. Neopolyploid cells from diverse species exhibit a significant increase in mitotic errors relative to their diploid progenitors, resulting in chromosome nondisjunction. In the model system Saccharomyces cerevisiae, the rate of chromosome loss in haploid and diploid cells is measured to be one thousand times lower than the rate of loss in isogenic tetraploid cells. Currently it is unknown what constrains the number of chromosomes that can be segregated with high fidelity in an organism. Here we developed a simple mathematical model to study how different rates of chromosome loss in cells with different ploidy can arise from changes in (1) spindle dynamics and (2) a maximum duration of mitotic arrest, after which cells enter anaphase. We apply this model to S. cerevisiae to show that this model can explain the observed rates of chromosome loss in S. cerevisiae cells of different ploidy. Our model describes how small increases in spindle assembly time can result in dramatic differences in the rate of chromosomes loss between cells of increasing ploidy and predicts the maximum duration of mitotic arrest.

Keywords: cell cycle regulation; chromosome loss; chromosome segregation; genome instability; polyploidy; spindle assembly; theoretical modeling.


Figures

Figure 1
Figure 1
Model for chromosome loss. (A) Spindle geometry in an individual cell. A microtubule (light blue) occupies a cross-section area S. Microtubules nucleate from M nucleation sites at the spindle pole body (gray bar) and extend toward KCs (dark blue) of a cross-section area SKC. (B) Spindle dynamics in mitosis. The different boxes indicate cells in prometaphase (purple box), metaphase (gray box) and anaphase (orange and blue box). Arrows denote the rate of transition between different populations. Within a cell, microtubules (blue lines) extend from the spindle pole bodies (gray bars) toward the KCs (dark blue circles). (C) Parameters used to solve the model. Five parameter values were taken from previous studies (O'Toole et al., ; Storchová et al., ; Gay et al., ; Gonen et al., ; Nannas et al., ; Vasileva et al., 2017), as indicated. (D) Solution of the model for cells with 1 chromosome (C = 1). Fraction of cells in prometaphase with no KCs attached (light purple, ρ0,0), with 1 KC attached (dark purple, ρ1,0 or ρ0,1), in metaphase (black, ρ1,1), in anaphase with at least one KC unattached (orange, ρL) and in anaphase (blue, ρA), are shown. Each line is accompanied by a cell cartoon depicting the corresponding phase of the cell cycle. At t = 0, ρ0,0 = 1 and all other populations are 0.
Figure 2
Figure 2
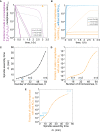
Model predictions for chromosome loss in cells of different ploidy. (A) Fraction of cells in prometaphase (purple) and metaphase (gray) for different numbers of chromosomes. The orange arrowhead denotes the value of the duration of mitotic arrest, t0. (B) Fraction of cells in anaphase with at least one KC unattached (orange) and in anaphase (blue). Three different shades in (A,B) correspond to different number of chromosomes, C = 16, 32, 64. For color-codes see inset legends. (C) Time of spindle assembly as a function of the number of chromosomes. (D) Rate of chromosome loss for cells as a function of the number of chromosomes. Arrowheads denote haploid, diploid and tetraploid number of chromosomes. (E) Rate of chromosome loss for cells as a function of the time of spindle assembly. Data points are obtained from (C,D), and correspond to C = 4, …, 64. Cases with C = 16, 32, 64 are shown in blue. At t = 0, ρ0,0 = 1 and all other populations are 0. The other parameters are given in Figure 1C.
Figure 3
Figure 3
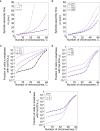
Time of spindle assembly and rate of chromosome loss for different number of chromosomes and different values of model parameters. (A) Time of spindle assembly for different number of chromosomes and three different values of α = 0.9, 1.0, 1.1. For color-codes see inset legend. The other parameters are given in Figure 1C. (B) The role of the cross-section area of the KC on the spindle assembly time. Three different shades correspond to different cross-section area of the KC, SKC = 7500 nm2, 10000 nm2, 12500 nm2. For color-codes see inset legend. The other parameters are given in Figure 1C. (C) Rate of chromosome loss for different functional forms of the function f(t): linear function f=(tc/t02)t, quadratic function f=(tc/t03)t2, cubic function f=(tc/t04)t3, and exponential function f = exp[(tt0)/tc]. For color-codes see inset legend. The other parameters are given in Figure 1C. (D) Rate of chromosome loss for different values of the parameter that describe the duration of mitotic arrest, t0. Three different shades correspond to different values of the parameter t0 = 150 min, 180 min, 210 min. For color-codes see inset legend. The other parameters are given in Figure 1C. (E) Rate of chromosome loss for different values of the characteristic timescale of mitotic arrest, tc. Three different shades correspond to different values of the parameter tc = 8 min, 10 min, 12 min. For color-codes see inset legend. The other parameters are given in Figure 1C.

References

    1. Akiyoshi B., Sarangapani K. K., Powers A. F., Nelson C. R., Reichow S. L., Arellano-Santoyo H., et al. . (2010). Tension directly stabilizes reconstituted kinetochore-microtubule attachments. Nature 468, 576–579. 10.1038/nature09594 - DOI - PMC - PubMed
    1. Comai L. (2005). The advantages and disadvantages of being polyploid. Nat. Rev. Genet. 6, 836–846. 10.1038/nrg1711 - DOI - PubMed
    1. Fujiwara T., Bandi M., Nitta M., Ivanova E. V., Bronson R. T., Pellman D. (2005). Cytokinesis failure generating tetraploids promotes tumorigenesis in p53-null cells. Nature 437, 1043–1047. 10.1038/nature04217 - DOI - PubMed
    1. Ganem N. J., Godinho S. A., Pellman D. (2009). A mechanism linking extra centrosomes to chromosomal instability. Nature 460, 278–282. 10.1038/nature08136 - DOI - PMC - PubMed
    1. Gardner M. K., Bouck D. C., Paliulis L. V., Meehl J. B., O'Toole E. T., Haase J., et al. . (2008). Chromosome congression by kinesin-5 motor-mediated disassembly of longer kinetochore microtubules. Cell 135, 894–906. 10.1016/j.cell.2008.09.046 - DOI - PMC - PubMed

LinkOut - more resources