. 2018 Nov;22(11):5244-5256.
doi: 10.1111/jcmm.13730. Epub 2018 Aug 21.

Role of retinal pigment epithelium-derived exosomes and autophagy in new blood vessel formation

Affiliations

Role of retinal pigment epithelium-derived exosomes and autophagy in new blood vessel formation

Sandra Atienzar-Aroca et al. J Cell Mol Med. 2018 Nov.

Abstract

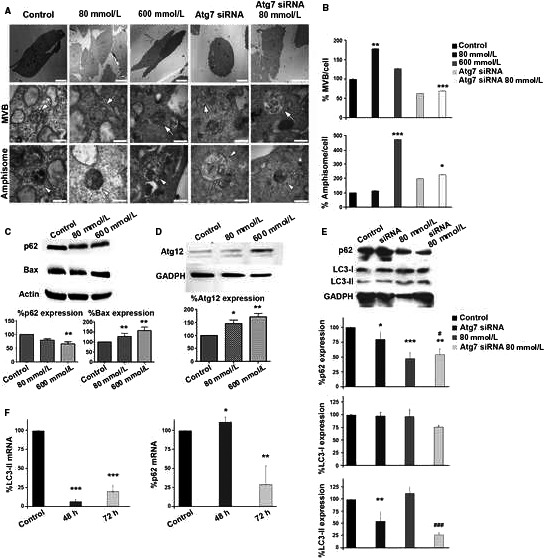
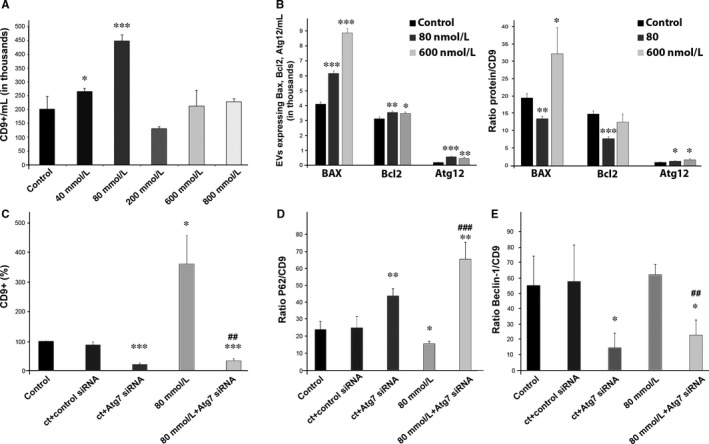
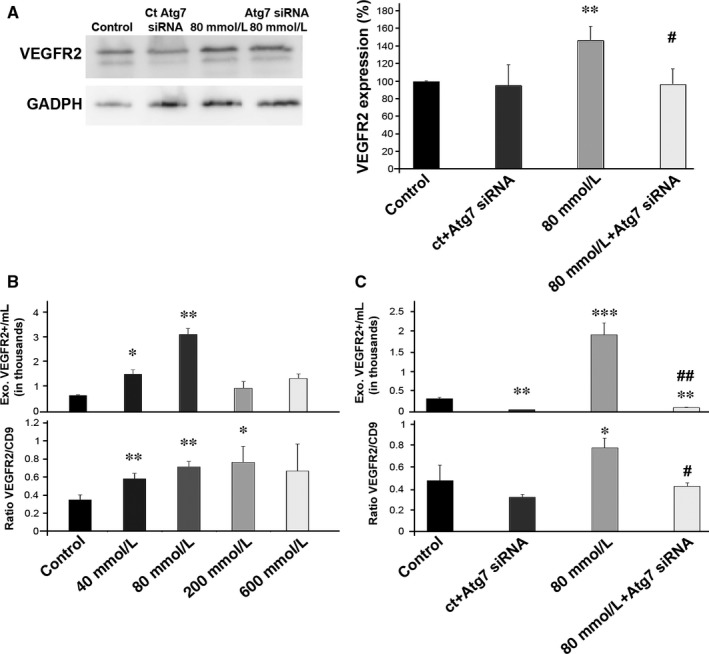
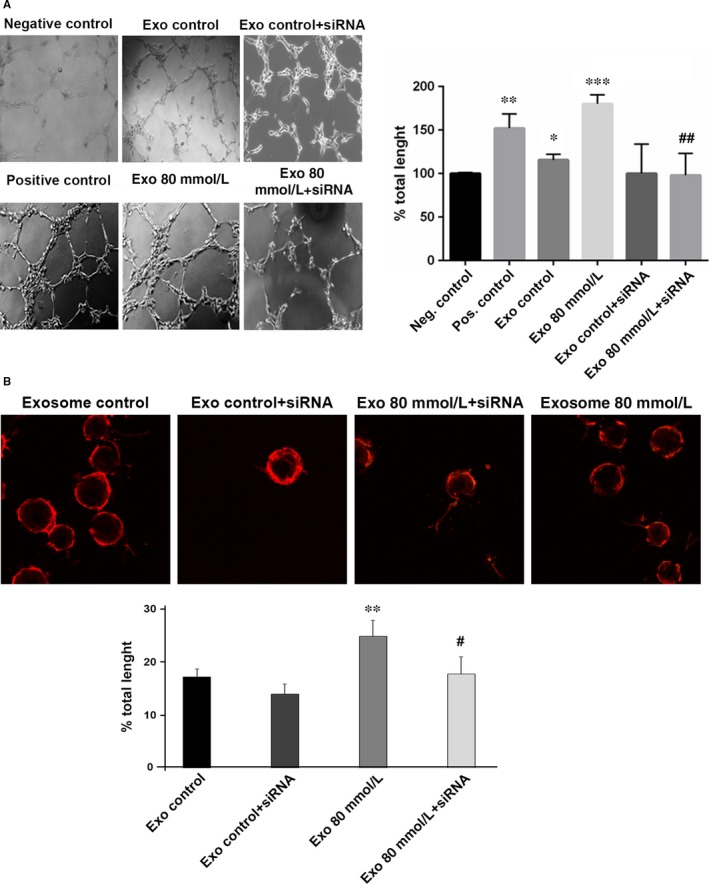
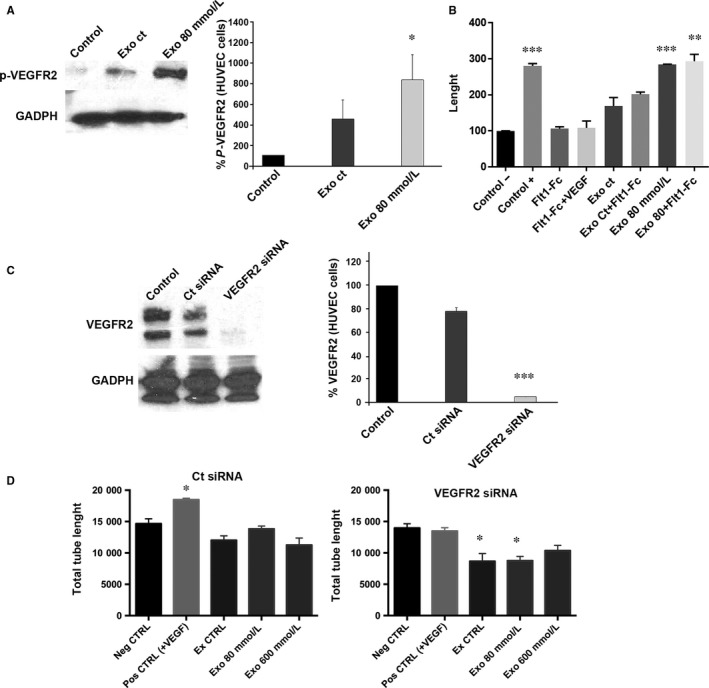
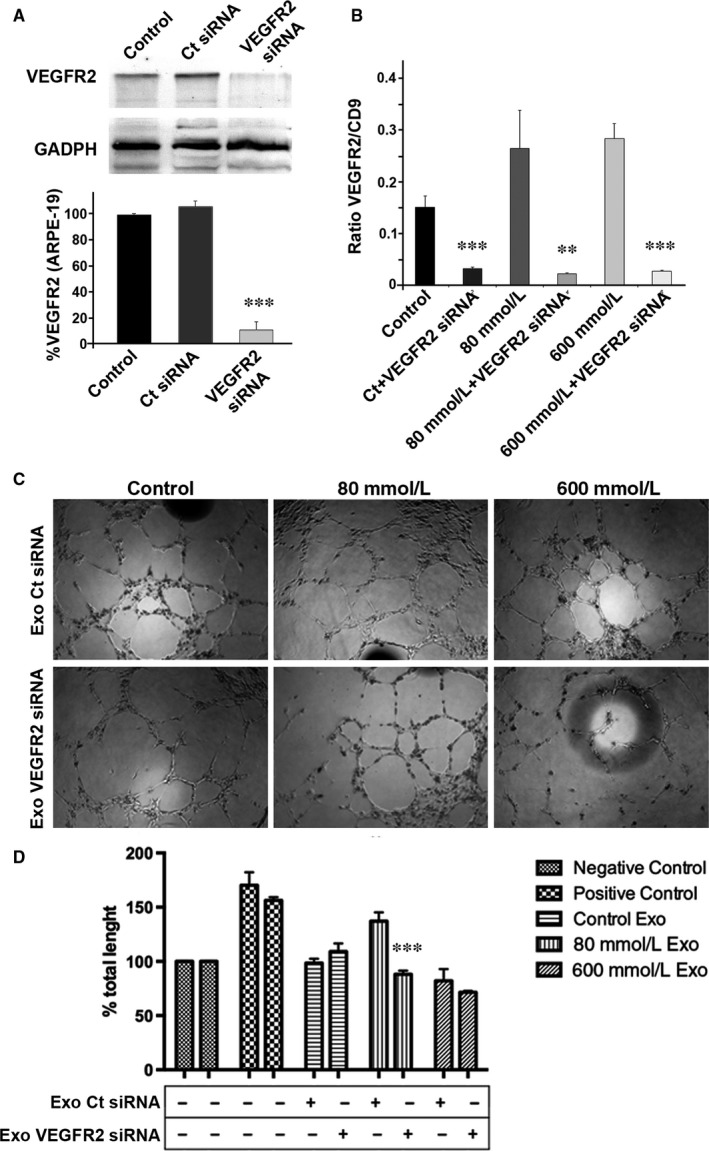
Autophagy and exosome secretion play important roles in a variety of physiological and disease states, including the development of age-related macular degeneration. Previous studies have demonstrated that these cellular mechanisms share common pathways of activation. Low oxidative damage in ARPE-19 cells, alters both autophagy and exosome biogenesis. Moreover, oxidative stress modifies the protein and genetic cargo of exosomes, possibly affecting the fate of surrounding cells. In order to understand the connection between these two mechanisms and their impact on angiogenesis, stressed ARPE-19 cells were treated with a siRNA-targeting Atg7, a key protein for the formation of autophagosomes. Subsequently, we observed the formation of multivesicular bodies and the release of exosomes. Released exosomes contained VEGFR2 as part of their cargo. This receptor for VEGF-which is critical for the development of new blood vessels-was higher in exosome populations released from stressed ARPE-19. While stressed exosomes enhanced tube formation, exosomes became ineffective after silencing VEGFR2 in ARPE-19 cells and were, consequently, unable to influence angiogenesis. Moreover, vessel sprouting in the presence of stressed exosomes seems to follow a VEGF-independent pathway. We propose that abnormal vessel growth correlates with VEGFR2-expressing exosomes release from stressed ARPE-19 cells, and is directly linked to autophagy.

Keywords: VEGFR2; angiogenesis; autophagy; exosomes; oxidative stress; retina; retinal pigment epithelium; siRNA.


Figures

Figure 1
Figure 1
Ultrastructural changes, apoptosis and autophagy in stressed ARPE‐19 cells. A, Photographs of control and treated ARPE‐19 cells were taken under the electron microscope. Atg7 siRNA was applied to control and stressed ARPE‐19 cultures. MVBs (arrows) and amphisomes (arrowheads) were observed in every case. B, Relative quantification of MVBs and amphisomes in the aforementioned culture types. C, Relative expression levels of p62 and Bax in ARPE‐19 cells untreated, treated with low (80 mmol/L) and high (600 mmol/L) concentrations of EtOH. D, Relative expression levels of Atg12 in ARPE‐19 cells untreated and treated with low and high EtOH concentrations. siRNA‐Atg7 trial: (E) 72 hours relative protein and (F) mRNA levels of LC3‐II and p62 before and after applying siRNA‐Atg7 (for 48 and 72 hours). Scale bars: 10 μm (upper panels), 500 nm (centre and bottom panels). Values are expressed as mean ± SEM (N ≥ 3). Significance levels: (when compared to control) P < .05 (*), P < .01 (**) and P < .001 (***); (when compared to treated with 80 mmol/L group) P < .05 (#) and P < .001 (###)
Figure 2
Figure 2
Release of EVs is increased in low‐stressed ARPE‐19 cells. A, Detection of EVs by flow cytometry. Exosomes are tracked using an antibody against CD9. B, Total number (left panel) and relative levels (right panel) of exosomes expressing Bax, Bcl‐2and Atg12 in ARPE‐19 cells untreated and treated with low and high EtOH concentration. C, Relative quantification of exosomes released from ARPE‐19 cells (control and stressed) after applying Atg7 siRNA. D, Relative levels of exosomes expressing p62, before and after applying Atg7 siRNA into control and stressed ARPE‐19 cell cultures. E, Relative levels of exosomes expressing Beclin‐1, before and after applying Atg7 siRNA into control and stressed ARPE‐19 cell cultures. Flow cytometry dot plots available in Figures S2 and S3. Values are expressed as mean ± SEM (N ≥ 3). Significance levels: (when compared to control) P < .05 (*), P < .01 (**) and P < .001 (***); (when compared to treated with 80 mmol/L group) P < .01 (##) and P < .001 (###)
Figure 3
Figure 3
Autophagy inhibition reduced VEGFR2‐positive fraction in EVs. A, Relative quantification of VEGFR2 expression in ARPE‐19 cells (control and stressed) was studied before and after Atg7 siRNA treatment. B, Total number (upper panel) and relative levels of exosomes expressing VEGFR2 in cultures of control and stressed (40, 80, 200 and 600 mmol/L) ARPE‐19 cells. C, Total number (upper panel) and relative levels of exosomes expressing VEGFR2 in cultures of control and stressed ARPE‐19 cells, before and after applying Atg7 siRNA. Flow cytometry dot plots available in Figure S3. Values are expressed as mean ± SEM (N ≥ 3). Significance levels: (when compared to control) P < .05 (*), P < .01 (**) and P < .001 (***); (when compared to treated with 80 mmol/L group) P < .05 (#) and P < .01 (##)
Figure 4
Figure 4
Inhibition of autophagy in RPE reduces EV‐related neovascularization in endothelial cells. A, Tube formation in HUVEC cultures after adding exosomes from ARPE‐19 cells (control and stressed) that were treated (or not) with Atg7 siRNA. Quantification of the total length of the tubes is shown in the bar chart. B, Sprouting capacity of HUVEC after 4 hours of treatment with exosomes released from ARPE‐19 cells (control and stressed), treated (or not) with Atg7 siRNA. Quantification of the total length of the sprouts is shown in the bar chart. Values are expressed as mean ± SEM (N ≥ 3). Significance levels: (when compared to control) P < .05 (*), P < .01 (**) and P < .001 (***); (when compared to treated with 80 mmol/L group) P < .05 (#) and P < .01 (##)
Figure 5
Figure 5
Angiogenesis of HUVEC is dependent of VEGFR2. A, Blots show expression of p‐VEGFR2 in HUVEC control, treated with exosomes from healthy RPE and treated with exosomes released from stressed RPE. The bar chart represents the relative levels of VEGFR2 expression when compared to control. B, When adding the VEGF trapper sFlt1, angiogenesis goes back to control levels, but when exosomes from stressed cells are used, sFlt1 does not arrest tube formation. C, Blots show expression of VEGFR2 in endothelial cells with or without VEGFR2 siRNA. The bar chart represents the relative levels of VEGFR2 expression when compared to control. D, When RPE‐released exosomes were added to endothelial cells, those where VEGFR2 siRNA was applied did show a significant decrease in tube length. Values are expressed as mean ± SEM (N ≥ 3). Significance levels: P < .05 (*), P < .01 (**) and P < .001 (***)
Figure 6
Figure 6
Angiogenesis depends on VEGFR2 from RPE‐released exosomes. A, Blots show expression of VEGFR2 before and after VEGFR2 siRNA was applied to ARPE‐19 cells. The bar chart represents the relative levels of VEGFR2 expression when compared to control. B, When VEGFR2 siRNA was applied in ARPE‐19 cultures, the set of exosomes expressing VEGFR2 was reduced significantly in every situation. C, HUVEC treated with exosomes from RPE cells treated differently form tubes. D, Total length after applying exosomes into HUVEC cultures. When exosomes from low‐stressed RPE cells treated with VEGFR2 siRNA were added to HUVEC cultures, total tube length was significantly reduced. Flow cytometry dot plots available in Figure S4. Values are expressed as mean ± SEM (N ≥ 3). Significance levels: P < .01 (**) and P < .001 (***)

References

    1. Winkler BS, Boulton ME, Gottsch JD, et al. Oxidative damage and age‐related macular degeneration. Mol Vis. 1999;5:32. - PMC - PubMed
    1. Flores‐Bellver M, Bonet‐Ponce L, Barcia JM, et al. Autophagy and mitochondrial alterations in human retinal pigment epithelial cells induced by ethanol: implications of 4‐hydroxy‐nonenal. Cell Death Dis. 2014;5:e1328. - PMC - PubMed
    1. Bonet‐Ponce L, Saez‐Atienzar S, da Casa C, et al. On the mechanism underlying ethanol‐induced mitochondrial dynamic disruption and autophagy response. Biochim Biophys Acta. 2015;1852:1400‐1409. - PubMed
    1. Yang Z, Klionsky DJ. Eaten alive: a history of macroautophagy. Nat Cell Biol. 2010;12:814‐822. - PMC - PubMed
    1. Mizushima N, Levine B, Cuervo AM, et al. Autophagy fights disease through cellular self‐digestion. Nature. 2008;451:1069‐1075. - PMC - PubMed

Publication types

MeSH terms

Substances