. 2018 Nov;12(11):1838-1855.
doi: 10.1002/1878-0261.12375. Epub 2018 Sep 21.

Intratumor heterogeneity defines treatment-resistant HER2+ breast tumors

Affiliations

Intratumor heterogeneity defines treatment-resistant HER2+ breast tumors

Inga H Rye et al. Mol Oncol. 2018 Nov.

Abstract

Targeted therapy for patients with HER2-positive (HER2+) breast cancer has improved overall survival, but many patients still suffer relapse and death from the disease. Intratumor heterogeneity of both estrogen receptor (ER) and HER2 expression has been proposed to play a key role in treatment failure, but little work has been done to comprehensively study this heterogeneity at the single-cell level. In this study, we explored the clinical impact of intratumor heterogeneity of ER protein expression, HER2 protein expression, and HER2 gene copy number alterations. Using combined immunofluorescence and in situ hybridization on tissue sections followed by a validated computational approach, we analyzed more than 13 000 single tumor cells across 37 HER2+ breast tumors. The samples were taken both before and after neoadjuvant chemotherapy plus HER2-targeted treatment, enabling us to study tumor evolution as well. We found that intratumor heterogeneity for HER2 copy number varied substantially between patient samples. Highly heterogeneous tumors were associated with significantly shorter disease-free survival and fewer long-term survivors. Patients for which HER2 characteristics did not change during treatment had a significantly worse outcome. This work shows the impact of intratumor heterogeneity in molecular diagnostics for treatment selection in HER2+ breast cancer patients and the power of computational scoring methods to evaluate in situ molecular markers in tissue biopsies.

Keywords: HER2; breast cancer; heterogeneity; in situ analysis; outcome; therapy response.


Figures

Figure 1
Figure 1
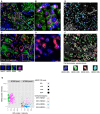
IFISH images reflecting intratumor heterogeneity before and after treatment. Expression of ER and HER2 protein and copy number of HER2 gene by IFISH (color code below images) for (A) pretreatment biopsy from patient #7588, (B) magnified image of the outlined area, (C) post‐treatment biopsy of patient #7588, and (D) magnified image of the outlined area. Pseudo‐colored cell phenotypes of (E) pretreatment biopsy (same area as in A), (F) post‐treatment biopsy (same area as in C). (G) Tumor cell heterogeneity before and after treatment for patient #7588, and the scatter plot shows the relationship between ER expression (X‐axis) and HER2 expression (Y‐axis) for each of the individual cells. The color reflects the cell phenotype. The size of the dot reflects each cells HER2 CN level, where a small dot equals fewer copies and a large dot more copies of the HER2 gene.
Figure 2
Figure 2
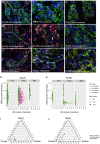
Biomarker status and later progression of disease. (A) Comparison of GoIFISH measurements (HER2 copy number (HER2 CN), cent17, ratio (HER2 CN/cent17), ER protein expression, and HER2 protein expression) for all pretreatment biopsies (n = 37) stratified by relapse or not after neoadjuvant treatment (Wilcox t‐test). (B) IFISH image from a patient with later relapse of disease (#7360). The cells were ER−, HER2+ with amplification of HER2 (same color scheme as in Fig. 1A–D). (C) IFISH image from a patient without later relapse of the disease (#7362). The sample was ER+, HER2+ with gain of HER2 copies.
Figure 3
Figure 3
Identification of subsets of HER2+ breast cancer patients by phenotypic diversity. (A) Unsupervised cluster analysis of the fractions of the phenotypic cell types HER2−/ER−, HER2+/ER−, HER2−/ER+, and HER2+/ER+ in the pretreatment samples (n = 37) where the percentage of each cell type (i.e., fraction) is indicated by the color intensity. Two large clusters and one small were identified, where cluster group P1 (n = 11) was dominated by HER2+/ER+ cells and cluster group P2 was dominated by HER2+/ER‐ cells. The smallest cluster group contained three patients whose tumors had mainly HER2− cells. The clinical information for each patient is illustrated by the boxes next to the dendrogram. (B) IFISH image to the left is from pretreatment biopsy from patient #6739 (in cluster group P1) which was dominated by HER2+/ER+ tumor cells. The image to the right is from the pretreatment sample from patient #7641 (cluster group P2) dominated by HER2+/ER− tumor cells. (C) Survival analyses; breast cancer‐specific death for the two groups (P = 0.24). D) Survival analyses; breast cancer‐specific death between patients with different percentage of ER+ cells (P = 0.14, log‐rank test).
Figure 4
Figure 4
Identification of subsets of HER2+ breast cancer patients by HER2 copy number diversity. (A) Unsupervised clustering based on the fractions of cells with different levels of HER2 copy number (normal, gain, or amplified). Three clusters (G1–G3) were identified. The clinical information for each patient is illustrated in the boxes next to the dendrogram. (B) FISH (HER2 CN) images from patient samples representing each of the three cluster groups (G1–G3). The top image is from cluster G2 (patient #6450) and shows a tumor dominated by HER2 CN amp cell type, the second image is from cluster G3 (patient #7379) and shows a sample with an intermediate fraction of cells with HER2 CN amp, and the last image is from cluster G1 (#7619) and shows a sample with a high fraction of HER2 CN gain and a low fraction of HER2 CN amp cell types. (C) Survival analyses showed significant differences in risk for progression between the two groups (P = 0.008, log‐rank test) but not for breast cancer‐specific death (D).
Figure 5
Figure 5
The spatial organization of the HER2 gene copies within the nuclei. (A) Each cell was categorized as ‘cluster’, ‘scatter’, and ‘mixed’ based on the spatial organization of the HER2 gene within the nuclei. (B) The spatial organization for the HER2 CN for the pretreatment samples (n = 37); in the triangle plot, each corner represents homogenous cell population (100% of cells have one of the spatial patterns). Samples from patients with complete response are colored in blue and from patients with noncomplete response are colored in red (Fisher's exact test, P = 0.007). C) Kaplan–Meier curve for time to disease progression for the categorized spatial organization ‘cluster’, ‘mix’, ‘scatter’, and the ‘< 70%’ groups. D) The spatial organization for the pretreatment samples where samples are colored by ER expression level (percentage of positive cells). ER‐negative samples are colored in red, ER low (1–10%) colored in green, ER intermediate (10–50%) colored in blue, and ER high (> 50%) colored in yellow (Fisher's exact test, P = 0.007).
Figure 6
Figure 6
Tumor evolution during neoadjuvant treatment. (A) The Kullback–Leibler diversity index (K‐L index) was calculated reflecting changes in cells with different levels of HER2 CN during therapy. The samples were sorted from high to low K‐L index, and the changes of the different cell typed from pre‐ to post‐treatment are visualized by the delta values. To the right are the K‐L index value and the genotypic and phenotypic cluster group for each patient. (B) A significant increase in risk for death of breast cancer was seen for patients with low versus high K‐L index (P = 0.035, log‐rank test). (C) Example images from pre‐ and post‐treatment biopsies from one patient with high K‐L index (patient #7588) and from a patient with low K‐L index (patient #7435).
Figure 7
Figure 7
Intratumor heterogeneity during disease progression. IFISH images from biopsies from patient #7435 (with a magnified area to the right): (A) pretreatment biopsy, (B) post‐treatment biopsy, and (C) biopsy from a metastasis. Equally from patient #7360: (D) pretreatment biopsy, (E) post‐treatment biopsy, and (F) biopsy from metastasis (Dapi = blue, HER2 = green, ER = red, HER2 = yellow, and cent17 = cyan). The phenotype and HER2 CN level for all tumor cells analyzed from each of the three biopsies are plotted in the diagram (G) patient #7435 and (H) patient #7360 (colored due to their phenotypic cell type and the size of the spot reflect the HER2 copy number level). Spatial organization of the HER2 gene visualized in a triangle for the pre‐treatment (red square), post‐treatment (green circle), and metastatic (blue triangle) sample from patient #7435 (I) and patient #7360 (J).

References

    1. Arena V, Pennacchia I, Vecchio FM and Carbone A (2013) HER‐2 intratumoral heterogeneity. Mod Pathol 26, 607–609. - PubMed
    1. Arnould L, Arveux P, Couturier J, Gelly‐Marty M, Loustalot C, Ettore F, Sagan C, Antoine M, Penault‐Llorca F, Vasseur B et al (2007) Pathologic complete response to trastuzumab‐based neoadjuvant therapy is related to the level of HER‐2 amplification. Clin Cancer Res 13, 6404–6409. - PubMed
    1. Ballard M, Jalikis F, Krings G, Schmidt RA, Chen YY, Rendi MH, Dintzis SM, Jensen KC, West RB, Sibley RK et al (2017) ‘Non‐classical’ HER2 FISH results in breast cancer: a multi‐institutional study. Mod Pathol 30, 227–235. - PubMed
    1. Bartlett AI, Starcyznski J, Robson T, Maclellan A, Campbell FM, van de Velde CJ, Hasenburg A, Markopoulos C, Seynaeve C, Rea D et al (2011) Heterogeneous HER2 gene amplification: impact on patient outcome and a clinically relevant definition. Am J Clin Pathol 136, 266–274. - PubMed
    1. Baselga J, Bradbury I, Eidtmann H, Di Cosimo S, de Azambuja E, Aura C, Gómez H, Dinh P, Fauria K, Van Dooren V et al (2012) Lapatinib with trastuzumab for HER2‐positive early breast cancer (NeoALTTO): a randomised, open‐label, multicentre, phase 3 trial. Lancet 379, 633–640. - PMC - PubMed

Publication types