. 2018 Sep 13;61(17):7862-7876.
doi: 10.1021/acs.jmedchem.8b00817. Epub 2018 Aug 22.

Enthalpy-Driven Stabilization of Transthyretin by AG10 Mimics a Naturally Occurring Genetic Variant That Protects from Transthyretin Amyloidosis

Affiliations

Enthalpy-Driven Stabilization of Transthyretin by AG10 Mimics a Naturally Occurring Genetic Variant That Protects from Transthyretin Amyloidosis

Mark Miller et al. J Med Chem. .

Abstract

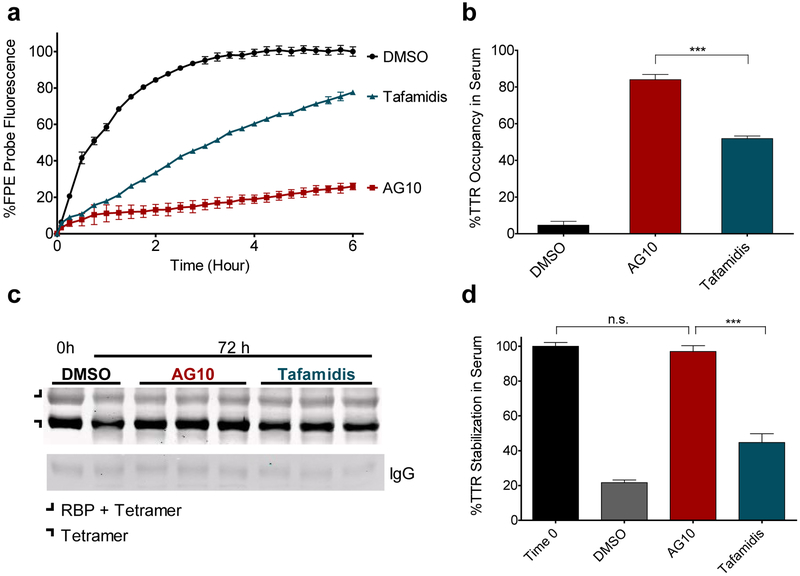
Transthyretin (TTR) amyloid cardiomyopathy (ATTR-CM) is a fatal disease with no available disease-modifying therapies. While pathogenic TTR mutations (TTRm) destabilize TTR tetramers, the T119M variant stabilizes TTRm and prevents disease. A comparison of potency for leading TTR stabilizers in clinic and structural features important for effective TTR stabilization is lacking. Here, we found that molecular interactions reflected in better binding enthalpy may be critical for development of TTR stabilizers with improved potency and selectivity. Our studies provide mechanistic insights into the unique binding mode of the TTR stabilizer, AG10, which could be attributed to mimicking the stabilizing T119M variant. Because of the lack of animal models for ATTR-CM, we developed an in vivo system in dogs which proved appropriate for assessing the pharmacokinetics-pharmacodynamics profile of TTR stabilizers. In addition to stabilizing TTR, we hypothesize that optimizing the binding enthalpy could have implications for designing therapeutic agents for other amyloid diseases.


Conflict of interest statement

Notes

The authors declare the following competing financial interest(s): Authors M.A. and I.G. are cofounders of Eidos Therapeutics. R.Z, N.K., J.F., and U.S. are employees of Eidos Therapeutics. The remaining authors declare noncompeting financial interests.

Figures

Figure 1.
Figure 1.
Binding Affinities and Potency of Stabilizers for TTR in Buffer. (a) Interaction of TTR with stabilizers assessed by ITC. Thermodynamic data (summarized in Table 1); ΔG are blue bars, ΔH are green bars, and -TΔS are red bars. (b) Fluorescence change caused by modification of TTR in buffer (2.5 μM) by FPE probe monitored in the presence of probe alone (Control DMSO) or TTR stabilizers (2.5 μM; 1:1 Stabilizers to TTR ratio). (c) Bar graph representation of percent occupancy of TTR in buffer by stabilizers in the presence of FPE probe measured after 3 hr of incubation relative to probe alone. Error bars indicate SD (n = 3). The significance of the differences were measured by one-way ANOVA followed by Tukey’s multiple comparison test (*p ≤ 0.05; ***p ≤ 0.001).
Figure 2.
Figure 2.
Efficacy of stabilizers in occupying and stabilizing TTR in human serum. (a) Representative western blot image for the stabilization of TTR in human serum subjected to acid-mediated (pH 4.0) denaturation in the presence of AG10 (10 μM) and other stabilizers tested at their estimated mean clinical Cmax at steady state when administered at the doses indicated: diflunisal (250 mg bid, 200 μM); tafamidis (80 mg qd), 20 μM; tolcapone (100 mg tid), 20 μM. (b) Bar graph representation of stabilization data obtained from Western blot experiments. Error bars indicate SD (n = 3). (c) Fluorescence change caused by modification of TTR in human serum by FPE probe monitored in the presence of probe alone (Control DMSO), AG10 (10 μM), or TTR stabilizers (at their estimated mean clinical steady state Cmax). (d) Bar graph representation of percent occupancy of TTR in human serum by stabilizers in the presence of FPE probe measured after 3 hr of incubation relative to probe alone. Error bars indicate SD (n = 4). The significance of the differences were measured by one-way ANOVA followed by Tukey’s multiple comparison test (n.s., not significant; *p ≤ 0.05; **p ≤ 0.01; ***p ≤ 0.001)
Figure 3.
Figure 3.
Crystal structures highlighting similar interactions caused by the T119M mutation and binding of AG10 to TTR. (a) Quaternary structure of AG10 bound to V122I-TTR (PDB: 4HIQ) shown as a ribbon representation with monomers colored individually. Close-up views of one of the two identical T4 binding sites with different colored ribbons for the two monomers of the tetramer composing the binding site. Key hydrogen bonds between the pyrazole ring of AG10 and S117/117’ are highlighted by dashed lines. (b) Crystal structure of the stabilizing T119M-TTR variant (PDB: 1FHN) with dashed lines highlighting key interactions between the hydroxyl groups of S117 and S117’. (c) Crystal structure of TTRwt (PDB: 3CFM). (d) Crystal structure of thermodynamically stabilized R104H-TTR (PDB: 1X7T).
Figure 4.
Figure 4.
The hydrogen bonds between the pyrazole ring of AG10 and S117/S117’ of TTR are important for effective binding to TTR. (a) Chemical structures and in silico docking study of synthesized AG10 analogues 1, 2, 3, and 4. Co-crystal structure of AG10 bound to TTR used for the docking experiment. 1 is the iodo-analogue of AG10. 2 is the methyl-ester form of AG10 that cannot form salt bridge with K15/15’. 3 is the methyl-pyrazole form of AG10 that can potentially form only one hydrogen bond with either K15 or K15’. 4 is the diethyl-pyrazole analogue of AG10 which affects both hydrogen bonds with S117/S117’. (b) Interaction of TTR with analogues assessed by ITC. Thermodynamic data; ΔG are blue bars, ΔH are green bars, and -TΔS are red bars. (c) Fluorescence change caused by modification of TTR in buffer (2.5 μM) by FPE probe monitored in the presence of probe alone (Control DMSO) or TTR stabilizers (2.5 μM; 1:1 Stabilizers to TTR ratio). (d) Bar graph representation of percent occupancy of TTR in buffer by stabilizers in the presence of FPE probe measured after 3 hr of incubation relative to probe alone. Error bars indicate SD (n = 3). (e) Bar graph representation of Western blot data for the stabilization of TTR in human serum by analogues (10 μM; 2:1 Stabilizers to TTR ratio). Error bars indicate SD (n = 4). The significance of the differences were measured by one-way ANOVA followed by Tukey’s multiple comparison test (n.s., not significant; *p ≤ 0.05; **p ≤ 0.01; ***p ≤ 0.001)
Figure 5.
Figure 5.
AG10 has high selectivity for binding TTR over albumin or other abundant human serum proteins. (a) Gel filtration and dialysis assay comparing AG10 and tafamidis (each at 30 μM) incubated with purified human serum albumin (600 μM). The concentration of tafamidis bound to albumin after gel-filtration (i.e. dialysis time 0 hr) was normalized to 100%. Error bars indicate SD (n = 3). (b) 24 hr time-course for dialysis of AG10 (10 μM) incubated with purified human TTR (5 μM). Error bars indicate SD (n = 3). (c) Fluorescence change due to modification of purified human TTR (5 μM) by FPE probe monitored for 6 hr in the presence of probe alone (black circles), probe plus albumin (600 μM) (black triangles), probe plus all [fibrinogen (5 μM), albumin (600 μM), IgG (70 μM), transferrin (25 μM)] (grey triangles); probe and AG10 (10 μM) (red squares) or probe and AG10 plus albumin (green diamonds), probe and AG10 plus all [fibrinogen (5 μM), albumin (600 μM) IgG (70 μM), transferrin (25 μM)] (blue circles). (d) %TTR occupancy in buffer by AG10 in the presence of FPE probe and other serum proteins measured after 3 hr of incubation relative to probe alone. (e, f) Same experiment described for AG10 was performed for tafamidis. Error bars indicate SD (n = 3). The significance of the differences were measured by one-way ANOVA followed by Tukey’s multiple comparison test (n.s., not significant; *p ≤ 0.05; **p ≤ 0.01; ***p ≤ 0.001)
Figure 6.
Figure 6.
Activity of AG10 and tafamidis in the FPE and Western blot assays performed with pooled dog serum. (a) Fluorescence change caused by modification of dog TTR in commercially available beagle dog serum by FPE probe monitored in the presence of probe alone (Control DMSO, black circles), AG10 (10 μM) or tafamidis (10 μM). (b) Percent occupancy of dog TTR in dog serum by AG10 and tafamidis in the presence of FPE probe measured after 3 hr of incubation relative to probe alone. Error bars indicate SD (n = 4). (c) Western blot image for the stabilization of TTR in pooled dog serum against acid-mediated denaturation in the presence of AG10 (10 μM) and tafamidis (10 μM). Serum samples were incubated with DMSO or test compounds in acetate buffer (pH 4.0) for the desired time period (0 and 72 h) before crosslinking and immunoblotting. (d) Bar graph representation of stabilization data obtained from Western blot experiments. Error bars indicate SD (n = 3). The significance of the differences were measured by one-way ANOVA followed by Tukey’s multiple comparison test (n.s., not significant; *p ≤ 0.05; **p ≤ 0.01; ***p ≤ 0.001)
Figure 7.
Figure 7.
Orally administered AG10 is effective in binding and stabilizing TTR in dogs. (a and b) Occupancy of TTR in beagle dogs after oral administration (q.d. for 7 days) of escalating doses of AG10. Circles (●) indicate pre-dose day 1, squares (■) indicate pre-dose day 7 (AG10 concentration at Cmin), and triangles (▲) indicate post-dose day 7 (AG10 concentration at Cmax). Four groups of animals were dosed: (i) 0 mg/kg (n=12, 6 males/6 females); (ii) 50 mg/kg (n=4, 2 males/2 females); (iii) 100 mg/kg (n=4, 2 males/2 females); (iv) 200 mg/kg (n=12, 6 males/6 females) (b) Bar graph representing TTR occupancy at 3 hr. Error bars indicate SD (n = 3). (c and d) Pharmacokinetic-Pharmacodynamic (PK-PD) analysis of AG10 in dogs receiving a single oral dose of AG10 at (c) 5 mg/kg and (d) 20 mg/kg. Scatterplot of concentration [AG10] vs. %TTR occupancy of serum samples obtained from dogs at various time points (n=4, 2 males/2 females per dosing group). Error bars indicate SD (n = 3). The significance of the differences were measured by one-way ANOVA followed by Tukey’s multiple comparison test (n.s., not significant; *p ≤ 0.05; **p ≤ 0.01; ***p ≤ 0.001).
Scheme 1:
Scheme 1:
synthesis of AG10 analogues 1, 2, 3, and 4. a) 5a i. acetylacetone, DBU, benzene, rt, 3 days; ii. hydrazine hydrate, ethanol, 90°C, 4 h; iii. NaOH, MeOH/water, 50°C, 14 h; b) 5b, i. acetylacetone, DBU, benzene, rt, 3 days; ii. hydrate, ethanol, 90°C, 4 h; c) 1. NaH, Mel, DMF. rt, 12 hr; ii. NaOH/water, 50°C, 14 h; d 5b, i. 3,5-Heptanedione, DBU, benzene, rt, 3 days; ii. hydrazine hydrate, ethanol, 90°C, 4 h; e) NaOH, MeOH/water, 50°C, 14 h.

References

    1. Falk RH; Comenzo RL; Skinner M The systemic amyloidoses. N Engl J Med 1997, 337, 898–909. - PubMed
    1. Johnson SM; Wiseman RL; Sekijima Y; Green NS; Adamski-Werner SL; Kelly JW Native state kinetic stabilization as a strategy to ameliorate protein misfolding diseases: a focus on the transthyretin amyloidoses. Acc Chem Res 2005, 38, 911–921. - PubMed
    1. Brunjes DL; Castano A; Clemons A; Rubin J; Maurer MS Transthyretin Cardiac Amyloidosis in Older Americans. J Card Fail 2016, 22, 996–1003. - PMC - PubMed
    1. Ton VK; Mukherjee M; Judge DP Transthyretin cardiac amyloidosis: pathogenesis, treatments, and emerging role in heart failure with preserved ejection fraction. Clin Med Insights Cardiol 2014, 8, 39–44. - PMC - PubMed
    1. Buxbaum JN; Ruberg FL Transthyretin V122I (pV142I)* cardiac amyloidosis: an age-dependent autosomal dominant cardiomyopathy too common to be overlooked as a cause of significant heart disease in elderly African Americans. Genet Med 2017, 19, 733–742. - PMC - PubMed

Publication types

MeSH terms

Supplementary concepts