. 2018 Oct 15;29(21):2578-2590.
doi: 10.1091/mbc.E18-04-0258. Epub 2018 Aug 22.

Brr6 plays a role in gene recruitment and transcriptional regulation at the nuclear envelope

Affiliations

Brr6 plays a role in gene recruitment and transcriptional regulation at the nuclear envelope

Anne de Bruyn Kops et al. Mol Biol Cell. .

Abstract

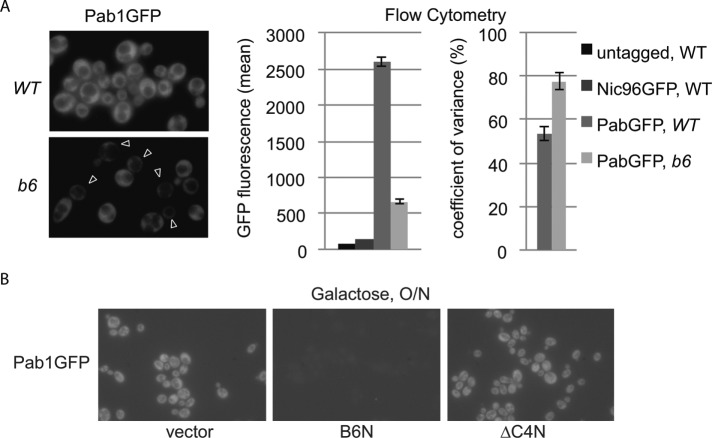
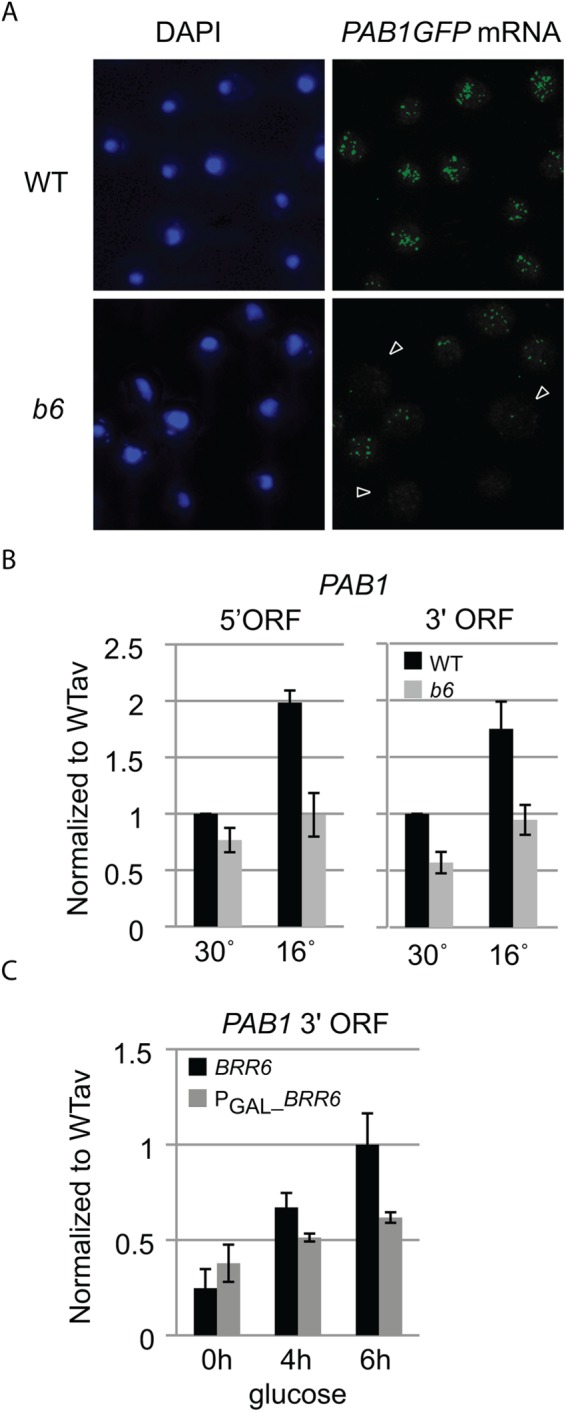
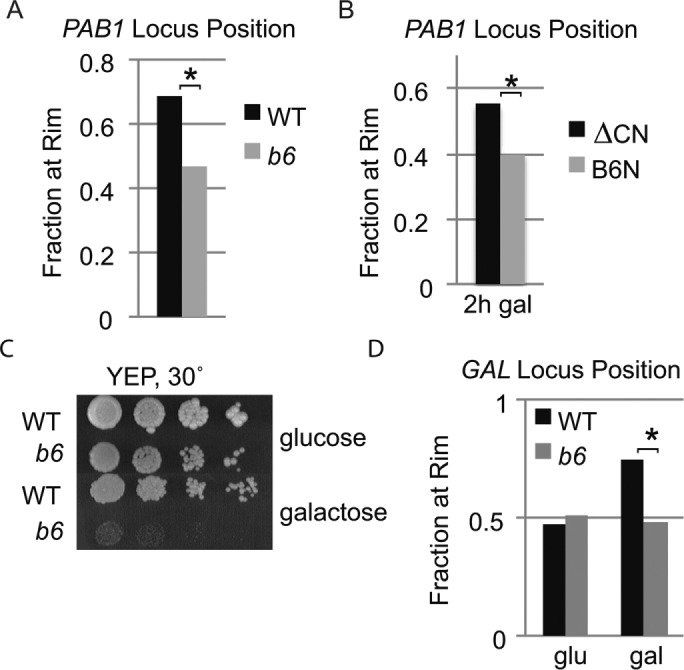
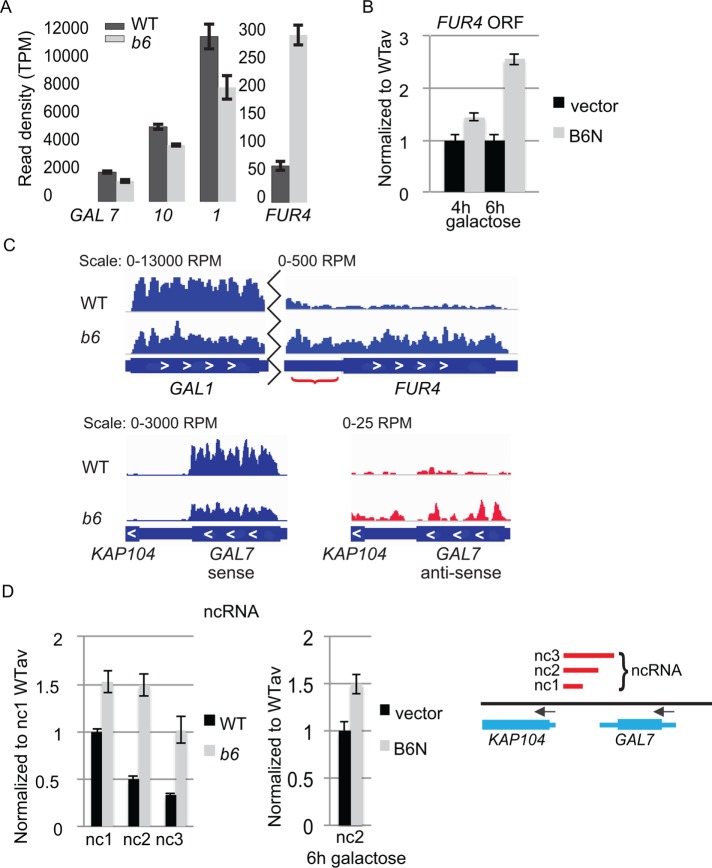
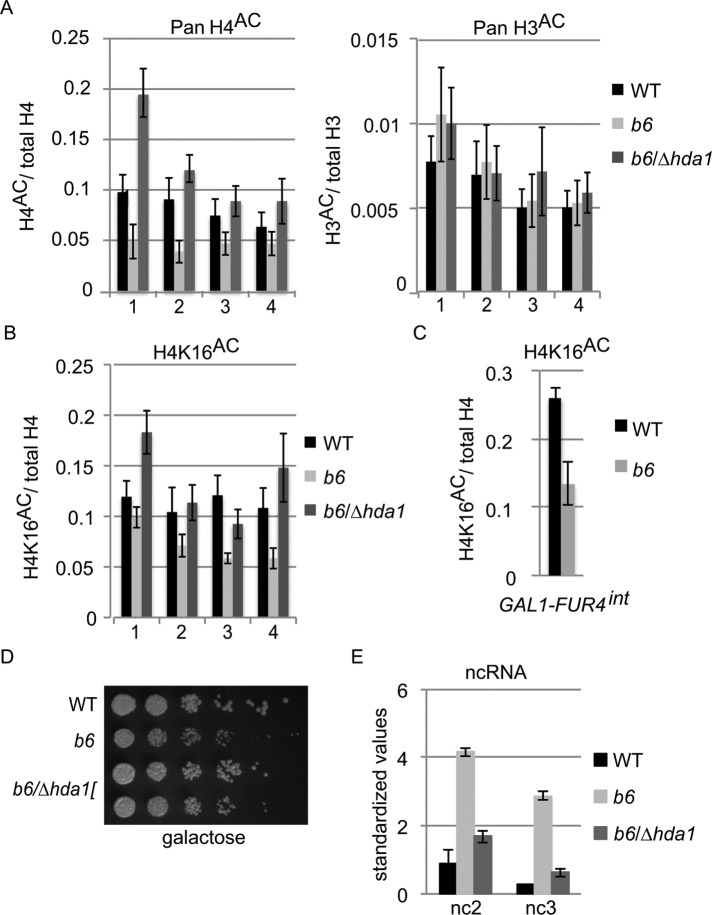
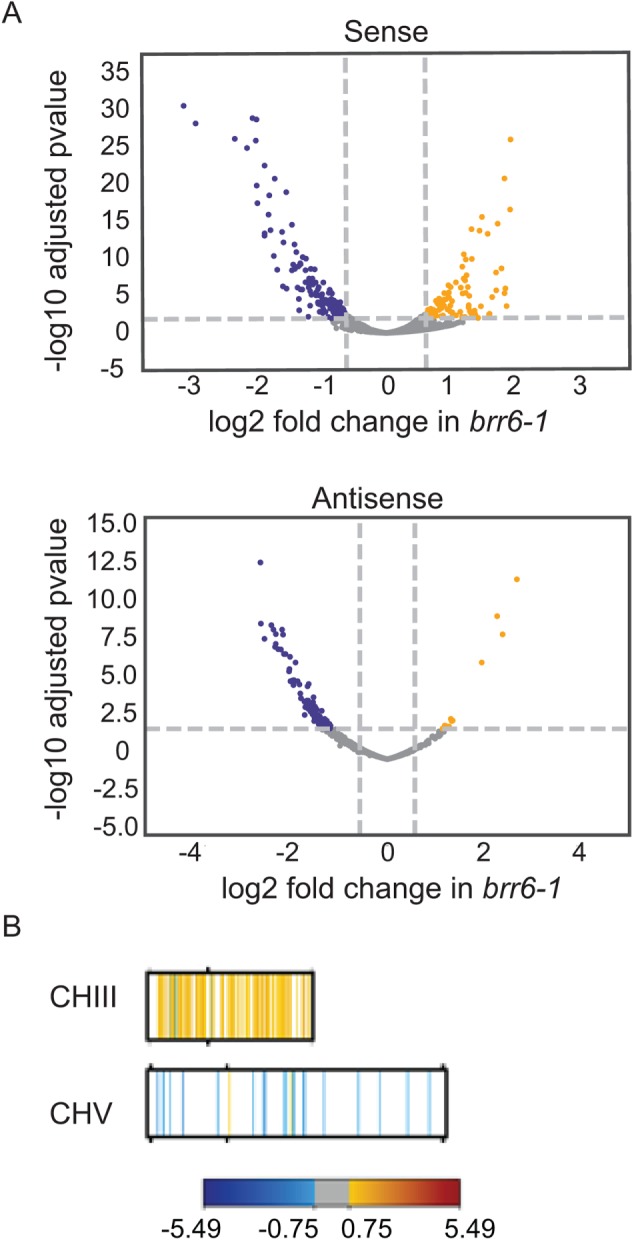
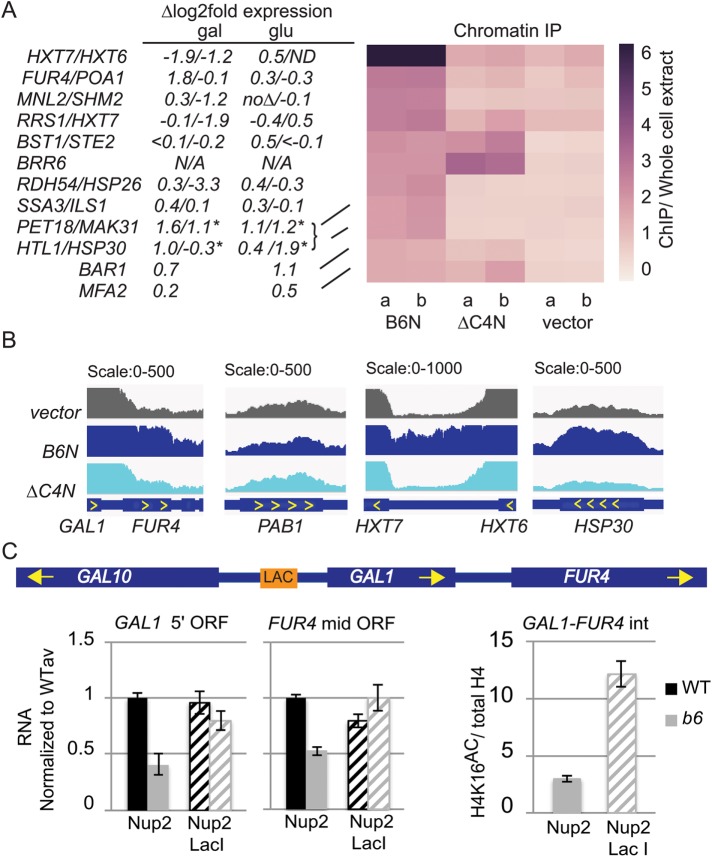
Correlation between transcriptional regulation and positioning of genes at the nuclear envelope is well established in eukaryotes, but the mechanisms involved are not well understood. We show that brr6-1, a mutant of the essential yeast envelope transmembrane protein Brr6p, impairs normal positioning and expression of the PAB1 and FUR4- GAL1,10,7 loci. Similarly, expression of a dominant negative nucleoplasmic Brr6 fragment in wild-type cells reproduced many of the brr6-1 effects. Histone chromatin immunoprecipitation (ChIP) experiments showed decreased acetylation at the key histone H4K16 residue in the FUR4-GAL1,10,7 region in brr6-1. Importantly, blocking deacetylation significantly suppressed selected brr6-1 phenotypes. ChIPseq with FLAG-tagged Brr6 fragments showed enrichment at FUR4 and several other genes that showed striking changes in brr6-1 RNAseq data. These associations depended on a Brr6 putative zinc finger domain. Importantly, artificially tethering the GAL1 locus to the envelope suppressed the brr6-1 effects on GAL1 and FUR4 expression and increased H4K16 acetylation between GAL1 and FUR4 in the mutant. Together these results argue that Brr6 interacts with chromatin, helping to maintain normal chromatin architecture and transcriptional regulation of certain loci at the nuclear envelope.


Figures

FIGURE 1:
FIGURE 1:
The brr6-1 mutant and the NLS-Brr6N fragment impair PAB1 expression. (A) Fluorescence microscopy localizing Pab1GFP in live isogenic WT (wild-type, yDBK398) and b6 (brr6-1, yDBK399) cells. Arrowheads indicate cells with little Pab1GFP protein signal. Plots show quantitation of Pab1GFP levels by flow cytometry. (B) Pab1GFP in wild-type cells (W303) carrying empty vector (pJL602), B6N (pPGAL_NLS-BRR6N-FLAG), or ∆C4N (pPGAL_NLS-brr6∆C4N-FLAG) grown in raffinose media then induced with galactose O/N.
FIGURE 2:
FIGURE 2:
brr6-1 decreases PAB1 transcript levels. (A) Single-molecule FISH detecting PAB1GFP mRNA in fixed isogenic WT (wild-type, yDBK165) and b6 (brr6-1, yDBK166) cells. Nucleus is detected by DAPI staining. Arrows indicate cells with little PAB1GFP RNA signal. Untagged control is shown in Supplemental Figure S2. (B) DN9 primed RT-qPCR detection of PAB1 5′ and 3′ ORF transcripts in total RNA prepared from WT (wild type, yDBK165) and b6 (brr6-1, yDBK166) cells grown at 30°C or shifted for 3 h to 16°C. (C) RT-qPCR detection of PAB1 3′ transcripts from BRR6 (yDBK155) and PGAL_BRR6 (yDBK192) cells following a time course of glucose repression. RT-qPCR data were normalized against a Cryptococcus RNA control (see Materials and Methods) and expressed relative to an averaged wild-type sample. Error bars (SEM) reflect four biological replicates.
FIGURE 3:
FIGURE 3:
brr6-1 and the NLS-Brr6N fragment impair PAB1 and GAL1-10 locus positioning. (A, B) Locus positioning assay showing fraction of PAB1 locus at the nuclear rim in homozygous diploid LAC O:PAB1 cells (A) WT (wild type, yDBK523) vs. b6 (brr6-1, yDBK524) and (B) wild-type (W303) cells carrying B6N (pPGAL_NLS-BRR6N) or ∆C4 (pPGAL_NLS-brr6∆C4N) fragment constructs. (C) Growth of WT (wild-type, yDBK165) and b6 (brr6-1, yDBK166) strains on YEP media containing glucose or galactose. (D) Locus positioning assay for GAL1-10 locus in homozygous diploid LAC O:GAL1 cells (WT [wild type, yDBK535] vs. b6 [brr6-1, yDBK536]). Asterisks indicate p value ≤6 × 10⁻⁵.
FIGURE 4:
FIGURE 4:
brr6-1 and the NLS-Brr6N fragment perturb coding and noncoding transcription at the FUR4-GAL1,10,7 gene region. (A) RNAseq results comparing transcript levels (read density [transcripts per million, TPM]) for GAL7, GAL10, GAL1, and FUR4 in WT (wild type, yPH399) vs. b6 (brr6-1, yDBK168). (B) RT-qPCR measurement of FUR4 ORF transcripts in wild-type cells (W303) carrying vector (pJL602) vs. the B6N (pPGAL_NLS-BRR6N) construct. (C) Bar plot of RPM-normalized aligned sense (blue) reads for GAL1 and FUR4 coding and intergenic regions (red bracket) and sense and antisense (red) reads for GAL7 (representative replicates). (D) DN9 primed RT-qPCR of ncRNA (nc1, 2, and 3) transcripts in WT (wild-type, yDBK165) and b6 (brr6-1, yDBK166) cells (left) and the nc2 transcript in wild-type cells (W303) carrying vector (pJL602) vs. the B6N (pPGAL_NLS-BRR6N) construct (middle). Amplicons (GAL nc1-3) are indicated by red bars in the region from KAP104 to GAL7 (right). qPCR data were normalized and expressed as in Figure 2. Error bars (SEM) reflect ≥3 biological replicates.
FIGURE 5:
FIGURE 5:
Aberrant transcription at FUR4 and GAL7 correlates with hypoacetylation at histone H4K16. (A, B) ChIP ratios of (A) pan-acetylated histone H4/total H4 pan-acetylated histone H3/total H3, and (B) lysine 16–acetylated H4 in WT (wild type, yDBK165), b6 (brr6-1, yDBK166), and b6/∆hda1 (brr6-1/∆hda1, yDBK169) cells following 2 h galactose induction. DNA was amplified using primer sets #1-4: #1-GAL10 3′ ORF, #2-GAL7 5′ ORF, #3-GAL7 3′ ORF, and #4-GAL7 3′ UTR. Total H4 and H3 values were normalized against WT prior to calculation of ratios. All antibody ChIP levels were >10× above mock ChIP. Error bars (SEM) reflect average of four biological replicates. (C) ChIP ratios of lysine 16–acetylated H4 amplified with primers for the GAL1-FUR4 intergenic region. (D) Growth of WT (wild type, yDBK165), b6 (brr6-1, yDBK166), and b6/∆hda1 (brr6-1/∆hda1, yDBK169) double mutants on YEP +2% galactose, 0.04% sucrose at 30°C. (E) DN9 RT-qPCR detection of GAL ncRNA (nc2 and nc3) transcripts in WT, b6, and b6/∆hda1 following galactose induction for 2 h at 30°C. qPCR data were normalized as in Figure 1. Error bars (SEM) reflect ≥3 biological replicates.
FIGURE 6:
FIGURE 6:
RNAseq analysis detects genomewide expression changes and CHIII disomy. (A) Volcano plots showing distribution of fold sense and anti-sense changes and adjusted p values in brr6-1(yDBK168) relative to wild-type (yPH399) cells following 2 h galactose induction (blue, fold decreases; yellow, fold increases; gray, changes between ± 0.75 log2 fold). Genes showing significant changes in galactose and glucose are listed in Supplemental Tables 3 and 4. (B) Mapping of genes showing altered sense reads in brr6-1 (galactose) along CHIII and CHV (for other chromosomes and glucose results see Supplemental Figure S5, A and B).
FIGURE 7:
FIGURE 7:
The NLS-Brr6N fragment associates with chromatin at FUR4 and several glucose- and heatshock-responsive genes. (A) Right: Heatmap of the average read density (RPKM, ChIP normalized to whole cell extract) of Brr6 binding sites in ChIP samples from W303 cells carrying vector (pJL602), B6N (pPGAL_NLS-BRR6N-FLAG), or ∆C4N (pPGAL_NLS-brr6∆C4N-FLAG) prepared following O/N galactose induction (two biological replicates). Regions of Brr6 binding were identified by sliding window (see Materials and Methods). Only regions with at least 1.5-fold ChIP/WCE are shown. Values are shown in Supplemental Table S5. qPCR confirming absence of CHIII disomy following B6N expression is shown in Supplemental Figure S7. (A) Left, changes in expression in brr6-1 obtained by RNAseq analysis are shown for associated genes (*genes on CHIII not affected by brr6-1 are predicted to show ∆log2 ≈ 1 expression changes due to disomy). (B) Bar plot of RPKM-normalized reads enriched in vector (pJL602), B6N (pPGAL_NLS-BRR6N-FLAG), or ∆C4N (pPGAL_NLS-brr6∆C4N-FLAG) samples showing GAL1-FUR4, PAB1, and HXT7-HXT6 and HSP30. (C) Left: RT-qPCR analyses of GAL1 5′ ORF and FUR4 mid-ORF transcript levels in cells carrying a LAC O tag upstream of GAL1 (see schematic) and either Nup2 and Nup2-Lac I URA3-marked constructs. (C) Right, comparison of H4K16 acetylation in the FUR4-GAL1 intergenic region brr6-1 cells carrying the LAC O tag and the Nup2 vs. Nup2-Lac I construct. Error bars (SEM) reflect three biological replicates.

Similar articles

Cited by

References

    1. Abruzzi KC, Belostotsky DA, Chekanova JA, Dower K, Rosbash M. (2006). 3'-end formation signals modulate the association of genes with the nuclear periphery as well as mRNP dot formation. EMBO J , 4253–4262. - PMC - PubMed
    1. Allahverdi A, Yang R, Korolev N, Fan Y, Davey CA, Liu C-F, Nordenskiöld L. (2011). The effects of histone H4 tail acetylations on cation-induced chromatin folding and self-association. Nucleic Acids Res , 1680–1691. - PMC - PubMed
    1. Anders S, Pyl PT, Huber W. (2015). HTSeq—a Python framework to work with high-throughput sequencing data. Bioinformatics , 166–169. - PMC - PubMed
    1. Andrulis ED, Neiman AM, Zappulla DC, Sternglanz R. (1998). Perinuclear localization of chromatin facilitates transcriptional silencing. Nature , 592–595. - PubMed
    1. Andrulis ED, Zappulla DC, Ansari A, Perrod S, Laiosa CV, Gartenberg MR, Sternglanz R. (2002). Esc1, a nuclear periphery protein required for Sir4-based plasmid anchoring and partitioning. Mol Cell Biol , 8292–8301. - PMC - PubMed

Publication types

MeSH terms